
Chapter 8
Planning for Strategy Deployment
In This Chapter
![]() Introducing the strategy deployment process cycle
Introducing the strategy deployment process cycle
![]() Looking at your critical objectives
Looking at your critical objectives
![]() Building the strategy deployment architecture
Building the strategy deployment architecture
![]() Getting to grips with catchball
Getting to grips with catchball
![]() Developing the X Matrix
Developing the X Matrix
This chapter covers the Improve phase of DRIVE, whereby you plan the enactment of your transformational business strategy using strategy deployment tools and methodology.
The DRIVE model is a systematic approach to ensuring a successful business transformation journey. It involves five phases – Define, Review, Improve, Verify and Establish. We introduce how to drive the Lean Six Sigma transformation journey by deploying business strategy using the DRIVE model in Chapter 3.
Making Strategy Deployment Happen in Practice
Strategy deployment (SD) has been adapted from the Japanese strategic planning and management system called Hoshin Kanri, and has evolved based on best practices established in deploying strategies in companies over the past 15 years. We introduced the concept of Hoshin Kanri in Chapter 2 when we discussed planning for the transformation.
Strategy deployment is a rapid, systematic and sustainable approach to successful strategy execution. It realigns resources around the ‘critical few’ initiatives and makes sure that people are working on the right things. It provides a direct link between strategic thinking and tactical action. It breaks strategy down into actionable steps and engages and aligns everyone with the organisation’s strategy. It uses standardised tools, monitors results, and tracks and corrects deviations.
 Many organisations seem to struggle with strategy execution, finding it difficult to focus tactical initiatives on achieving strategic objectives. As a result, people waste time and resources on the wrong things.
Linking back to strategy
Preparing for the SD process during the strategy review process is described in Chapter 5. It involves reviewing the strategic plan and developing the strategic essentials. The strategic essentials provide the starting point for SD and are clear, single-dimensional statements that summarise the long-term (three to five year) business strategy. They’re often expressed very simply, for example ‘grow sales’, ‘reduce costs’, ‘develop people’ and so on. However, they should have some measurable and verifiable end goal to aim for, such as ‘number one in the market’ or ‘produce upper-quartile returns’.
Typically, the strategy review will identify three to four strategic essentials.
 Choose only a few strategic essentials – three or four is typical. You need to make sure that when they’re broken down into short-term (annual) goals called focus areas and cascaded, the organisation has a manageable number of initiatives to achieve.
Following the strategy deployment steps
Strategy deployment follows the Plan–Do–Check–Act (PDCA) cycle that is described in detail in Chapter 1. So how does SD work?
The SD process, illustrated in Figure 8-1, is initiated as part of the organisation’s annual business planning when the leadership team scans and reviews its current strategy plan. The Plan phase starts when it develops the general statements of direction for the organisation in the medium to long term – the strategic essentials. Chapter 5 discusses reviewing the strategic plan and developing strategic essentials.
The leadership team define the medium- and long-term critical objectives and the shorter-term focus areas. These are then cascaded to the next level of management, which breaks the focus areas down into short-term process improvements. We recommend using the catchball process to gain consensus and alignment (described in detail in the ‘Playing Catchball’ section later in this chapter). Teams are then assigned to establish detailed action plans, targets and metrics so that achievement of the process improvements can be effectively managed.
The Do phase involves mobilisation of the necessary resources to implement the process improvements using appropriate Lean Six Sigma methods (DMAIC or DMADV), which are covered in Chapter 1.
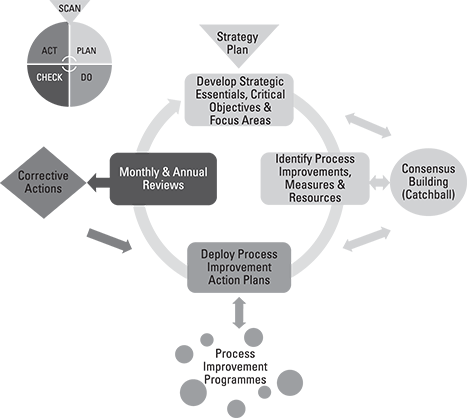
Figure 8-1: The strategy deployment process.
As these improvements are completed they’re managed as part of the everyday management system. This system focuses on the operation and monitoring of workflow by managing performance and looking for further improvement opportunities. This approach is described in more detail in Chapter 12.
The Check phase involves monthly reviews to establish the progress being made by the improvement teams. If the planned progress is not being achieved, improvement teams will need to follow a formal corrective action or countermeasures process – the Act phase – to understand the root cause(s) of the issues and put in place an appropriate recovery plan.
Progress is also reviewed by the leadership team as part of the annual business planning process. This could result in changes to the focus areas, with corresponding new process improvements agreed for the following year.
To support the SD process, we recommend the use of four documents, as shown in Figure 8-2:
- The X Matrix
- Action plan
- Tracking chart
- Countermeasure
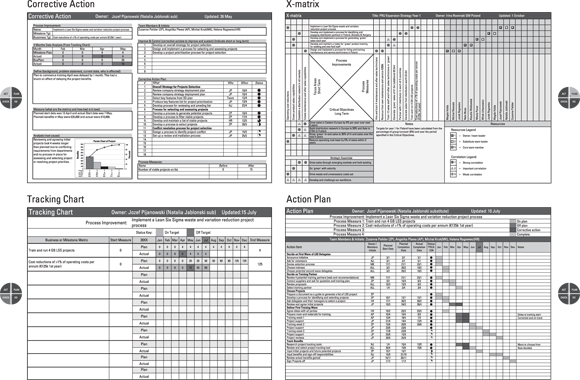
Figure 8-2: The strategy deployment document set.
The purpose of the X Matrix, and how to use it, is covered later in this chapter in the section, ‘Introducing the X Matrix’. The action plan, tracking chart and countermeasure are covered in Chapter 9. It suffices to say here that they logically follow the PDCA process to help drive improvement.
Decomposing and Cascading the Critical Objectives
We must next establish the critical objectives. The critical objectives break down the strategic essentials into a number of measurable goals that need to be achieved over the medium to long term – see Figure 8-3.

Figure 8-3: Example critical objectives.
The critical objectives should stretch the organisation, but how to achieve them may not be immediately clear. The critical objectives express the strategic essentials in Specific, Measurable, Achievable, Relevant and Time-bound (SMART) ways.
They should specify defined goals with a ‘from–to’ structure, and represent a significant performance improvement challenge (a breakthrough). The critical objectives typically cross functional boundaries and may well involve several processes. Critical objectives have medium- to long-term goals, typically from two to five years.
Targeting your critical objectives
A lot of thought needs to go into defining the critical objectives, and they should focus on achieving the strategic vision for the business. Consider benchmarking your organisation against other companies to establish the required levels of performance improvement the strategic objectives are meant to achieve.
Don’t base your critical objectives solely on your competition or industry. Think about the vision, and ask yourself what the desired situation or the organisation would look like and then allow that to be your driver.
A mistake companies commonly make is focusing on current best-in-class results. Critical objectives need to be focused on achieving projected world-class performance.
Establishing focus areas
We must now establish focus areas, which are the critical objectives broken down into logical steps. More than one focus area may be needed for each critical objective, but try to limit them to two or three.
Focus areas are quite broad statements of intent and are themselves capable of being broken down into several process improvements. They should be measurable and are usually expressed in the form ‘from x to y’, as shown in Figure 8-4. Focus areas should be short term – 12 months or less.
Focus areas are part of a multi-step plan to achieve the strategic essentials and they’ll be tied to specific critical objectives. When you define a focus area, try to ensure that it’s customer-focused. Also make sure it has a measurable and verifiable end goal, based on the ‘from–to’ structure.
 Make sure that each focus area is capable of being cascaded throughout the organisation.
Specifying process improvements
When the focus areas are agreed on, you can then identify the specific process improvements needed. These break down the focus areas into manageable projects (as shown in Figure 8-5).

Figure 8-4: Example focus areas.

Figure 8-5: Example process improvements.
A process improvement should be a sustainable process and not a one-off action because you need to ensure that you’re building long-term capability. Several process improvements can exist for each focus area and the objectives of each must be SMART. A multi-functional team needs to be set up to develop a detailed action plan for the achievement of process improvements.
Process improvement plans need to strike a balance between being too detailed and narrow and too broad and nebulous.
To ensure the organisation doesn’t have too many projects to run and manage, choose only the top three or four process improvements required to achieve the critical objectives.
Creating the Strategy Deployment Architecture
The strategic essentials, critical objectives and focus areas define what the organisation will work on. That information now needs to be cascaded across and down the organisation. How this cascading is deployed depends on the nature of the focus areas and the structure of the organisation.
You may find building up a simple flow diagram useful (see Figure 8-6) to show how the strategy architecture will be divided throughout the company. In decentralised companies, regions and functions will usually be given autonomy to decide how they will cascade SD within their own operation. We recommend that SD be cascaded through only one or two levels.
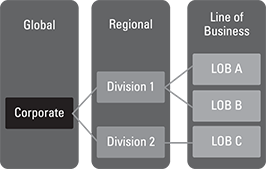
Figure 8-6: Example SD architecture.
Cascading to the point of impact
The SD must be cascaded to the people involved with the specific processes identified for improvement – the point of impact (see Figure 8-7). Typically, the point of impact is a significant process, for example a new product introduction process, and involves a cross-functional team working together to design and implement a new process, or improve an existing process if one is already in place (albeit with problems).

Figure 8-7: Cascading to the point of impact.
Creating the strategy deployment roll-out schedule
When the SD architecture and cascade structure have been defined, an SD roll-out plan should be created (see Figure 8-8), identifying the individual SD events and dates, as well as the resources assigned.
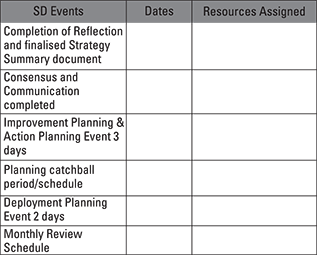
Figure 8-8: Example SD roll-out schedule.
Playing Catchball
To help gain buy-in from the organisation, a game of catchball is a good idea. Catchball is a participative approach to decision-making, and assists the shaping and development of the actions needed to deploy the transformation strategy. The strategic essentials, critical objectives and focus areas, together with information and ideas, are ‘thrown’ and ‘caught’ back and forth, up and down throughout the organisation. This process is normally conducted as a formal structured meeting, which allows people to reflect on the issues before passing on the ‘ball’ to another team or layer of management, for example. Ultimately, consensus is gained throughout the organisation. As well as helping to secure buy-in, catchball should be used throughout the organisation as a tool to spur discovery and new ideas. Although not necessarily easy, try to keep the catchball process simple and control the timescales.
Planning a catchball meeting
For your catchball meetings to run smoothly and efficiently they need to be designed to achieve a particular purpose. You can use a terms of reference document (see Figure 8-9) to let people know why they are required and what you expect of them. This document should include the purpose of the meeting, required attendees, the agenda, and information inputs and expected outputs from the meeting.

Figure 8-9: Terms of reference document for a catchball meeting.
Apply the input–process–output (IPO) model to planning a catchball meeting. Everyone should be clear about the Inputs they are expected to make, the meeting Process itself and the Outputs expected from it. To ensure that participants are prepared for the meeting, distribute any necessary documents a few days in advance and ask them to review them. Remember to book a room for your catchball meeting and to provide the necessary equipment for presentations, such as flipcharts, paper, sticky notes and pens, and so on.
Running a catchball meeting
Enter a catchball meeting with an open mind and use discussion and dialogue (see Figure 8-10).
The senior management of an organisation often find that catchball provides an opportunity to coach subordinates. Coaching can get them thinking more deeply about their plans and actions and how they might link to the longer-term objectives and focus areas of the organisation. The catchball process also provides an opportunity for you to learn more about your organisation and the capabilities already in place. For team members it’s an opportunity to show what they can do and to learn more about the wider aspects of the business.
Wherever possible, use data and facts during the catchball sessions. People’s unsupported opinions can quickly lead into argument and debate, and possibly a win or lose situation.
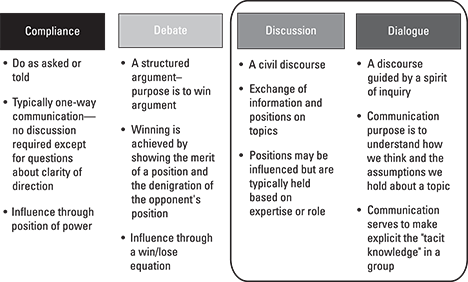
Figure 8-10: Communication process for catchball.
Setting the catchball meeting agenda
A typical agenda for a catchball meeting should include:
- Introductions (if required).
- An outline of the purpose of the meeting.
- A restatement of strategic essentials, critical objectives and focus areas.
- A review of documentation relating to the subject of the meeting, such as the current status of a process improvement.
Build consensus throughout the meeting through open discourse, and record any changes and areas of agreement. Conclude the meeting by summarising the outcomes and thank the team for their time.
If conflict arises and starts to dominate the meeting, put the issue in a ‘parking’ area for later resolution. It’s important to stay focused.
Following on from a catchball meeting
Following a catchball session it is important to update the relevant stakeholders. Refer to any RACI charts (which we discuss in Chapter 3) to ensure the relevant communication requirements are met, and issue the minutes of the meeting promptly, ideally within 24 hours.
Introducing the X Matrix
The X Matrix is so named because of its shape – see Figures 8-11 and 8-12 later in this section. It offers the unique advantage of allowing you to ‘visualise’ your strategy deployment design by illustrating it on one piece of paper.
The document records the decisions (and supporting discussions) needed to communicate and execute an effective strategy.
Identifying the what, how, how much and by when, and who
The X Matrix enables you to see the direct link from the focus areas, which is what you need to do to achieve the critical objectives, to the process improvements, which provide how you will do it. Each process improvement will have its own metrics that provide the goals in terms of how much and by when, as well as the resources – that is, the teams who will be involved in the process improvement. See Figure 8-11 for how these elements of the X Matrix interrelate.
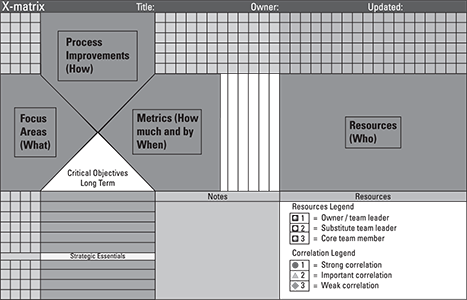
Figure 8-11: The X Matrix: the what, how, how much and by when, and who of SD.
Looking at the components of the X Matrix
The X Matrix is constructed during the SD planning phase and then updated as required during implementation. It has the following components, as illustrated in Figure 8-12:
- Strategic essentials (1): The top three or four key things that must get done in the medium to longer term.
- Critical objectives (2): The strategic essentials expressed as objectives.
- Focus areas (3): The shorter-term key areas to focus on in order to achieve the critical objectives.
- Process improvements (4): The individual improvements within the focus areas, which typically involve developing or improving one or more processes.
- Process measures (5): The metrics needed to track the progress and achievement of the process improvements. Two types of process measure exist:
- Milestone metrics show progress in the implementation of the process improvement.
- Business metrics show how the process improvement will impact business performance.
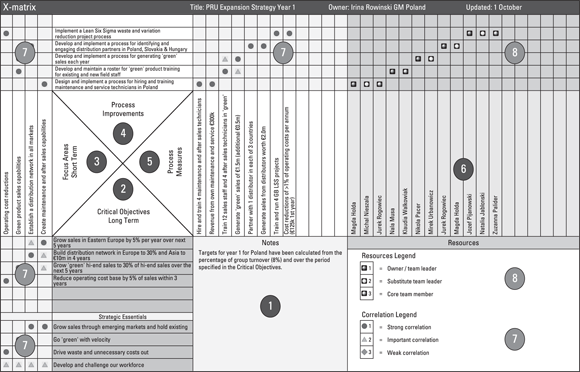
Figure 8-12: Components of the X Matrix.
More than one of each type is possible, but using just one of each that has a clear correlation with the desired improvement is best.
- Resources (6): The team leader or deputy, specialists and advisors (if involved) are listed. They’re responsible for achieving the process improvement. Other resources are usually shown on the detailed action plan.
- Correlation matrices (7): These show the linkage between the strategic essentials, critical objectives and focus areas; focus areas and process improvements; and process improvements and process measures.
- Resource correlation matrix (8): This shows the linkage between process improvements and the key resources responsible for their delivery.
Working out how to use the X Matrix
Using the DRIVE model to plan your organisation’s transformation journey (as described in Chapter 3), you’ll have prepared a first draft X Matrix in the Prepare stage of the Improve phase. You’ll then have updated it during the Shape stage. The X Matrix then needs to be reviewed and updated at the end of each step of the SD process.
Understanding the interrelationships and correlations between components is vital. Without this knowledge and awareness, you will be unaware of potential knock-on effects of various initiatives and you run the risk of sub-optimisation of the process improvements – see Figure 8-13.
Establishing process measures
Once the process improvements have been agreed, you need to establish the measurements that will be used to assess improvement performance.
Two types of process measure exist: milestone measures and business measures (see Figure 8-14). Each process improvement may have either or both types and may have more than one of each to fully describe it:
- Milestone measures:
- Provide a means of assessing progress towards implementation.
- Should be objective, not subjective.
- Do not need to link to focus areas or critical objectives.
- Could show the percentage completion or a quantity, for example X out of Y achieved.
So, if a process improvement is ‘Develop and implement a training and project delivery process for Lean Six Sigma this year,’ a corresponding milestone metric might be ‘Train 15 Green Belts and three Black Belts in the next year.’
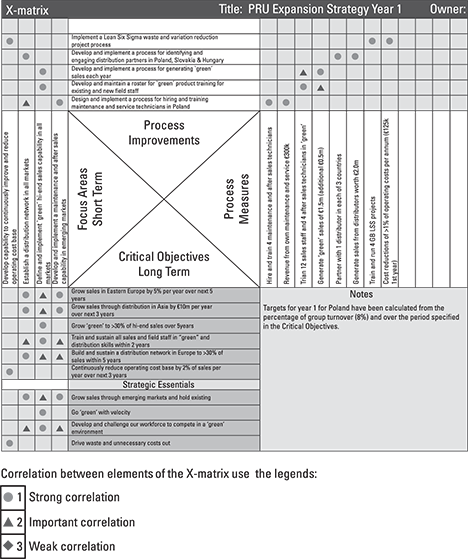
Figure 8-13: X Matrix correlation.
- Business Measures:
- Show a cause-and-effect relationship with a specific process improvement.
- Aid the achievement of critical objectives by ensuring that business measures related to a process improvement result in the successful achievement of critical objectives over time.

Figure 8-14: Example process measures.
So, if the related process improvement is ‘Design and implement a sales force competence assessment and improvement process,’ a corresponding business measure might be ‘Sales force competence index increases from 5 to 7.5 by 31 December.’
Sorting out the human resources
With defined process improvements and performance metrics in place, you need to identify the key players in the teams responsible for each process improvement. These are typically the team leader, and any essential or core team members.
You may find that process improvements are related to end-to-end processes that span organisational functions, in which case it will be necessary to identify a key resource from within each area.
Add the names of the relevant individuals to the X Matrix or action plans as appropriate, and use a correlation symbol to denote the specific process improvement they’ll be working on – see Figure 8-15.
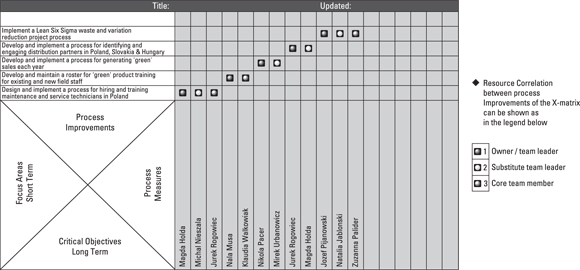
Figure 8-15: Resource correlation.
We cover the roles of the individual process improvement team members as we start to implement SD in Chapter 9.