Chapter 4
Entering and Defining Data
In This Chapter
![]() Considering your choices when defining a variable
Considering your choices when defining a variable
![]() Defining variables
Defining variables
![]() Entering numbers
Entering numbers
![]() Making sure that you’re using the right measurement type
Making sure that you’re using the right measurement type
To process your data, you have to get it into the computer. Entering data has been a problem with computers since the beginning. No matter how you decide to get your numbers into SPSS, at some point someone has to type them (unless they come from some form of automatic monitoring). These days, it feels like we spend half of our time entering data into online forms, which saves some analyst from typing on the other end. SPSS can read data from other places. You can also type directly into SPSS — and, if you want, copy the data to places other than SPSS later.
Entering data into SPSS is a two-step process: First, you define what sort of data you’ll be entering. Then you enter the actual numbers. This may sound difficult, but it isn’t so bad. When you see how data entry works in SPSS, you’ll discover you have some pretty nifty software to help you.
You organize your data into cases. Each case is made up of a collection of variables. First, you define the characteristics of the variables that make up a case, and then you enter the data into the variables to make up the contents of the cases. This chapter shows you how to work with this technique of getting data into your system.
Entering Variable Definitions on the Variable View Tab
You use the Variable View tab of the Data Editor window, shown in Figure 4-1, to define the names and characteristics of variables. This is where you always start if you plan on entering data into SPSS. As you can see in Figure 4-1, every characteristic you can define about your variables is named at the top of the window. All you have to do is enter something in each column for each variable.
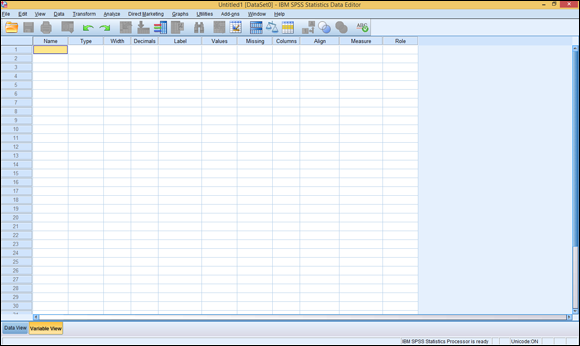
Figure 4-1: You use the Variable View tab to define the characteristics of variables.
 The predefined set of 11 characteristics are the only ones needed to completely specify all the attributes of any variable. The characteristics are all known to the internal SPSS processing. When you add a new variable, you’ll find that reasonable defaults appear for most characteristics.
 The Variable View tab is just for defining the variables. The entry of the actual numbers comes later (see “Entering and Viewing Data Items on the Data View Tab,” later in this chapter).
Each variable characteristic has a default, so if you don’t specify a characteristic, SPSS fills one in for you. However, what it selects may not be what you want, so let’s look at all the possibilities.
Name
The cell on the far left is where you enter the name of the variable. Just click the cell and type a short descriptor, such as age, income, sex, or odor. (A longer descriptor, called a label, comes later.) You can type longer names here, but you should keep them short because they’ll be used in named lists and as identifier tags on the data graphs and such — where the format can be a bit crowded. Names that are too long can cause the output from SPSS to be garbled or truncated.
If the name you assigned turns out to be too long or is misspelled, you can always change it on the Variable View tab. One of the nice things about SPSS is that you can correct mistakes quickly.
 Here are some handy hints about names:
- You can use some bizarre characters in a name, such as @, #, and $, as well as the underscore character (_) and numbers. But if you use screwy characters in a name, you may live to regret it. For one thing, you can’t start a variable name with these characters. Plus, they’ll remind expert users of special variables in some advanced features. An underscore in the middle of a name is a great way to make a name more readable, but otherwise, it’s best to keep your names simple.
- Be sure to start every name with an uppercase or lowercase letter.
- You can’t include blanks anywhere in a name, but an underscore is a good substitute.
If you want to export data to another application, make sure the names you use are in a form acceptable to that application. Watch out for special characters.
Type
Most data you enter will be just regular numbers. Some, however, will be a special type, such as currency, and some will be displayed in a special format. Other data, such as dates, will require special procedures for calculation. You simply specify what type you have, and SPSS takes care of those other details for you. This is a comprehensive look at all the types. (We give you more advice about some special types in Chapter 7.)
Click the cell in the Type column you want to fill in, and a button with three dots appears on its right. Click that button, and the Variable Type dialog box, shown in Figure 4-2, appears.
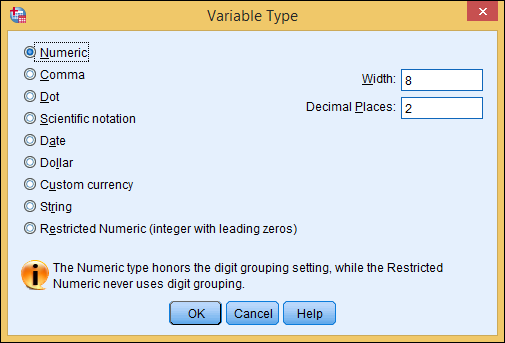
Figure 4-2: The Variable Type dialog box allows you to specify the type of variable you’re defining.
You can choose from the following predefined types of variables:
- Numeric: Standard numbers in any recognizable form. The values are entered and displayed in the standard form, with or without decimal points. Values can be formatted in standard scientific notation, with an embedded E to represent the start of the exponent. The Width value is the total number of all characters in a number — including any positive or negative signs and the exponent indicator. The Decimal Places value specifies the number of digits displayed to the right of the decimal point, not including the exponent.
- Comma: This type specifies numeric values with commas inserted between three-digit groups. The format includes a period as a decimal point. The Width value is the total width of the number, including all commas and the decimal point. The Decimal Places value specifies the number of digits to the right of the decimal point. You may enter data without the commas, but SPSS will insert them when it displays the value. Commas are never placed to the right of the decimal point.
- Dot: Same as Comma, except a period is used to group the digits into threes, and a comma is used for the decimal point.
- Scientific Notation: A numeric variable that always includes the E to designate the power-of-ten exponent. The base (the part of the number to the left of the E) may or may not contain a decimal point. The exponent (the part of the number to the right of the E, which also may or may not contain a decimal) indicates how many times 10 multiplies itself, after which it’s multiplied by the base to produce the actual number. You may enter D or E to mark the exponent, but SPSS always displays the number using E. For example, the number 5,286 can be written as 5.286E3. To represent a small number, the exponent can be negative. For example, the number 0.0005 can be written as 5E–4. This format is useful for very large or very small numbers.
- Date: A variable that can include the year, month, day, hour, minute, and second. When you select Date, the available format choices appear in a list on the right side of the dialog box, as shown in Figure 4-3. Choose the format that best fits your data. Your selection determines how SPSS will format the contents of the variable for display. This format also determines, to some extent, the form in which you enter the data. You can enter the data using slashes, colons, spaces, or other characters. The rules are loose — if SPSS doesn’t understand what you enter, it tells you, and you can re-enter it another way. For example, if you select a format with a two-digit year, SPSS accepts and displays the year that way, but it will use four digits to perform calculations. The first two digits (the number of the century) will be selected according to the configuration you set by choosing Edit ⇒ Options and then clicking the Data tab.
- Dollar: When you select Dollar, the available format choices appear in a list on the right side of the dialog box (see Figure 4-4). Dollar values are always displayed with a leading dollar sign and a period for a decimal point; for large values, they include commas to collect the digits in groups of threes. You select the format and its Width and Decimal Places values. The format choices are similar, but it’s important that you choose one that’s compatible with your other dollar-variable definitions so they line up when you print and display monetary values in output tables. The Width and Decimal Places settings help with vertical alignment in the output, no matter how many digits you include in the format itself. No matter what format you choose, you can enter the values without the dollar sign and the commas; SPSS inserts those for you.
- Custom Currency: The five custom formats for currency are named CCA, CCB, CCC, CCD, and CCE, as shown in Figure 4-5. You can view and modify the details of these formats by choosing Edit ⇒ Options and then clicking the Currency tab. Fortunately, you can modify the definitions of these custom formats as often as you like without fear of damaging your data. As with the Dollar format, the Width and Decimal Places settings are primarily for aligning the data when you’re printing a report.
-
String: A freeform non-numeric item (see Figure 4-6). The only good time to use string is when it truly is a string, like an address, a proper name, or a product code (SKU). Avoid using the String type when it really should be labeled Numeric. Something like favorite color, sex, or state should not be a string because it has a finite list of possibilities that are known in advance. (See the “Values” section later in this chapter.)
SPSS allows a very large number for the size of the string — so large that you could fit a paragraph, which is exactly what you would do if you were doing text mining. Open-ended response items in a survey would also be an example of a string.
- Restricted Numeric: A relatively new choice, so you may not see it mentioned in older books about SPSS. This is perfect for numbers that sometimes have leading zeros like zip codes and Social Security numbers. They aren’t really numbers because you don’t perform arithmetic on them. Back in the day, these types of numbers had to be declared as strings.
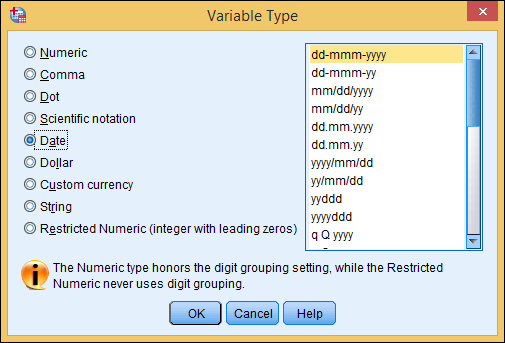
Figure 4-3: Selecting a date format also selects which items are included.
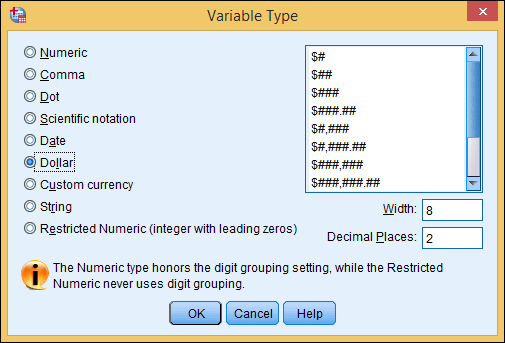
Figure 4-4: The different dollar formats mostly specify the number of digits to be included.
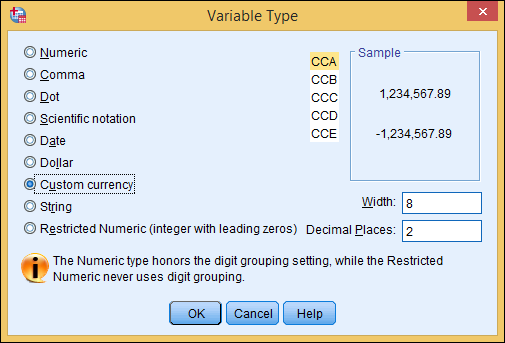
Figure 4-5: Five custom currency formats are available.
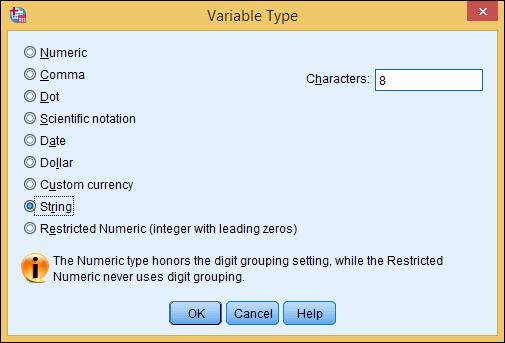
Figure 4-6: Strings are text like addresses, names, and open-ended responses.
Width
The width setting in the definition of a variable determines the number of characters used to display the value. If the value to be displayed is not large enough to fill the space, the output will be padded with blanks. If it’s larger than you specify, it will either be reformatted to fit or asterisks will be displayed.
Certain type definitions allow you to set a width value. The width value you enter as the width definition is the same as the one you enter when you define the type. If you make a change to the value in one place, SPSS changes the value in the other place automatically. The two values are the same.
At this point, you can do one of three things:
- Skip this cell and accept the default (or the number you entered previously under Type).
- Enter a number and move on.
- Use the up and down arrows that appear in the cell to select a numeric value.
Decimals
The number of decimals is the number of digits that appear to the right of the decimal point when the value appears onscreen. This is the same number that you may have specified as the Decimal Places value when you defined the variable type. If you entered a number there, it appears here as the default. If you enter a number here, it changes the one you entered for the type. They’re the same.
Now you can do one of three things:
- Skip this cell and accept the default (or the number you entered earlier under Type).
- Enter a number and move on.
- Use the up and down arrows that appear in the cell to select a numeric value.
Label
The name and the label serve the same basic purpose: They’re descriptors that identify the variable. The difference is that the name is the short identifier and the label is the long one. You need one of each because some output formats work fine with a long identifier and other formats need the short form.
You can use just about anything for the label. What you choose has to do with how you expect to use your data and what you want your output to look like. For example, the variable name may be “Sex” and the longer label may be “Boys and Girls,” “Men and Women,” or simply “Gender.”
The length of the label isn’t determined by some sort of software requirement. However, output looks better if you use short names and somewhat longer labels. Each one should make sense standing alone. After you produce some output, you may find that your label is lousy for your purposes. That’s okay; it’s easy to change. Just pop back to the Variable View tab and make the change. The next time you produce output, the new label will be used.
You can also just skip defining a label. If you don’t have a label defined for a variable, SPSS will use the name you defined for everything.
Values
The Values column is where you assign labels to all the possible values of a variable. If you select a cell in the Values column, a button with three dots appears. Clicking that button displays the dialog box shown in Figure 4-7.
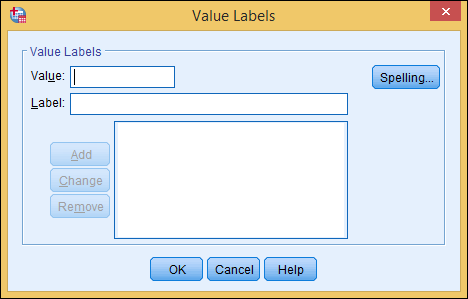
Figure 4-7: You can assign a name to each possible value of a variable.
Normally, you make one entry for each possible value that a variable can assume. For example, for a variable named Sex you could have the value 1 assigned the label “Male” and 2 assigned the label “Female.” Or, for a variable named Committed you could have 0 for “No,” 1 for “Yes,” and 2 for “Undecided.” If you have labels defined, when SPSS displays output, it can show the labels instead of the values.
To define a label for a value:
- In the Value box, enter the value.
- In the Label box, enter a label.
-
Click the Add button.
The value and label appear in the large text block.
- To change or remove a definition, simply select it in the text block and make your changes; then click the Change button.
- Repeat Steps 1–4 as needed.
- Click OK to save the value labels and close the dialog box.
You can always come back and change the definitions using the same process you used to enter them. The dialog box will reappear, filled in with all the definitions; then you can update the list.
Sometimes you have a whole bunch of strings and you really don’t want to make them all values because it seems like it’ll be a lot of work. A variable like college major is a good example. If you dread setting up 1 as “Astrophysics,” 2 as “Biology,” 3 as “Chemistry,” and so on, you can use a special dialog box called Automatic Recode (under the Transform menu) and it’ll do all the work for you.
Missing
You can specify what is to be entered for a value that is missing for a variable in a case. In other words, when you have values for all variables in a case except one, you can specify a placeholder for the missing value. Select a cell in the Missing column. Click the button with three dots and the Missing Values dialog box, shown in Figure 4-8, appears.
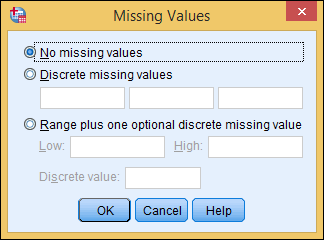
Figure 4-8: You can specify exactly what is entered for a missing value.
For example, say you’re entering responses to questions, and one of the questions is, “How many cars do you own?” The normal answer to this question is a number, so you define the variable type as a number. If someone chooses to ignore this question, this variable won’t have a value. However, you can specify a placeholder value. Perhaps 0 seems like a good choice for a placeholder here, but it’s not really — lots of people don’t have cars. Instead, a less likely value — like, say, –1 — makes a better choice. A very popular choice among SPSS users is –9, but this will depend on the values of the original variable.
You can even specify unique values to represent different reasons for a value being missing. In the previous example, you could define –1 as the value entered when the answer is, “I don’t remember,” and –2 could be used when the answer is, “None of your business.” If you specify that a value is representing a missing value, that value is not included in general calculations. During your analysis, however, you can determine how many values are missing for each of the different reasons. You can specify up to three specific values (called discrete values) to represent missing data, or you can specify a range of numbers along with one discrete value, all to be considered missing. The only reason you would need to specify a range of values is if you have lots of reasons why data is missing and want to track them all.
One of the many reasons you don’t want to abuse the string type is that it makes a mess of missing data or incorrect data. If Female and Male are strings, you can get entries like “m,” “M,” “Male,” and even crazy unexpected ones like “H” and “mail.” You’re better off doing what all experienced users do: Use numeric codes with values!
Columns
The Columns column is where you specify the width of the column you’ll use to enter the data. The folks at SPSS could have used the word Width to describe it, but they already used that term for the width of the data itself. A better name may have been the two words Column Width, but that would have been too long to display nicely in this window, so they just called it Columns. To specify the number of columns, select a cell and enter the number.
Align
The Align column determines the position of the data in its allocated space, whenever the data is displayed for input or output. The data can be left-aligned, right-aligned, or centered. You’ve defined the width of the data and the size of the column in which the data will be displayed; the alignment determines what is done with any space left over.
When you select a cell in the Align column, a list appears and you can choose one of the three alignment possibilities, as shown in Figure 4-9. Aligning to the left means inserting all blanks on the right; aligning to the right inserts all the extra spaces on the left; centering the data splits the spaces evenly on each side — we don’t know what it does if an odd space is left over. (We also worry about things like the number of seeds in a tomato and where the clouds go at night.)
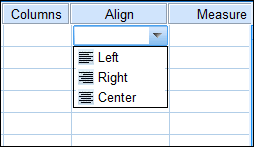
Figure 4-9: Values can be justified right or left, or positioned in the center.
Measure
Your value here specifies the measure of something in one of three ways. When you click a cell in the Measure column, you can select one of these choices (see Figure 4-10):
- Ordinal: These numbers specify the position (order) of something in a list. For example, first, second, and third are ordinal numbers.
- Nominal: Numbers that specify categories or types of things. You can have 0 represent “Disapprove” and 1 represent “Approve.” Or you can use 1 to mean “Fast” and 2 to mean “Slow.”
- Scale: A number that specifies a magnitude. It can be distance, weight, age, or a count of something.
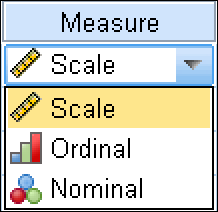
Figure 4-10: The type of measurement being made by the values in this variable.
Role
Some of the SPSS dialog boxes select variables according to their role and include them as defaults. You don’t need to worry about this characteristic. It can be handy when you have some experience with SPSS and understand how defaults are chosen.
 Be on the lookout for Analyze menus that let you use predefined roles. They use this feature. There aren’t that many of them, but the number grows with each new version of SPSS.
These predefined roles allow greater capability with SPSS Modeler, which is a kind of sibling product to SPSS Statistics.
When you click a cell in the Role column, you can select one of six choices (see Figure 4-11):
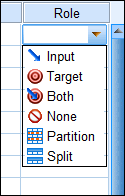
Figure 4-11: The role assumed by this variable in certain SPSS dialog boxes.
- Input: This variable is used for input. This is the default role. Definition of roles was introduced to Version 18 of SPSS, and all data imported from earlier versions will be assigned this role.
- Target: This variable is used as output by SPSS procedures.
- Both: This variable is used as both input and output.
- None: This variable has no role assignment.
- Partition: This variable is used to partition the data into separate samples for training, testing, and validation.
- Split: This variable is used to build separate models for each possible value of the variable. This capability should not be confused with file splitting (see Chapter 8).
Entering and Viewing Data Items on the Data View Tab
After you’ve defined all the variables for each case, click the Data View tab of the Data Editor window so you can begin typing the data. At the top of the columns in Figure 4-12, you can see some names we chose for variables. Switching to the Data View tab makes the window ready to receive entered data — and to verify that what’s entered matches the specified format and type of the data.
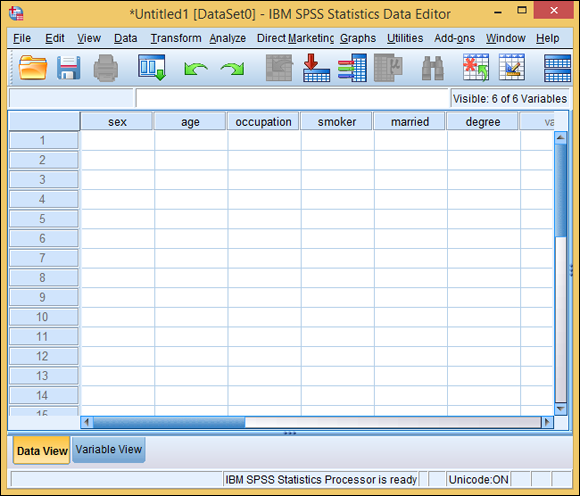
Figure 4-12: The Data View tab, ready to accept new data.
Entering data into one of these cells is straightforward: You simply click the cell and start typing.
If something is already in a cell and you want to change it instead of just typing over it, look up toward the top of the window, just underneath the toolbar: You’ll see the name of the variable and the currently selected value. Click the value in the field at the top, and you can edit it right there. You can do all the normal mouse and keyboard stuff there, too — you can use the Backspace key to erase characters, or select the entire value and type right over it.
If you feel like a lousy (or inexperienced) mouse driver, take some time to experiment and figure out how to edit data. Lots of software use these same editing techniques, so becoming proficient now will pay you dividends later.
If your data is already in a file, you may be able to avoid typing it in again by reading that file directly into SPSS. For more information, see Chapter 5.
Don’t take chances. As soon as you type a few values, save your data to a file by choosing File ⇒ Save As. Then choose File ⇒ Save throughout the process of entering data, and you won’t be ruined if the computer crashes unexpectedly.
We all have to go back and refine our variable definitions from time to time. That’s normal. When you come across something that doesn’t do what you want it to, just switch back to the Variable View tab and correct it. Nobody but you and SPSS will ever know about it, and SPSS never talks.
Filling In Missed Categorical Values
Now that you’ve defined your variables and entered your data, you may want to check that you have names defined for all your actual ordinal and nominal values, and that you have defined the correct measures for them. SPSS can help by scanning your data, finding values for which you don’t have definitions, and pointing them out in a friendly way.
The following steps use an existing file to walk through a demonstration:
-
Choose File ⇒ Open ⇒ Data to load the file named car_sales.sav.
This file came with your installation of SPSS and is found, along with a number of other files, in the same directory in which you installed SPSS. You can load any of these data files, but car_sales.sav is the one used in this demonstration. If you load this file while you already have some other data showing in the window, SPSS will open a new Data Editor window to display the new information; your existing data will not be lost.
When you open this data file — or any data file, for that matter — SPSS opens the SPSS Statistics Viewer window to tell you that it has opened a file (or the information could be displayed in the SPSS Statistics Viewer window that’s already open). You won’t need this information for what you’re doing here, so you can just close the window.
-
Choose Data ⇒ Define Variable Properties.
The Define Variable Properties dialog box appears.
- On the left, select all the names of the variables you want to check, and then click the arrow in the center of the dialog box to move them to the right, as shown in Figure 4-13.
- When you’re done, click Continue.
-
Select one of the variable names in the list on the left.
Its different values appear in the center of the dialog box, as shown in Figure 4-14. (In this example, every value has a name assigned to it.)
-
Ask SPSS to suggest a new type for this variable by clicking the Suggest button in the top center of the dialog box.
The dialog box in Figure 4-15 appears, telling you what SPSS concludes about this variable and its values. This same window, with different text, appears for each variable you test. Sometimes the text suggests changes in the variable definition, and sometimes it doesn’t.
-
To apply any changes, click Continue.
You return to the window shown in Figure 4-14, where you can select another variable.
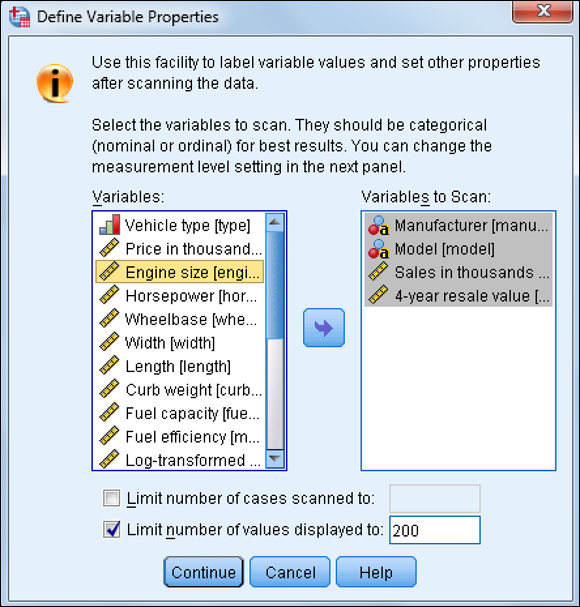
Figure 4-13: Selecting variables to check their properties.
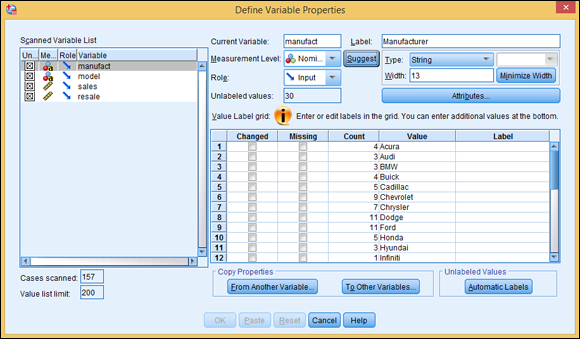
Figure 4-14: The values of the selected variable.
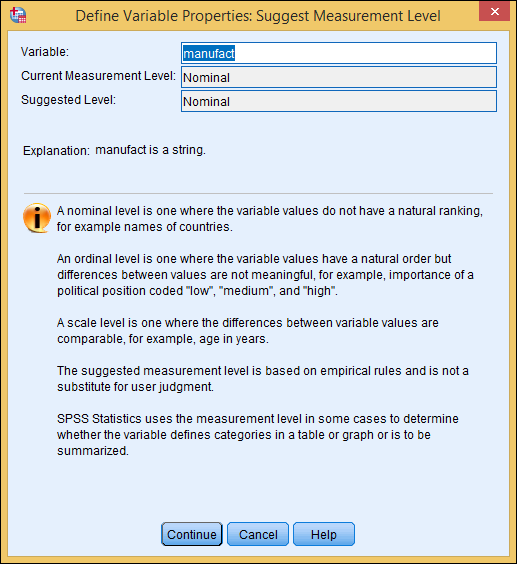
Figure 4-15: From the pattern of values, SPSS concludes whether you may have chosen the wrong measurement.
You won’t want to make changes to all your variables, but SPSS helps you find the ones that you do need to change. Values defined as “missing” are not included in the computations. The text in the window always explains the criteria used to reach a conclusion, and SPSS allows you to make the final decision.