
3
5G and Cellular Networks in the Smart Grid
Jimmy Jessen Nielsen1, Ljupco Jorguseski2, Haibin Zhang2, Hervé Ganem3, Ziming Zhu4 and Petar Popovski1
1 Aalborg University, Aalborg, Denmark
2 TNO, The Hague, The Netherlands
3 Gemalto, Paris, France
4 Toshiba Research Europe ltd., Bristol, United Kingdom
3.1 Introduction
The increasing penetration of Distributed Energy Resources (DERs) such as electric vehicles, photovoltaics, and wind turbines in the distribution grid introduces bidirectional power flows and makes the consumption patterns of customers less predictable than it has been previously. As a result, it becomes necessary for the Distribution System Operator (DSO) to achieve observability below substation level, to make stable operation of the grid possible. This observability can be achieved through real‐time monitoring of the distribution grid facilitated by communication technologies, thereby making the power grid into a smart grid. A real‐time monitoring platform using the cellular network is introduced in Nielsen (2017). The platform relies on the deployment of more advanced phasor measurement devices in the mid/low voltage grid, as well as a secure data exchange through public communication network. The type of traffic that does not originate from a human request, such as in the smart grid, is commonly referred to as machine‐type communication (MTC) or machine‐to‐machine (M2M) communications. A reliable M2M communication is important in order to ensure the integration of machine‐type data traffic with the existing communication systems. The reader is referred to Erol‐Kantarci (2013) for a comprehensive study of the M2M technologies and standards.
Due to their ability to provide wireless network coverage to large geographical areas, cellular networks are promising candidates to enable MTC in the smart grid. The development of previous generations of cellular networks, from GPRS (2.5G) through LTE (4G), has been mostly concerned with increasing the data rates to support human‐oriented services, such as multimedia content on smart phones and mobile devices. The upcoming 5G networks are focused both on higher data rates and efficient support of machine‐type communication (MTC), thereby becoming relevant for various smart city applications. Additionally, a number of Internet of Things (IoT) communication protocols are emerging that are expected to be able to support a subset of MTC applications. Typically, two vastly different types of MTC are considered, namely massive MTC and mission‐critical MTC, where the latter requires ultra‐reliable and often ultra‐low‐latency connections.
3.3.1 Massive MTC
The massive MTC covers the types of applications that require exchanges with a very large number of devices. Real‐time, reliability, and data rate requirements are typically not very high, which means that the challenge in supporting such applications lies in the ability of the network to efficiently manage the access of a vast number of devices. This is poorly addressed by the traditional cellular technologies, since the establishment and maintenance of individual devices' connections has a large overhead compared to the typical small payloads of many MTC applications. Consequently, the resources required for control traffic will for some applications and scenarios grow significantly, thereby turning the control channels into bottlenecks. This is contrary to the typical case in current cellular networks, where usually the bandwidth allocated for data is the limiting factor. Within the smart grid, this type of applications covers, for example, power quality and consumption reporting, where a large number of smart meters transmit status messages periodically in order to facilitate optimal power grid operation.
In the current and upcoming 3GPP specifications, there are several initiatives aiming to extend LTE toward a better support of massive MTC applications, for example through the definition of device categories with lower capability and lighter access modes, where the amount of control signaling is reduced. Besides the 3GPP cellular technologies, there are several other emerging network technologies that are directly targeting the support of a large number of low capability devices. For example, from the IEEE 802.11 family of protocols comes the 802.11ah standard, which operates in sub‐GHz ISM bands and supports a large number of devices. Operating in the same sub‐GHz ISM bands are the IoT protocols Sigfox and LoRa, which are especially targeting low‐throughput networks.
3.2.1 Mission‐Critical MTC
A key example of mission‐critical MTC in the context of a smart city is related to the smart power grid. One of the strictest requirements is posed by wirelessly connected grid protection relays. Here it is required that the trigger signal arrives at the protective relay within milliseconds and with very high probability, in order to protect the grid in case of, e.g., damage to overhead power lines. That is, the required levels of reliability for mission‐critical MTC applications may easily exceed “five nines” (99.999%), which is far beyond what current cellular networks typically deliver. Considering 5G in a narrow sense, i.e., as the next generation of cellular networks after 4G, it will certainly feature a new radio interface specification, not present in 4G, optimized in terms of reliability and low latency (Boccardi, 2014). However, for mission‐critical applications with strict latency and reliability requirements, it will be necessary to take advantage of the added redundancy that multiple communication technologies can offer when used simultaneously (Nielsen, 2016). An example of a less strict application is that of real‐time monitoring and control, where detailed power measurements are collected periodically from strategic locations in the grid to provide a complete system view. Depending on the type of power network, the update interval is in the order of a few ms up to 1 or more seconds. In this chapter, we will study specifically this use case.
3.1.3 Secure Mission‐Critical MTC
Another aspect of mission‐critical MTC is that of secure communication. While, from a communications perspective, the reliability is typically defined as the ability to deliver a data packet within a specified deadline, it is implicitly expected that the data packet has not been tampered with along the way. A security architecture is therefore a big part of the mission‐critical MTC, and it is often made of onion‐like layers, where a security layer is protecting a specific type of access to communication. This layered model results from the distributed responsibility for credential management. In this chapter, we will describe the different types of layer and associated protection, and pitch on the responsibility and liability associated to credential management. For mission‐critical MTC, it is necessary to ensure end‐to‐end security. We will discuss the implications and potential challenges of implementing end‐to‐end security from the device end point to the application in the cloud. A key aspect of a security architecture is access control and credentials management, and it is challenging to design a solution that scales well, especially for large systems, such as the smart city. We will address these challenges and end up with the notion of role‐based access control.
The security architecture will be considered for the specific case of 3GPP communications and the possible role of a Mobile Network Operator (MNO) to help secure power grid applications. On the other hand, the use of non‐3GPP communications and non‐IP based communication protocols raise new challenges to secure communication. We will provide an overview of the problems and the possible solutions.
The contents of this chapter are organized as follows. In section 3.2 we elaborate on the motivation for the smart grid and its features. Thereafter, in section 3.3 a traffic model for the smart grid is presented. In the sections 3.4 and 3.5 we describe the non‐3GPP cellular technologies and current and upcoming 3GPP cellular technologies, respectively, that are relevant for supporting smart grid communication. Additionally, we present the challenges and possible solutions for ensuring end‐to‐end security in smart grid systems in section 3.6. Finally, the chapter is summarized in section 3.7.
3.2 From Power Grid to Smart Grid
The existing power generation and delivery system is based on many‐decades‐old vertical broadcast infrastructure (i.e., few‐to‐many distribution), where a few central power plants provide all the electricity production in a country or region and dispatch this electricity to consumers via a large network of cables and transformers. The electric power flows in one direction from the power generators to the consumers, and the monitoring information is handled only at the operation side, as illustrated in Figure 3.1. Based on load forecasting models developed over time, the utility providers generally over‐provision for the demand considering peak load conditions. This approach is costly when the average demand is much lower than the peak because electricity, once produced, has to be consumed since energy storage is normally very expensive. Also, given the increasing and dynamic demand for energy, it may be difficult, perhaps impossible, in the longer run, to match the supply to demand at all times (Goel, 2013).
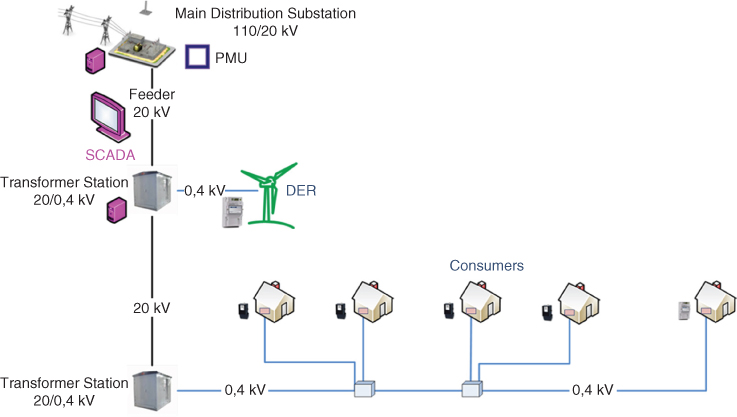
Figure 3.1 Today's power grid where the DSO is operating blindly, i.e., without real‐time feedback of costumers' consumption.
It is attractive in such a situation to apply two‐way communications between the grid and the customers and providing incentives (e.g., through variable pricing) to encourage the consumers to reschedule the consumption so as to improve utilization of the available capacity. This necessitates the flow of metering information from the customer premises to the grid management facilities to analyze the demand and the flow of control information in the opposite direction to encourage the customers to manage their demand. The bidirectional flow of information will provide the utility operators a full visibility and hence more effective control of the grids. In particular, the utility operators and consumers can communicate and cooperate in order to achieve more efficient energy consumption management (Zhu, 2012).
Distributed generation using various renewable energy sources offer a key contribution to the environmental problem. It is expected in the future that energy can be generated, stored, and released back to the grids at distribution level, even by households at the low‐voltage network. However, their integration into existing power grids comes with a whole new set of barriers, such as the intermittency of generation, and importantly, the lack of real‐time monitoring and control capability for such a highly distributed energy system.
In addition, electric vehicles (EVs) are becoming a main component of energy consumption, storage, and supply in the power network. EVs can serve as a distributed and mobile energy source in the electricity market, optimally scheduled and dispatched to meet the dynamic demand of energy and to respond to emergency situations. EVs are a major electricity consumer and draw a significant amount of power in order to retain sufficient battery capacity. For the grid operators, such high loads attached to the grid will have to be managed carefully.
From the DSO's point of view, the introduction of distributed generation makes it more challenging to assure the quality of power delivered to customers, for example, in terms of preventing voltage violations. Since power production may in principle take place anywhere in the grid, it is necessary to obtain detailed real‐time measurements of the grid state in multiple locations to ensure the required power quality and maintain stable grid operation.
In order to realize all the aforementioned features in the future power network, it is believed that a fundamental evolution, generally recognized as the smart grid, is needed. The core of such evolution is the integration of a fast and reliable information and communication technology (ICT) network, in order to provide accurate grid monitoring and interconnection between the power grid and the intelligent information processing systems. Measurements are provided by smart meters and Wide Area Measurement System (WAMS) nodes (Phasor Measurement Unit, PMU‐like devices) that are deployed deep into the distribution grid, as shown in Figure 3.2. The control center is able to detect, analyze, and respond fast to dynamic operational status and emerging problems. It is envisaged that the smart grid communication network will be a heterogeneous system of wired and wireless technologies, including fiber and power line communications, cellular networks, and wireless local area networks.

Figure 3.2 Smart distribution grid with real‐time measurements of consumption and production at prosumer locations.
National governments and various relevant stakeholders have already launched massive investments on smart grid research projects and made significant progress. The US Department of Energy (DoE) states that a smart grid uses digital technology to improve reliability, security, and efficiency of the electricity system (DOE, 2012). Its Smart Grid Research and Development Program has set the following performance targets for 2030: 20% reduction in the nation's peak energy demand; 100% availability to serve all critical loads at all times and a range of reliability services for other loads; 40% improvement in system efficiency and asset utilization to achieve a load factor of 70%; and 20% of electricity capacity from distributed and renewable energy sources (200 GW). Europe presents a highly interconnected and more robust system that can intelligently integrate the behavior and actions of all users to ensure sustainable, economic, and secure electricity supply (EC, 2006).
3.3 Smart Grid Communication Requirements
As discussed in the previous section, the increasing production of energy from renewables at the individual household level, through roof‐mounted solar panels and small wind turbines, forces the DSO to introduce more advanced measurement feedback systems to ensure stable operation of the distribution grid. Traditionally, the DSO was only collecting consumption information from each household a few times per year, through manual reading of the electricity consumption meter. In many places, those manual meters have been replaced by smart meters, which allow the DSO/utility company to automatically collect measurements from all smart meters on a much more regular basis, typically once per night or every few hours (Hossain, 2012). There exist many different communication solutions for smart meters that use, for example, Power Line Communications (PLC), proprietary wireless solutions, or cellular networks; however, the underlying traffic model is the same.
3.3.1 Traffic Models and Requirements
In industry publications, there are many different examples of traffic models and requirement specifications for the smart grid (Hossain, 2012; Deshpande, 2011; Khan, 2013; Lander, 2013). We have found that the most coherent and comprehensive specification is the OpenSG “Smart Grid Networks System Requirements Specification” (described in Hossain, 2012) from the Utilities Communications Architecture (UCA) user group. While this model specifies in great detail the messages that are communicated between different smart grid entities, it is necessary to make assumptions on a specific system deployment before an actual traffic model can be extracted. An example of this is presented in Nielsen (2015), where the assumed system deployment results in the smart meter traffic model in Table 3.1. The table shows the downlink and uplink traffic rates for default reporting intervals as well as for reduced reporting intervals, which would enable DSO/utility companies to monitor certain aspects of the distribution grid state in close to real time.
Table 3.1 Derived Smart Meter Traffic Model.
| Downlink | Uplink | |||||||
| Use case reporting interval | default | default | 5 min | 1 min | 30 sec | 15 sec | ||
| Meter reading | 1.25 | 11K | 95K | 475K | 950K | 1.9M | ||
| Service switch | 3 | 6 | 6 | 6 | 6 | 6 | ||
| Prepay | 3.5 | 8 | 8 | 8 | 8 | 8 | ||
| Meter events | 0 | 50 | 50 | 50 | 50 | 50 | ||
| Islanded distr. cust. storage | 2 | 5 | 5 | 5 | 5 | 5 | ||
| DR‐DLC | 400 | 0.5 | 0.5 | 0.5 | 0.5 | 0.5 | ||
| Premise network admin | 1 | 1 | 1 | 1 | 1 | 1 | ||
| Price | 10K | 2.4K | 2.4K | 2.4K | 2.4K | 2.4K | ||
| Firmware / program update | 30K | 5 | 5 | 5 | 5 | 5 | ||
| Total | 40.4K | 13.4K | 97K | 477K | 952K | 1.9M | ||
At the time of writing, there is no standardized traffic model for describing the reporting behavior of WAMS nodes for the distribution grid. In the transmission grid, PMUs are deployed to obtain synchro‐phasor measurements that facilitate monitoring, control, and protection of the grid (Martin, 2008). PMUs are time synchronized, and measurements are sampled and collected up to 50 or 60 times per second, as described in the PMU standards IEEE 1588 (Lee, 2005) and C37.118 (Martin, 2008). Time synchronization is often achieved through the use of GPS receivers. To support the real‐time collection of PMU measurements in the transmission grid, the PMUs are typically interconnected through a network based on optical fibre links.
For the use of synchro‐phasor measurements in the distribution grid, the real‐time requirements depend on the intended application. For monitoring and control purposes, reporting intervals of 1 to 10 s may well be sufficient, whereas protection functions require much faster reaction times in the order of 50 to 250 ms (Goel, 2013). Since the deployment locations may be in prosumer households or small industrial premises, an optical fiber–based communication infrastructure cannot be assumed. For ease of deployment and to ensure reconfigurability of additional distributed generators added to the distribution grid, wireless connectivity is the most obvious choice.
Within the European project SUNSEED1, a low‐cost distribution grid PMU has been developed and deployed in a large‐scale field trial. An example of a traffic model for distribution grid WAMS nodes has been derived from network traces. Each synchro‐phasor measurement is approximately 405 bytes, since it is encoded with the human‐readable data format JSON. Including TCP and IP headers and assuming that each measurement is sent in a separate data packet, the size of the transmitted packet amounts to 470–480 bytes. The resulting goodput and throughput (including overhead) is listed in Table 3.2.
Table 3.2 Derived Traffic Model of Distribution Grid WAMS Node from SUNSEED Field Trial.
| 1 Hz | 5 Hz | 10 Hz | 25 Hz | 50 Hz | |
| Goodput (Kbps) | 3.2 | 16 | 32 | 81 | 162 |
| Throughput (Kbps) | 3.8 | 19 | 38 | 95 | 190 |
From a throughput perspective, the requirements are quite modest in comparison to other current streaming applications such as video streaming, where several Mbit/s are easily consumed. The key difference is in the real‐time requirements. The WAMS synchro‐phasor measurements should be delivered within a fraction of a second with a very high reliability, whereas video streaming typically relies on buffering several seconds of data to smoothen out the impact of jitter.
An example of a foreseen highly mission‐critical MTC application in the smart grid is that of wirelessly connected grid protection relays (METIS, 2013). Here it is required that the trigger signal arrives at the protective relay within milliseconds and with very high reliability (>99.999%), in order to protect the grid in case of, for example, damage to overhead power lines. This is far beyond what current cellular networks typically deliver, even though the message to deliver is very small.
In the following sections, the most promising wireless cellular communication technologies are described and analyzed with respect to their suitability of supporting the smart grid. Initially we consider technologies that operate in the unlicensed spectrum, and hereafter we consider 3GPP technologies.
3.4 Unlicensed Spectrum and Non‐3GPP Technologies for the Support of Smart Grid
The main non‐3GPP wireless technologies gaining momentum in Europe and North America are IEEE 802.11ah (Adame, 2014), Sigfox (SIGFOX, n.d.), and LoRa™ (LoRa Alliance, n.d.). These technologies are explained in Section 3.4.1, Section 3.4.2, and Section 3.4.3, respectively.
The Sigfox and LoRa™ systems are also the basis for the so‐called low‐throughput network (LTN) standardization in ETSI (ETSI, LTN FA, 2014; ETSI, LTN P&I, 2014). The main characteristic of these LTN networks is support for low data rates (e.g., up to 50 Kbps for LoRa™) as they are targeting IoT applications that very occasionally transmit very limited amount of data (e.g., some sensor value or alarm/event). Unlike IEEE 802.11ah, the Sigfox and LoRA™ systems are designed for long‐range communication links even though they are using limited transmission power (e.g., few tens or hundreds mW). The limited transmission power is constrained by the utilization of industrial, scientific, and medical (ISM) bands, e.g., around 868 MHz in Europe and around 915 MHz in the USA. To increase uplink reception quality in case of unsynchronized uplink transmissions, Sigfox and LoRa™ systems receive the uplink signals via multiple access points (if in range), i.e., the so‐called cooperative reception (ETSI, LTN FA, 2014).
3.4.1 IEEE 802.11ah
The IEEE 802.11 wireless local area network (WLAN) standards, generally recognized as the Wi‐Fi technologies, have significant advantages in terms of low cost and ease of deployment. However, for MTC traffic, the main limitation of current 802.11 WLAN is the coverage, power consumption, and the limited capacity in terms of number of stations. This is because of the high operating frequency (2.4 GHz and 5 GHz) and the current contention‐based medium access control protocols do not work well in large networks. Recent development in the IEEE 802.11 has been focused on the enhanced capability in massive and dense scenarios. In particular, the task group TGah proposes to use a group‐based contention scheme in the Media Access Control (MAC) of its proposed amendment 11ah in order to cope with massive power constrained MTC stations (STAs) per access point (AP; IEEE, 2016).
The physical (PHY) layer of IEEE 802.11ah is MIMO OFDM‐based transmission operating using sub‐1 GHz license‐free bands. Some examples of the bands include 863–868 MHz in Europe, 950–958 MHz in Japan, and 902–928 MHz in the US. Owing to the superior propagation feature of lower frequency, the 802.11ah provides longer transmission range, with 6 dB higher link margin compared to that at 2.4 GHz. Channel bandwidths of 1 MHz and 2 MHz are expected to be adopted in Europe, although configurations using 4, 8, and 16 MHz are also allowed in the US. For transmission modes that use at least 2 MHz, the PHY layer is designed based on 10 times down‐clocking of 802.11ac's PHY layer, which operates in 20, 40, 80, and 160 MHz channels with 32 or 64 OFDM subcarriers. The 1 MHz channel is used in order to extend the coverage; however the number of data subcarriers per OFDM symbol is reduced to 24. The IEEE 802.11ah supports a small PHY packet length of 256 bytes, which is typical for MTC.
The MAC layer is designed to maximize the number of stations supported while endeavoring to maintain minimum energy consumption. A group‐synchronized distributed coordination function is featured in the MAC of the proposed amendment. The idea of grouping network nodes has been widely explored, for example, the clustering strategies in wireless sensor networks and ad hoc networks. It increases energy efficiency, decreases management complexity, and optimizes other network performance metrics. In the proposed 11ah standard, a 13‐bit Association IDentifier (AID) is used to label more than 8000 STAs for one AP. The AID classifies stations into 4 pages, each containing 32 blocks. There are further 8 sub‐blocks in each block, and up to 8 stations in each sub‐block. The structure of the AID is depicted in Figure 3.3. The AIDs are allocated to the STAs according to a grouping mechanism. In addition, three categories of STA are defined. The TIM stations need to listen to the AP's beacon to send or receive data. They are active in the scheduled Restricted Access Windows (RAW). TIMs can be allocated with different RAWs. Only the STAs within the same group will be contending for transmission with each other at once. The non‐TIM stations negotiate with the AP to access the channel at the Periodic Restricted Access Window (PRAW) defined in every TIM period. The unscheduled stations are allowed to access the channel in the Any Access window in the TIM period. STAs that are not in permitted RAW can switch to sleep mode and save power. Under such mechanism, collisions and delays caused by the contention‐based MAC process can be reduced significantly in a dense network scenario. The detailed STA regrouping technique is described as implementation specific.

Figure 3.3 AID structure proposed in the IEEE 802.11ah.
The unexpected transmission from the so‐called hidden nodes has significant impact on the performance of the IEEE 802.11 WLAN, especially in large cells. It occurs when a STA is visible from the AP but is outside the sensitivity range of certain STA communicating with that AP. It is another major cause of collision for the CSMA/CA‐based media access control protocols. The potential hidden node problem can be managed by using the grouping of STAs.
A novel STA regrouping method is proposed in SUNSEED (2016) consisting of a signaling process and a regrouping algorithm. The aim of the regrouping is to minimize the potential transmission collisions caused by the hidden node problem through identifying all potential hidden node pairs and allocate them into different contention groups. Firstly, the AP acquires global knowledge of potential hidden node pairs of the STAs in the network via a signaling technique. Figure 3.4 depicts the time slot allocation in the IEEE 802.11ah MAC protocol. The information collection will happen in the multicast, downlink (DL) and uplink (UL) slots in every TIM. The AP conducts a roll call for all the connected STAs. The STAs respond to the AP with ACK in order, i.e., predefined time slots, and the other STAs listen to the channel. If STA_i cannot hear the transmission from STA_j in the corresponding time slot, then it will record STA_j as a hidden node. The STAs report the listening results to the AP in the UL slots. The AP is then able to create a table of the potential hidden nodes for the network and keeps updating the table until no report is collected. In addition to the hidden node information, the AP will consider the active level of each STA based on its type. For example, in smart grids, a WAMS device can have 100 times more measurements and reporting than a smart meter. Such active levels are integrated to form a comprehensive knowledge of potential impact of hidden nodes. The AP then regroups the hidden STAs into different contention groups according to a Viterbi‐like algorithm, in order to minimize the potential collisions in the whole network. In a case study considering a distribution grid monitoring scenario, a 50% reduction of collision was achieved using regrouping, compared with random grouping methods (SUNSEED, 2016).
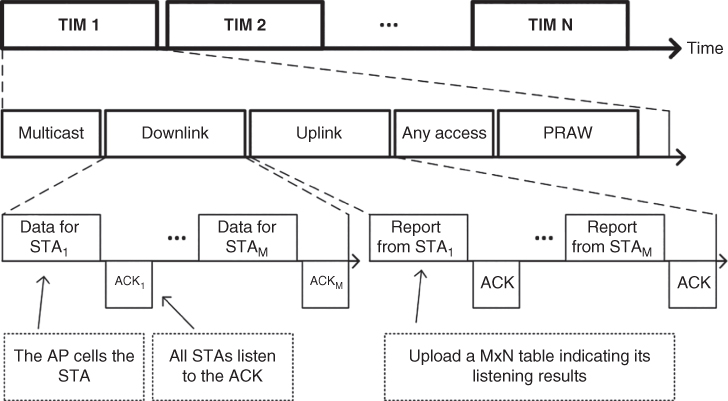
Figure 3.4 Collecting hidden node information using the IEEE 802.11ah MAC.
Finally, the IEEE 802.11ah proposes the use of 18‐byte MAC layer frame header, instead of 28 bytes in current standards in order to improve the frame utilization efficiency, as the data payload in MTC is often very small. The standard also incorporates bidirectional transmit opportunity (TXOP) and target wake times, which makes it suitable for smart grid applications.
3.4.2 Sigfox's Ultra‐Narrow Band (UNB) Approach
The Sigfox radio access link is based on UNB transmissions with, e.g., a channelization mask of 100 Hz in Europe (or 600 Hz in USA). Since the Sigfox technology uses the ISM band, its transmission power is limited to, e.g., 25 mW in uplink and 500 mW in downlink for Europe. The UNB transmission is a suitable technique due to the low noise contribution resulting in low receive sensitivity levels (typically around −140 dBm) for successful reception at low bit rates. The typical link budget is around 160 dB, which can result in rather large cells. In order to have simpler end devices, reduce the system overhead, and consequently, the battery usage, the end devices are not trained by pilot and synchronization signals. The Sigfox version called Cooperative Ultra Narrow Band (C‐UNB) was one alternative for clean slate solutions investigated in 3GPP (3GPP, TR45.820) but not selected for standardization in 3GPP Release 13. Note here that due to regulatory aspects for the unlicensed spectrum usage (e.g., maximum transmission duty cycle) the commercial Sigfox systems are limited by the maximum (e.g., 140) number of transmitted messages per day. Consequently, smart grid applications where frequent data messaging is required might not be supported by these systems, even more so if the messages are not small.
On the security aspect, Sigfox messages (up‐ or downlink) are authenticated both ways, and each message carries a unique ID. Messages sent by Sigfox devices are signed using a key stored in the device. Messages received by the base stations are first forwarded to the Sigfox cloud using a VPN connection to be transmitted from there to application servers via the https protocol. Data ciphering, when used, must be performed at the application level, and the application deployment team is responsible for the distribution of the ciphering/deciphering keys.
The commercial deployment of Sigfox networks is currently ongoing worldwide. This is arranged via Sigfox partnering companies and according to the reports available on the Internet2, there are already some European countries with nation‐wide coverage (e.g., Ireland, France, Belgium, and Netherlands).
3.4.3 LoRa™ Chirp Spread Spectrum Approach
The LoRa™ system is based on so‐called chirp spread spectrum transmission, where the chirp signal continuously varies in frequency with configurable modulation bandwidth between 8 kHz and 500 kHz. The spreading factor can be from 128 (27) to 4096 (212) and together with the modulation bandwidth has to be configured as a trade‐off between the desired data rate, transmission range, and power usage (i.e., time on air). Depending on the particular LoRa™ product, the receiver sensitivity is around −140 dBm, which for 20 dBm output power results in a typical link budget of 160 dB. This enables long communication ranges similar to Sigfox systems. The supported data‐rates are between 0.3 Kbps and 50 Kbps. The LoRa™ systems define different end devices to suit different needs of uplink versus downlink transmission and battery power classes (LoRa Alliance, n.d.).
The wide area network built from end nodes (e.g. sensors) communicate wirelessly with LoRa™ gateway nodes (i.e., similar as cellular base stations or Wi‐Fi access points) that are further connected via a backhaul system with a network server labelled as LoRaWAN. This star architecture for the LoRaWAN is similar as the architecture of the Wi‐Fi networks and also comparable with the cellular networks, although without the support for real mobility of the end nodes (i.e., no handover support but nomadic mobility support).
At this moment, the networks deployed based on the LoRa™ technology are providing traditional IoT services that require small data transfer, no stringent delay requirements, and long battery life. Examples include asset tracking, smart meters' support for electricity grids, transport and logistics services, and smart cities (smart street lightning, building management, air quality monitoring, leakage in water distribution systems, etc.). Typically, cellular operators reuse their sites for installing additional LoRa™ gateways and providing transfer of data to a third party via LoRa™ sensors.
The security mechanisms of LoRa are specified in the LoRaWAN networking stack and are at this point relatively basic and likely to evolve in future specifications of the LoRaWAN stack. They address communications occurring between a LoRa device and a LoRa network server via a LoRa gateway.
The security bootstrap of a Lora device using the LoraWAN stack is summarized in Figure 3.5.

Figure 3.5 Security bootstrap of Lora device (LoraWAN).
As a first step before the deployment, LoRa devices are configured. The configuration includes a device unique ID (DevEUI), an application unique key (AppEUI), and an application‐specific key (AppKey).
The parameters DevEUI, AppEUI, and AppKey are also preloaded in the LoRa network server. When the LoRa device is being deployed and attempts to join a LoRa network, it sends an initial join request including a device‐generated random number, the unique device ID and the unique application ID. Upon reception of this request, the Lora network server computes two session keys derived from AppKey: a network session key, NwkSKey, and an application session key, AppSKey. The Lora device performs independently the same computations. Then all application data sent to the LoRa server will be ciphered using the application session keys and include a message identification code computed with the network session keys. All MAC messages will be themselves ciphered with the network session key.
In this context, the party operating the network server should also be the one operating the LoRa application, but this assumption is not very realistic. A real‐life situation is the one in which the LoRa network server is operated by one party (a communication service provider such as a cellular operator) and the application operated by another party (the application provider). Therefore, there is a need to separate the credentials so that the AppSKey used to secure application end to end is not known to the communication service provider. Such a need may be answered using the architecture shown on Figure 3.6, also based on the LoraWAN stack, and where a separate key management server is used to manage the credentials. According to this figure, the security bootstrap of a Lora device will involve the following steps. In the first step and before the device deployment, the devices are preconfigured. This step may occur when the LoRa device is manufactured. The configuration includes a device unique ID (DevEUI), an application unique key (AppEUI), and an application‐specific key (AppKey). The parameters DevEUI, AppEUI, and AppKey are also preloaded in the LoRa key management server. When the LoRa device is being deployed and attempts to join a LoRa network, it sends an initial join request including a device‐generated nonce, the unique device ID, and the unique application ID. Upon reception of this request, the LoRa network server forwards the request to the LoRa key management server. Using the nonce, DevEUI, APPEUI, and AppKey, the key management server computes two derived session keys: a network session key, NwkSKey, and an application session key, AppSKey. It transmits the AppSKey to the application server and the NwkSkey to the LoRa network server. Then, all application data sent from the device will be sent to the application server via the LoRa server. Data will be ciphered using the application session key and include a message identification code computed with the network session key. All MAC messages sent to the Lora network server will be ciphered with the network session key.
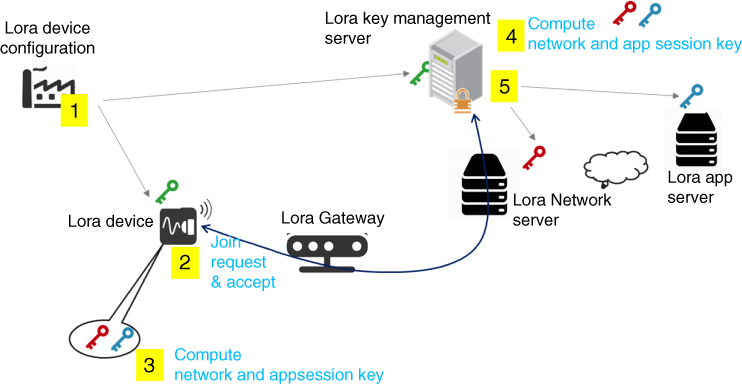
Figure 3.6 LoRa device security bootstrap using separate network and application server.
Regarding the issue of who operates the LoRa key management server, there are two distinct cases:
- I The communication service provider operating the network server is sufficiently trusted by the party deploying the LoRa application. In this case the key management server will be operated by the communication service provider, and the benefit of the architecture described in Figure 3.6 will lie in the possibility to place key management operation in a separate trusted server, possibly serving several LoRa networks.
- II The communication service provider is not sufficiently trusted; then an independent neutral party could operate the LoRa key management server. This scheme will ensure complete separation between the application and network credentials.
3.5 Cellular and 3GPP Technologies for the Support of Smart Grid
The advantage of using 3GPP technologies for IoT applications is their almost worldwide coverage and usage of licensed spectrum that, unlike the unlicensed spectrum, provides for higher reliability and interference control. Today's 3GPP technologies are largely optimized for high data rate (human) communications. This makes 3GPP technologies less suitable for wide‐area IoT deployments where battery usage and cost might be important requirements. In Section 3.5.1 we provide an overview of the shortcomings of 3GPP technologies up to Release 11 when used for wide‐area IoT deployments. The ongoing improvements within the various 3GPP working groups (Releases 12–14) for the domain of wide‐area IoT are presented in Section 3.5.2.
3.5.1 Limits of 3GPP Technologies up to Release 11
The 3GPP technologies up to Release 11, especially 3G and 4G technologies, are optimized for high‐rate data transmissions. This optimization means, among others, increasing the system carrier bandwidth (e.g., 200 KHz carrier in GSM toward an aggregate of up to five 20 MHz carriers in LTE‐A), multiple‐input and multiple‐output (MIMO) transmission and reception, and higher‐order modulation schemes (e.g. 64QAM). The support of these functionalities at the device increases the complexity and performance requirements of its hardware components, resulting ultimately in higher costs and high power consumption.
For devices' power‐saving purposes, 3GPP specifies a so‐called discontinuous reception (DRX) process where the device periodically (i.e., the so‐called DRX cycle) wakes up to monitor for paging messages and be reachable. The longer the DRX cycle, the lower the device power consumption but also the lower the responsiveness of the communication. The possible values of DRX cycles (e.g., up to 2118 ms and 2560 ms for GSM and LTE, respectively) were defined with communication scenarios involving humans in mind. Wide‐area IoT deployments might allow for longer DRX cycles enabling longer battery life time of the devices at the cost of a (somewhat) reduced but still acceptable responsiveness of the communication.
3GPP systems have relatively large signaling overhead when compared to rather small amounts of user data that is typically transferred in IoT deployments. For example, during one LTE data session setup procedure about 66–72 bytes or 120–193 bytes of control signals need to be transmitted in the uplink or downlink, respectively (3GPP, TR36.822). Similarly, the GPRS and UMTS attach procedure also involves the delivery of non‐negligible signaling overhead. Reducing the measurement and signaling effort for mobility purposes at the device in terms of regular pilot signal's measurements and reporting as well as location area updates; e.g., IoT deployments with fixed devices can also reduce devices' power consumption.
Deep indoor coverage is an important issue for IoT applications, especially if the majority of the deployed devices are located deep in the buildings and at fixed locations. The development of 3GPP systems up to Release 11 was targeting scenarios with less demanding propagation shadowing and indoor penetration conditions and user speed of, e.g., 3 km/hour emulating human behavior in pedestrian environments.
Most 3GPP technologies operate in a frequency division duplexing (FDD) mode, allowing simultaneous transmission and reception at base stations or devices, which has the disadvantage of expensive RF components (i.e., the duplexer). Delay‐tolerant IoT applications can allow a half‐duplex frequency division duplexing (HD‐FDD) mode where transmission and reception can occur in turns removing the need for expensive RF components, with the cost of reduced user throughput.
3.5.2 Recent Enhancements of 3GPP Technologies for IoT Applications (Releases 12–13)
A high‐level overview of the 3GPP developments for IoT applications is provided in Figure 3.7. The time lines shown in this figure correspond with the (indicative) formal freeze dates of the various 3GPP Releases. Actual implementation time lines may depend on various factors such as the level of complexity of the functionality and/or urgent market demand.
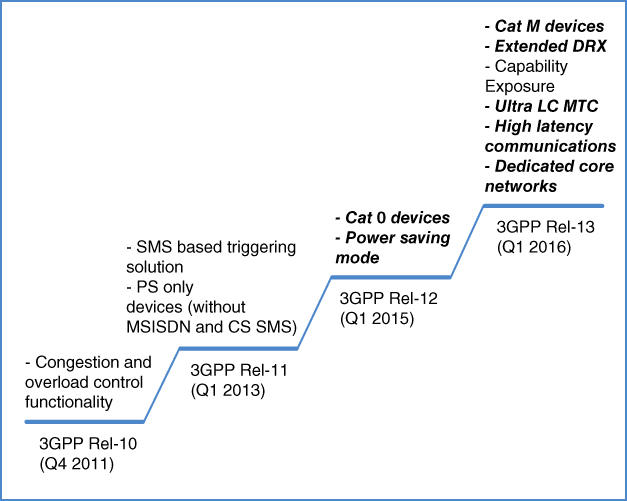
Figure 3.7 A high‐level overview of new machine‐type communications related functionality with the subsequent 3GPP releases.
Here, the scope is limited to the following IoT enabling functionalities in 3GPP Releases 12 and 13:
- LTE Cat‐0 and Cat‐M1 devices; and
- narrow‐band Internet of Things (NB‐IoT) and Cat‐NB1 devices.
3.5.2.1 LTE Cat‐0 and Cat‐M1 devices
The LTE Cat‐0 terminal category was introduced in 3GPP Release 12 with the following major features:
- 1 Rx antenna compared to a minimum of 2 Rx antennas for other device categories. This reduces the number of RF chains and components by the devices, as well as baseband processing, e.g., for channel estimation.
- Peak date rate of 1 Mbps in downlink/uplink (DL/UL), compared to those of 10 Mbps / 5 Mbps for the lowest Cat‐1 of non‐M2M LTE devices.
- Half‐duplex FDD (optional), for delay‐tolerant services. This is to reduce RF components, with a side benefit of lower noise figure at the devices.
LTE Cat‐0 devices have about 50% lower cost due to reduced hardware complexity in comparison with Cat‐1 devices (Nokia, 2014). This might be comparable to a 2G GPRS modem. However, it should be noted that the price of devices is not only determined by the hardware costs but is, e.g., also dependent on the production volume, which is hard to predict at this stage. Although the peak power consumption is reduced, the power consumption in practice will depend on the activity level of devices (e.g., communication pattern and the mobility of the devices) and whether other energy‐saving enhancements are introduced.
The Cat‐M1 terminals have been specified for 3GPP Release 13, aiming to further reduce the device complexity compared with Cat‐0 devices (3GPP, RP141865) and with the following major features:
- Improved coverage, with link budget of 155.7 dB. This is achieved via transmission time interval (TTI) bundling and repetition, i.e., sending the same (or a different version) of a packet multiple times without waiting for feedback.
- Up to ∼10 years of device battery life with 5 watt hour battery.
- A lower bandwidth of 1.08 MHz for Cat‐M1 devices. It is noted that the LTE network may still have the normal LTE bandwidth of up to 20 MHz (per carrier), but only 1.08 MHz of the total system bandwidth is relevant for the Cat‐M1 devices, i.e., signals that are relevant for these Cat‐M1 devices are completely sent within this 1.08 MHz bandwidth (3GPP, TS36.300).
- Variable data rates between 10 Kbps and 1 Mbps, depending on coverage needs.
- Implementation of a lower UE maximum transmit power of 20 dBm, instead of conventional 23 dBm (which sacrifices 3 dB on the achievable coverage). This allows integration of a power amplifier in a single chip solution.
- Support of half‐duplex operation.
Cat‐M1 devices have about 50% lower cost (in the sense of hardware complexity) in comparison with Cat‐0 devices (Nokia, 2014).
3.5.2.2 Narrow‐Band Internet of Things (NB‐IoT) and Cat‐NB1 Devices
3GPP has also specified a clean‐slate RAN solution for cellular IoT applications, named as narrow‐band Internet of Things (NB‐IoT) (3GPP, RP151621), which provides improved indoor coverage, support for a massive number of low‐throughput devices, low delay sensitivity, ultra‐low device cost, low device power consumption, and optimized network architecture. This is largely based on a previous 3GPP study item results (3GPP, TR45.820). NB‐IoT devices use bandwidth of 180 kHz for both downlink and uplink. In the downlink, OFDMA is used with subcarrier spacing of 15 kHz. In the uplink, SC‐FDMA is used with two possible sub‐carrier spacings: 15 kHz and 3.75 kHz.
To further reduce the complexity and cost of Cat‐NB1 devices, half‐duplex operation and single HARQ process are specified for NB‐IoT. The Cat‐NB1 devices have been designed to reach the following key performance targets:
- Low device cost, i.e., lower than that of Cat‐M1 devices.
- Up to ∼10 years of device battery life with 5 watt hour battery.
- Improved coverage, with link budget of 164 dB.
- Support of massive number of devices (around 50,000 devices per cell).
- Deployment flexibility and co‐existence with existing technologies.
Next to reusing repetitions (as in Cat‐M1) the improved coverage for Cat‐NB1 devices is due to the narrower transmission bandwidth.3
The battery life improvement is due to longer IDLE mode discontinuous reception (DRX) cycles for Cat‐NB1 up to 3 hours (versus ∼44 min for Cat‐M1) while in connected mode both device classes have same standardized DRX cycle lengths.
Further, NB‐IoT reuses the LTE authentication and key agreement (AKA) scheme for security purposes.
The NB‐IoT standardization in Release 14 in 3GPP (frozen end of 2017) introduced enhancements of the UE positioning accuracy, multicast transmissions, etc. The further IoT enhancements regarding improved coverage (e.g., via multi‐hop relaying), scalability, and ultra‐reliable low‐latency communication (URLLC) are also considered as important topics for 5G standardization in Release 15, which is due end of 2018.
It should be noted that 3GPP is also standardizing the extended‐coverage GSM IoT (EC‐GSM‐IoT). EC‐GSM‐IoT is a further enhancement of eGPRS to support high‐capacity, long‐range, low‐energy, and low‐complexity cellular IoT applications. The performance targets are similar as with Cat‐M1 and Cat‐NB1 terminals, i.e., extended coverage with link budget of 164 dB (154 dB) for UE with 33 dBm (23 dBm) output power, up to ∼10 years battery life, and throughput of up to 240 Kbps.
3.5.3 Performance of Cellular LTE Systems for Smart Grids
The capacity of cellular systems is typically defined as the maximum number of supported users per cell having a desired performance for a particular service. In relation to smart grids, a desired performance from a communication point of view is having reliable transfer of the smart grid data from the source to the destination within a predefined end‐to‐end delay. The quantification of number of supported users per LTE cell for a given end‐to‐end delay criteria (e.g., 95% maximum delay value) has been analyzed in Zhang (2016) and SUNSEED (2016). The analysis in Zhang (2016) quantifies the impact of the amount of reserved resources on the LTE carrier as well as the scheduling policy. It can be concluded that a scheduling algorithm that tries to minimize the end‐to‐end delay is very beneficial and should be deployed for smart grid applications support. Further, the amount of reserved physical resources on the LTE carrier is determined by the upper bound for the delay requirement and the expected number of users per LTE cell. For example, from the LTE simulation results in an urban environment and only a single physical resource block (e.g., 180 kHz in frequency and 1 ms in time domain) reserved for the smart grid traffic corresponds to 250 or 2500 supported smart grid nodes per LTE cell if the desired 95% end‐to‐end delay is lower than 1 s or 10 s, respectively. When the LTE performance is compared between the regular LTE system and the NB‐IoT feature, it can be seen from SUNSEED (2016) that for a single physical resource block (PRB) the delay performance is increased by roughly a factor of three. The main reason for this is that the NB‐IoT design was driven from the coverage and efficient battery usage point of view and not from having a minimum delay as the main driver.
An additional relevant comparison is the communication network performance between the non‐3GPP systems such as LoRa™ and Sigfox and the 3GPP‐based wireless networks for wide‐area IoT deployments, which is the relevant deployment scenario for smart grid support. This comparison is done by using four important criteria: coverage, capacity, battery usage, and costs. This is illustrated in Table 3.3. From this comparison table, the following trends can be observed:
- Now that 3GPP Release 13 specification of NB‐IoT is finished and commercial products are becoming available, the 3GPP technology can compete on coverage and low power usage with LoRa™ and Sigfox networks for low‐rate, battery‐powered wide‐area IoT deployments. Which wireless technologies will have a predominant role in this IoT deployment segment also depends on market trends and the whole business environment.
- LoRa™ and Sigfox networks are not suitable for wide‐area IoT deployments where end devices need higher throughputs (e.g., above 50 Kbps) and more symmetric uplink and downlink communications.
Table 3.3 Comparison of IEEE 802.11ah, LoRa™, and Sigfox with 3GPP IoT Developments.
| 802.11ah | LoRa™ | Sigfox | 3GPP <= Rel. 12 | 3GPP >= Rel. 13 | |
| Coverage | Up to 1 km outdoor | 160 dB typical link budget with cell range up to few (tens) km. Might be influenced by interference in ISM band. | 160 dB typical link budget with cell range up to few (tens) km. Might be influenced by interference in ISM band. | Typically, 140 dB increased up to 155 dB with CE improvements. Probably lower cell range (or indoor penetration) than LoRa™ or Sigfox | 160 dB typical link budget with cell range up to few (tens) km. |
| Capacity | Up to 8191 STAs associated with 1 AP. Throughput: 0.15–4 Mbps (1 MHz), 0.65–7.8 Mbps (2 MHz) |
Up to few hundreds bps throughput per sensor and highly asymmetric uplink (more data than downlink). Few (tens) of thousand sensors per cell. Might be influenced by interference in ISM band. | Up to 50 Kbps throughput per sensor and highly asymmetric uplink (more data than downlink). Few (tens) of thousand sensors per cell. Might be influenced by interference in ISM band. | Up to 200 Kbps (Cat‐M) throughput per sensor and more symmetrical uplink vs downlink capacity. Up to few thousand sensors per cell depending on throughput and delay requirements. More predictable and planned due to licensed bands. | Up to 50 Kbps (Cat‐NB1) throughput per sensor and more symmetrical uplink vs downlink capacity. Up to few tens thousands of sensors per cell depending on throughput and delay requirements. More predictable and planned due to licensed bands. |
| Battery usage | From months to a few years | ∼10 years or more | ∼10 years or more | Few years till 10 years (yet to be proven) | ∼10 years or more (yet to be proven) |
| Costs | Low CAPEX due to ISM band and low‐cost module, easy deployment, low OPEX due to independence of network operators. | Low CAPEX due to ISM band and low‐cost sensors (< $5), low OPEX due to battery lifetime. | Low CAPEX due to ISM band and low‐cost sensors (< $5), low OPEX due to battery lifetime. | Depends on business case as provided by Mobile Network Operator | Depends on business case as provided by Mobile Network Operator |
3.5.4 LTE Access Reservation Protocol Limitations
For traditional mobile broadband uses, the capacity of an LTE network is usually limited by the resources available for data payload transmissions. However, when used for machine‐to‐machine (M2M) or machine‐type communications (MTC), such as smart grid data traffic, where a large number of individual data packets are sent from many different devices in the network, the capacity of the different control channels may instead be a limiting factor. The goal of the analysis presented in this section is to identify the potential bottlenecks in LTE when used for MTC and to study different bottleneck scenarios through a proposed mathematical model and protocol simulations. The full analysis is published in the journal article by Madueno (2016), whereas this section summarizes and emphasizes the most relevant concepts and results in relation to smart grid communications.
As already outlined, the traffic profile generated by smart‐grid monitoring devices is an example of MTC/M2M traffic, characterized by sporadic transmissions of small amounts of data from a very large number of terminals. This is in sharp contrast with the bursty and high data‐rate traffic patterns of the human‐centered services. Another important difference is that smart grid services typically require a higher degree of network reliability and availability than the human‐centered services (Goel, 2013). So far, cellular access has been optimized to human‐centered traffic, and M2M‐related standardization efforts came into focus only recently (3GPP, Rel‐11 overview).
Due to the sporadic, i.e., intermittent, nature of M2M communications, it is typically assumed that M2M devices will have to establish the connection to the cellular access network every time they perform reporting. Usually, the inactivity timer in LTE is around 10 sec, meaning that after 10 sec of idle connectivity, the UE will have to go through the steps of the LTE access procedure to obtain a new connection. Since the establishment of many connections may pose a significant burden to the operation of the access protocol, it is important to consider the whole procedure associated with the transmission of a data (report) in order to properly estimate the number of M2M devices that can be supported in an LTE access network.
3.5.4.1 LTE Access Procedure
The downlink resources in LTE in the case of frequency division duplexing (FDD) are divided into time‐frequency units, where the smallest unit is denoted as a resource element (RE). Specifically, the time is divided in frames, where every frame has ten subframes, and each subframe is of duration of ![]() . An illustration of a subframe is presented in Figure 3.8. Each subframe is composed in time by 14 OFDM‐modulated symbols, where the amount of bits of each symbol depends on the modulation used, which could be QPSK, 16QAM, or 64QAM. The system bandwidth determines the number of frequency units available in each subframe, which is typically measured in resource blocks (RBs), where an RB is composed of 12 frequency units and 14 symbols, i.e., a total of 168 REs. The amount of RBs in the system varies from 6 RBs in 1.4 MHz systems to 100 RBs in 20 MHz systems.
. An illustration of a subframe is presented in Figure 3.8. Each subframe is composed in time by 14 OFDM‐modulated symbols, where the amount of bits of each symbol depends on the modulation used, which could be QPSK, 16QAM, or 64QAM. The system bandwidth determines the number of frequency units available in each subframe, which is typically measured in resource blocks (RBs), where an RB is composed of 12 frequency units and 14 symbols, i.e., a total of 168 REs. The amount of RBs in the system varies from 6 RBs in 1.4 MHz systems to 100 RBs in 20 MHz systems.

Figure 3.8 Simplified illustration of downlink and uplink subframe organization in a 1.4 MHz system (Nielsen, 2017).
In the downlink, there are two main channels; these are the physical downlink control channel (PDCCH) and the physical downlink shared channel (PDSCH). The PDCCH carries the information about the signaling/data being transmitted on the current PDSCH and the information about the resources that the devices need to use for the physical uplink shared channel (PUSCH), as illustrated in Figure 3.8. Therefore, signaling and data messages consume resources both in the control and shared data channels. The PDCCH is located in the beginning of each subframe. The remaining resources are used for the physical broadcast channel (PBCH), primary and secondary synchronization signals (PSS and SSS respectively), and PDSCH, as shown in Figure 3.8. Obviously, there is a scarcity of resources for MAC messages in the PDSCH.
The uplink resources are organized as in the downlink, with the main difference being that the smallest resource that can be addressed is an RB. The physical uplink shared channel (PUSCH) is used by devices for signaling and data messages, where several devices can be multiplexed in the same subframe. When present, the PRACH occupies 6 RBs and occurs periodically, from once in every two frames (20 subframes) to once in every subframe. A typical PRACH period is once every 5 subframes (3GPP, R2‐105212).
3.5.4.2 Connection Establishment
The first part of the connection establishment in LTE is the access reservation procedure (ARP). The ARP in LTE consists of the exchange of four Medium Access Control (MAC) protocol messages between the accessing device denoted UE and the eNodeB, as shown in Figure 3.9. The first message (MSG 1) is a random access preamble sent in the first available PRACH subframe, also called random access opportunity (RAO). The number of subframes between two RAOs varies between 1 and 20. The used preambles are chosen randomly from the set of 64 orthogonal preambles, where usually at most 54 are available for contention purposes and 10 are reserved. The contention scheme is based on slotted ALOHA (3GPP, TS36.321; 3GPP, TS36.213), but unlike in typical ALOHA scenarios, the eNodeB usually cannot detect which preambles have been activated if multiple activations (collisions) have occurred (Sesia, 2011; Thomsen, 2013).

Figure 3.9 Message exchange between a smart meter and the eNodeB (Nielsen, 2017).
In MSG 2, the eNodeB sends a random access response (RAR) to all detected preambles. The contending devices listen for the MSG 2 in the downlink channel. If it is not received within a short time period and the maximum allowed number of MSG 1 transmissions has not been reached, the device backs off and restarts the random access procedure. If received, MSG 2 includes uplink grant information that indicates the RB in which the connection request (MSG 3) should be sent. The connection request specifies the requested service type, e.g., voice call, data transmission, or measurement report. When two devices select the same preamble (MSG 1), they receive the same MSG 2 and experience collision when they send their respective MSG 3 in the same RB.
In contrast to the collisions for MSG 1, the eNodeB is able to detect collisions for MSG 3. The eNodeB only replies to the MSG 3s that did not experience collision, by sending message MSG 4 (i.e., RRC connection setup). The message MSG 4 may lead to two different outcomes: either the required RBs are allocated or the request is denied in case of insufficient network resources. The latter is, however, unlikely in the case of M2M communications, becauase of the small payloads. If the MSG 4 is not received within a period of time since MSG 1 was sent, the random access procedure is restarted. Finally, if a device does not successfully finish all the steps of the random access procedure within the permitted number of transmissions, an outage is declared.
After the ARP exchange finishes, there is an additional exchange of MAC messages between the smart meter and the eNodeB, whose main purposes are to establish security and quality of service for the connection, as well as to indicate the status of the buffer at the device. Those are represented by the “additional signaling” block in Figure 3.9.
Besides MAC messages, there are PHY messages included in the connection establishment (3GPP, TR36.822). A complete list of both PHY and MAC messages exchanged during connection establishment, data report transmission, and connection termination can be seen in, for example, Madueno (2016). For every downlink message, a preceding downlink grant in the PDCCH is required. Similarly, every time a UE wishes to transmit in the uplink after the ARP, it first needs to ask for the uplink resources by transmitting a scheduling request in the PUCCH. This is followed by provision of an uplink grant in the PDCCH by the eNodeB.
3.5.4.3 Numerical Evaluation of LTE Random Access Bottlenecks
We consider a typical 5 MHz (25 RBs) cell configured with one RAO every 5 subframes, 54 available preambles for contention, and a backoff value of 20 ms (METIS, 2013). In addition, we also investigate the performance of the smallest bandwidth cell in LTE, which corresponds to a 1.4 MHz (6 RBs) and RAO interval of 20 subframes.We focus in the lowest modulation in LTE (QPSK). Further, we consider that monitoring devices are reporting every 10 s, which allows for frequent monitoring and control of the smart grid. Report sizes of both 100 and 1000 bytes are considered to illustrate the impact of small and large payload on the system performance. Results are shown both for the analytical model presented in Madueno (2016) and corresponding simulation results. The considered performance metric is the service outage, Poutage, as a function of the number of supported users. The outage probability is defined as the probability of a device not being served before reaching the maximum number of failed PRACH transmission attempts (here we allowed 10 transmission attempts).
First, in Figure 3.10 we investigate the performance of traditional LTE 1.4 and 5 MHz systems and compare those results to the case of a simplified access procedure where the “additional signaling” following MSG 4 in Figure 3.9 is omitted. The striking conclusion is that for both the 1.4 MHz and 5 MHz cases, the number of supported arrivals can be increased by almost a factor of 3, going from 400 to 1000 arrivals/s and from 1500 to 4000 arrivals/s, respectively, if the additional signaling could be omitted. Obviously, the additional signaling must be accounted for as it has a large impact on the system performance.

Figure 3.10 Outage comparison for only ARP and data transmission (ARP + Data) and full message exchange (ARP + Signaling + Data; Nielsen, 2017).
Second, we consider only the reduced signaling case where immediately after the ARP (i.e., after MSG 4), the data transmission starts. The impact of the payload (MAC layer limitations) becomes clear in Figure 3.11. A 1.4 MHz system can support a few hundreds (100 arrivals/s) for large eSM payloads (1000 bytes) and up to 1000 arrivals/s for small SM payloads (100 bytes). As expected, increasing the bandwidth does help to increase the capacity of the system, raising the number of supported arrivals to 700 arrivals/s and 4000 arrivals/s, respectively. It should be noted that if the ARP is neglected and the focus is solely on the data capacity, up to 9000 arrivals/s can be supported. When compared to our results, where the different ARP limitations are taken into account, it is clear that for M2M scenarios, data capacity–based analyses are too simplistic and give overly optimistic results.

Figure 3.11 Probability of outage in LTE with respect the number of M2M arrivals per second in a 1.4 MHz and 5 MHz system for different models and payload sizes (Nielsen, 2017).
A key finding of the study of bottlenecks in the LTE access reservation protocol is that especially in M2M scenarios such as smart grids, the signaling channels PRACH and PDCCH may limit the number of supported devices. In case of larger payloads, (e.g., PMU measurements), the PUSCH channel that carries the payload data may instead be the limiting factor. The study also demonstrates how inefficient LTE is, if the used reporting interval causes devices to go through the access reservation protocol for every message transmitted. Specifically, it was shown that if a simplified access procedure with less signaling messages was used, the number of supported devices could be increased by almost three times.
3.5.5 What Can We Expect from 5G?
Many research, standardization, and business‐related bodies have arrived to a consensus that 5G wireless networks will support three generic services: enhanced mobile broadband (eMBB), massive machine‐type communication (mMTC), and ultra‐reliable low latency communications (URLLC). eMBB is about supporting very high data rates and consistent wireless connectivity and coverage, regardless of whether the user is in a crowd or in a rural area. mMTC refers to the support of massive number of simple machine‐type devices and, in that sense, it is an evolution of NB‐IoT. URLLC are aimed at supporting mission‐critical connectivity, with packet error rates going down to 10−5 or even 10−8 in a controlled industrial environment, while the latency of a packet delivery goes below 5 ms, even below 1 ms in some cases.
Differently from the previous generations of mobile communication systems, 5G will be very much focused on supporting various vertical industries, such as energy, transport, manufacturing, and health care. The smart grid communication plays a central role in defining the relationship between 5G and the energy sector. Even more, smart grid communication represents a large business potential for 5G (5GPP‐IA, 2015), both due to the use of URLLC in applications for energy protection, control, and distributed automation because of the importance of mMTC for supporting the future smart metering.
Perhaps the highest novelty in 5G is brought by URLLC, which aims to provide extremely robust links with guaranteed latency and reliability. The existence of URLLC links can significantly change the design approach to distributed cyber‐physical systems, and one of the main use cases is related to smart grid distribution automation. Specifically, 3GPP is considering the use of URLLC in wide‐area monitoring and control systems for smart grids (3GPP, TR22862). Initial performance requirements have been derived from EC FP7 project METIS (METIS, 2013):
- Throughput: from 200 to 1521 bytes reliably (99.999 %) delivered in 8 ms.
- One trip–time latency between any two communicating points should be less than 8 ms for an event‐triggered message that may occur anytime.
- Device density:
- dense urban hundreds of UEs per km2;
- urban around 15 UEs per km2;
- populated rural max 1 UE per km2.
As a specific example, the use case of smart grid substation control for power outage avoidance requires end‐to‐end latency lower than 1 ms and packet loss probability lower than 10−4.
In summary, there is a symbiotic relationship between two of the modes in 5G (mMTC and URLLC) and the smart grid communication, since the former provides the technology and the latter represents one of the most important use cases that encompasses both mMTC and URLLC.
3.6 End‐to‐End Security in Smart Grid Communications
Security is an important issue for smart grid communications, and this is easily understood when considering the potential disruptions resulting from the unavailability of the power grid. The role of the security framework is to protect the grid against unfriendly attacks. Its definition starts with the definition of the security objectives, which may be stated as follows (EG, 2012):
- avoid international, cross‐border, national, or regional power outage (availability objective);
- avoid international, cross‐border, national, or regional damage to the infrastructure;
- avoid significant impact to energy market participants; this includes fraud prevention;
- avoid significant impact on operations and maintenance of the grid;
- protect citizen personal data by insuring privacy of communications; and
- protect people from safety issues (including those caused by equipment malfunction or used outside of safety limits).
The definition of the security risks is also depending upon the attackers' profiles. The following profiles are commonly identified (EG, 2012):
- individual hackers or criminals trying to gain some advantage (financial or other) by hacking the grid or individual device end points;
- crime organizations motivated by ideological, political, or financial reasons trying to disrupt the functioning of the grid or target customer data;
- large groups of protesting citizens, manipulated by a few active individuals and acting in reaction to specific issues; and
- foreign government organizations aiming at disorganizing the functioning of another country society.
The protection of the data communications occurring in a smart grid is central to meet the security objectives. Security, however, often appears like an onion, made of several layers, and the main reason for this situation is that several actors coexist in the security chain, and they need to operate without interfering with each other. The superposition of security schemes is the simplest way to achieve separation of roles, even if this benefit is paid by a higher overhead in terms of data transmitted and computing power. This overhead translates in terms of energy consumption, which is sometimes an important issue in IoT use cases.
For smart grid communications, the following security actors may be identified:
- the communication service provider (i.e., telecom operator);
- the IT team of the DSO or associated partners;
- the DSO or associated partners' application management and deployment team; and
- end‐point device manufacturers.
Smart grid applications often involve the deployment of three distinct security layers:
- network access security;
- transport level security; and
- application level security.
In the following sections, each of these layers is treated individually.
3.6.1 Network Access Security
This type of security targets the protection of the data transiting through networks. For data transiting via public networks, the communication service provider will generally provide security mechanisms under its control to secure the data transmission. In 3GPP wireless networks, UICC cards are used to secure the communication from the terminal equipment to the core of the MNO network. The use of private access point names (APN) protected by specific credentials is another option to isolate data further from the public network by restricting/limiting access to a private network.
Another security layer, possibly managed by the IT team of the DSO or one of its partners, may be added to the telco‐managed data protection. Virtual private networks (VPN) can be used to create this protection layer protecting the transferred data via public networks in a ciphered tunnel. VPNs are usually a corporate‐controlled protection. They are used to connect data centers together or to connect communicating devices or human beings to data centers. Data is protected up to the corporate VPN gateway and will need an extra security scheme to extend security beyond that point.
Network access generally includes an access rights–management layer, which is defining network access rules and does not deal with application access control. Finally, network access security provides an overall data protection possibly shared by multiple application streams.
3.6.2 Transport Level Security
This type of security primarily aims at protecting point‐to‐point data communication between two communicating nodes by securing the transport layer. It provides a good specific protection for the data stream of particular applications. Transport level security is independent from the communication channel (4G, Wi‐Fi, PCL, or Ethernet). It does not require any ciphering of the data payload and is, therefore, transparent from the data‐handling part of the application. Transport level security is very widely used along with IP communications; in this case TCP links are secured using either TLS protocols and UDP links using the DTLS protocol or adaptation of TLS for datagram transmissions. Transport level security may be used as complement to network access security to protect data in the LAN part of the communication. The credentials used to setup transport level protection are sometimes also used to enforce application access control. Transport level credentials are typically managed by the application deployment or management team.
3.6.3 Application Level Security
This type of security aims at the protection of the application payload. It is not commonly implemented when there a transport exist, but may be necessary when the transport layer is absent (see above the case of LoRa or Sigfox communications). As an analogy, setting up end‐to‐end application level security may be compared to setting up voice encryption from handset to handset for mobile communications. It involves the setup of a credential distribution mechanism to protect voice communication. Application level security is useful to protect the payload when the application data has to transit via several untrusted communication nodes, requiring an overall data protection from the data source to the data destination with a single set of credentials. Application level credentials are managed by the application deployment team.
Figure 3.12 illustrates the use of different data protection schemes for a communicating WAMS sending data through a 3G/3G communication modem. We see three types of data protections involved: 3G/4G network access, VPN, and transport security. Application level security has been omitted to simplify the figure.
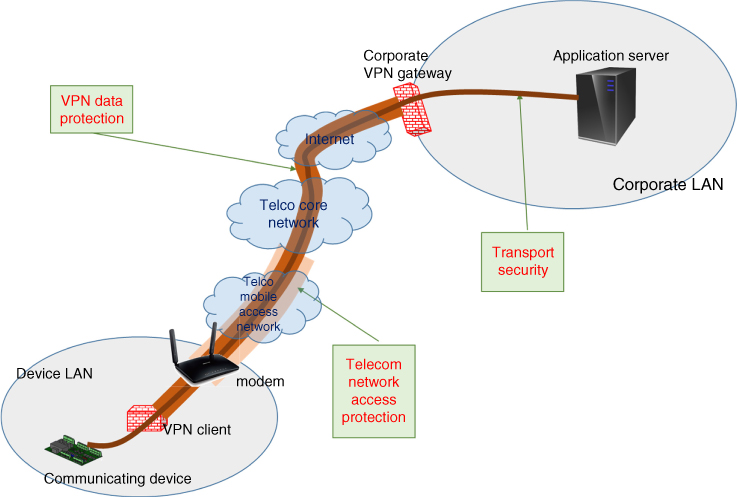
Figure 3.12 Illustration of different types of data protection schemes.
3.6.4 End‐to‐End Security
From the security standpoint, the need to achieve end‐to‐end security is now prevailing and becoming widely accepted. End‐to‐end security involves the protection of the whole communication path, from source to destination. The simplest way to achieve it over a multi‐hop communication scheme is to protect each hop of the communication independently from the next. Such security is sometimes referred as “hop‐by‐hop security,” and it is very common to see hop‐by‐hop security implemented at least at the transport level, where each hop is protected using a hop specific set of credentials. This approach makes it possible to have credentials for each hop managed by different parties.
3.6.5 Access Control
Access control is used to regulate access to controlled resources. The meaning of access control depends upon the resource that needs to be protected. Each of the security layers described above may be associated to a specific kind of access control:
- Access control for telecom networks regulate access to telco‐operated networks.
- Access control for VPN controls, which may set up a point‐to‐point VPN connection.
- Access control for IoT or smart‐grid applications defines the rules of interaction between different IoT nodes, and such control is required in almost all IoT applications.
The main problem, however, is to manage access control in a heterogeneous environment composed of a number of independent applications. Furthermore, a responsibility and liability problem may arise when communicating IoT nodes are not owned by the same business entity. The questions arising are: Who may manage access control? And what is the liability involved in doing so?
Authorization delegation helps to solve those problems. It consists in delegating access control to an external entity, which manages access control rules. This notion of authorization delegation has emerged during the last decade to solve the problem of controlling access to cloud data from cloud applications. The Oauth2 protocol is commonly used for this purpose. It presents the great advantage of making possible the centralization of access control decisions in a single platform (policy decision point). Access rights granted are typically materialized in the form of digital access tokens, which need to be presented at the access control enforcement point to gain access to protected resources.
Figure 3.13 illustrates the benefits of access control delegation, by considering a typical smart grid use case.

Figure 3.13 Illustration of access control delegation for a smart‐grid application.
In this figure a WAMS node is periodically sending power measurements data to the cloud using a publish/subscribe protocol (such as the popular MQTT protocol). Data published from the WAMS is sent to a publish/subscribe server in the cloud (publishing is typically performed on a specific “topic”). A data‐processing application will subscribe to the data sent by the WAMS device, process it, and store the result in a cloud database. Two resources in this scenario need to be access controlled:
- Publish/subscribe: Controlling publish/subscribe involves controlling who may publish or subscribe on a specific topic.
- Database: controlling access to the database involves controlling who can read, query, or write in the cloud database.
A common situation is that the publish/subscribe server and the database will have their own access control system. A first possibility is therefore to manage access rights independently in the database and in the publish/subscribe server. Unfortunately, this approach is time consuming and error prone and can lead to the introduction of security weaknesses because access rights are generally granted in the context of a work flow (as the one described). It is therefore likely that the need will arise to grant or remove simultaneously publish/subscribe and database access rights.
Access control delegation enables the delegation of access control management to an independent authorization server. This server may possibly tie publish/subscribe and database access rights together, allowing for holistic access control management at the level of the work flow. The Oauth2 protocol mentioned above may be used to implement such authorization delegation. In this case authorization decisions made by the authorization server are materialized by digital access tokens to be presented at the access enforcement point (publish/subscribe server or database).
Who is responsible in such a scenario to operate the authorization server? Different possibilities may be envisaged:
- When a single business actor is involved, this actor may operate the authorization server for its own benefit.
- When two or more business actors are involved, one of them may be trusted to operate the authorization server for the mutual benefit of all parties. This is a good solution if there is no or little liability involved.
- When liability is important, the authorization server may be operated as a service by a separate trusted entity.
3.7 Conclusions and Summary
The smart grid presents a wide variety of applications with very different communication requirements, ranging from a potentially huge number of sensors that do not communicate very often, through a moderate number of measurement and control nodes with a moderate data rate, to mission‐critical grid protection that requires extremely low latency and ultra‐reliable communication. In all cases the communications require end‐to‐end security to protect privacy, integrity, and confidentiality, manage permissions, and avoid malicious attacks.
In the present chapter, we have described and analyzed the most relevant wireless cellular communication technologies for supporting the smart grid. Specifically, we have considered the non‐3GPP technologies IEEE 802.11ah, Sigfox, and LoRa. Under the umbrella of 3GPP, we have looked specifically at releases up to and including Rel. 11 as well as Rel. 12 and Rel. 13.
3GPP's proposed RAN solution for cellular IoT in Rel. 13, denoted NB‐IoT, is able to compete with Sigfox and LoRa in terms of coverage and low power for low‐rate, battery‐powered wide‐area IoT deployments. Further, it is able to support higher and more symmetric (uplink/downlink) throughputs.
LTE is capable of supporting real‐time smart‐grid applications such as real‐time monitoring and control, where the latency and reliability requirements are not as extreme as for grid‐protection functions. Specifically, LTE is well suited for measurement stream with reporting intervals around 1 to 10 seconds. For longer intervals, the LTE access reservation procedure becomes a bottleneck and effectively reduces the number of supported devices by as much as 3 times, due to signaling overhead. For such applications, with more seldom communication, the lightweight IoT technologies are better suited.
For the strictest smart grid applications related to grid protection, the existing wireless cellular technologies are unable to provide the required performance and reliability. Such applications are, however, covered by the 5G use case ultra‐reliable low‐latency communications (URLLC). Furthermore, the massive machine‐type‐communications (mMTC) use case is also highly relevant for the smart grid.
Protecting the smart grid asset is an important issue, and securing smart grid communications is a critical step to achieve this goal. Smart grid communication may be protected using different layers of security the presence of which is essentially motivated by the need to achieve separation of responsibility between different actors involved in security management. Finally, proper management of access control in a smart grid ecosystem is critical; authorization delegation may help to centralize access control to several independent protected resources in a smart grid ecosystem and implement a work flow–based homogeneous access control.
References
- 3GPP Technical Report TR 36.822, V11.0.0, ‘LTE Radio Access Network (RAN) enhancements for diverse data applications’, September 2012.
- 3GPP Work Item Description RP‐141865, ‘Further LTE Physical Layer Enhancements for MTC’, September 2014.
- 3GPP Work Item Description RP‐151621, ‘Narrowband IOT’, September 2015.
- 3GPP TR 45.820 v13.1.0, ‘Cellular system support for ultra‐low complexity and low throughput Internet of Things (CIoT)’, Release 13, November 2015.
- 3GPP TS 36.300 v13.4.0, ‘Evolved Universal Terrestrial Radio Access (E‐UTRA) and Evolved Universal Terrestrial Radio Access Network (E‐UTRAN); Overall Description; Stage 2’, Release 13, June 2016.
- 3GPP, ‘Overview of 3GPP release 11,’ 3rd Generation Partnership Project (3GPP), Tech. Rep.
- 3GPP, ‘MTC simulation assumptions for RACH performance evaluation’, 3rd Generation Partnership Project (3GPP), TR R2‐105212, August 2010.
- 3GPP, ‘TS 36.321 E‐UTRA medium access control (MAC) protocol specification’, Tech. Rep., 2015.
- 3GPP, ‘TS 36.213 E‐UTRA physical layer procedures’, Tech. Rep., 2015.
- 3GPP, ‘TR 36.822: LTE Radio Access Network (RAN) enhancements for diverse data applications, Rel. 11’, Tech. Rep., September 2011.
- 3GPP TR 22862 v14.1.0, ‘Feasibility Study on New Services and Markets Technology Enablers for Critical Communications’, Release 14, September 2016.
- 5GPPP Infrastructure Association, ‘5G and Energy’, version 1.0, September 2015.
- Adame, T., Bel, A., Bellalta, B., Barcelo, J., and Oliver, M., 2014, ‘IEEE 802.11AH: the WiFi approach for M2M communications’, in IEEE Wireless Communications, vol. 21, no. 6, December 2014, 144–152.
- Boccardi, F., Heath, R.W., Lozano, A., Marzetta, T.L., and Popovski P., 2014, ‘Five disruptive technology directions for 5G’, in IEEE Communications Magazine, vol. 52, no. 2, February 2014, 74–80.
- Deshpande, J.G., Kim, E., and Thottan, M., 2011, ‘Differentiated services QoS in smart grid communication networks’, Bell Labs Technical Journal, vol. 16, no. 3, 2011, 61–81.
- US Department of Energy, 2012, ‘Smart Grid Research & Development: Multi‐Year Program Plan (MYPP)’, URL: http://www.oe.energy.gov.
- European Commission, 2006, ‘European Smart Grids Technology Platform—Vision and Strategy for Europe's Electricity Networks of the Future’, Directorate‐General for Research—Sustainable Energy Systems, URL: http://www.smartgrids.eu.
- Expert Group on the Security and Resilience of Communication Networks and Information Systems for Smart grids, 2012, ‘Cybersecurity of the smart grids; summary report’.
- ETSI GS LTN 002 v1.1.1, 2014, ‘Low Throughput Networks (LTN); Functional Architecture’, September 2014.
- ETSI GS LTN 003 v1.1.1, 2014, ‘Low Throughput Networks (LTN); Protocols and Interfaces’, September 2014.
- Erol‐Kantarci, Melike, Mouftah, H.T., 2013, ‘Machine‐to‐machine communications in the smart grid,’ Machine‐To‐Machine Communications—Architectures, Technology, Standards, and Applications, Misic, J. and Misic, V. (eds.), 2013, Taylor & Francis.
- Goel, S., Bush, S.F., and Bakken, D., 2013, ‘IEEE vision for smart grid communications: 2030 and beyond’. New York, NY, USA, Institute of Electrical and Electronic Engineers.
- Hossain, E., Han, Z., and Poor, H.V., 2012, Smart grid communications and networking. Cambridge University Press.
- IEEE P802.11‐ Task Group AH, 2016, ‘P802.11ah draft 8.0’, URL: http://grouper.ieee.org/groups/802/11/Reports/tgah update.htm.
- Khan, R.H. and Khan, J.Y., 2013, ‘A comprehensive review of the application characteristics and traffic requirements of a smart grid communications network’, Computer Networks, vol. 57, no. 3, 825–845.
- Lander, M., Svoboda, P., Nikaein, N., and Rupp, M., 2013, ‘Traffic Models for Machine Type Communications’, in Proc. of the International Symposium on Wireless Communication Systems (ISWCS 2013), Aug. 2013.
- Lee, K., Eidson, J.C., Weibel, H., and Mohl, D., 2005, ‘IEEE 1588‐standard for a precision clock synchronization protocol for networked measurement and control systems’, in Conference on IEEE, vol. 1588, 2005, 2.
- LoRa Alliance, URL: https://www.lora‐alliance.org/.
- Madueño, G.C., Nielsen, J.J., Kim, D.M., Pratas, N.K., Stefanović, Č., and Popovski, P., 2016, ‘Assessment of LTE Wireless Access for Monitoring of Energy Distribution in the Smart Grid’, in IEEE Journal on Selected Areas in Communications, vol. 34, no. 3, March 2016, 675–688.
- Martin, K., Hamai, D., Adamiak, M., Anderson, S., Begovic, M., Benmouyal, G., Brunello, G., Burger, J., Cai, J., Dickerson, B., Gharpure, V., Kennedy, B., Karlsson, D., Phadke, A., Salj, J., Skendzic, V., Sperr, J., Song, Y., Huntley, C., Kasztenny, B., and Price, E., 2008, ‘Exploring the IEEE standard c37.118‐2005 synchrophasors for power systems’, Power Delivery, IEEE Transactions, vol. 23, no. 4, Oct 2008, 1805–1811.
- METIS D1.1, April 2013, ‘Scenarios, requirements and KPIs for 5G mobile and wireless system’.
- Nielsen, J.J., Corrales Madueno, G., Pratas, N.K., Sørensen, R. B., Stefanovic, C., and Popovski, P., ‘What can wireless cellular technologies do about the upcoming smart metering traffic?’ 2015, IEEE Communications Magazine, vol. abs/1502.01188.
- Nielsen, J.J., and Popovski, P., 2016, ‘Latency analysis of systems with multiple interfaces for ultra‐reliable M2M communication’, in the 17th IEEE International workshop on Signal Processing advances in Wireless Communications, IEEE, 1–6.
- Nielsen, J.J., et al., 2014, ‘Secure Real‐Time Monitoring and Management of Smart Distribution Grid Using Shared Cellular Networks’, in IEEE Wireless Communications, vol. 24, no. 2, April 2017, 10–17.
- Nokia white paper, 2014, ‘Optimizing LTE for the Internet of Things’.
- Sesia, S., Toufik, I., and Baker, M., 2011, LTE—The UMTS Long Term Evolution: From Theory to Practice. Wiley.
- SIGFOX white paper, ‘M2M and IoT redefined through cost effective and energy optimized connectivity’, URL: http://www.Sigfox.com/static/media/Files/Documentation/SIGFOX_Whitepaper.pdf.
- SUNSEED D3.2.2, 2016, ‘Communication solution design for field trial setup’.
- Thomsen, H., Pratas, N., Stefanovic, C., and Popovski, P., 2013, ‘Analysis of the LTE Access Reservation Protocol for Real‐Time Traffic’, IEEE Commun. Lett., vol. 17, no. 8, Aug. 2013, 1616–1619.
- Zhang, H., Jorguseski, L., Chrysalos, M., Golinski, M., Toh, Y., 2016, ‘LTE Delay Assessment for Real‐Time Management of Future Smart Grids’, SMARTGIFT conference, 2016.
- Zhu, Z., Lambotharan, S., Chin, W.H., and Fan, Z., 2012, ‘Overview of Demand Management in Smart Grid and Enabling Wireless Communication Technologies’, IEEE Wireless Communications Magazine, vol.19, no.3, June 2012, 48–56.