7
GHetNet: A Framework Validating Green Mobile Femtocells in Smart‐Grids
Fadi Al‐Turjman1
Antalya Bilim University, Antalya, Turkey
7.1 Introduction
Mobile networks have been experiencing an explosive revolution in the recent decade over numerous radio access technologies such as GSM, LTE‐Advanced, Wi‐Fi, LiFi, etc., which provide a resilient tie to the Internet. This in turn has led to a massive amount of mobile applications among which the smart grid starts to be the foremost one [1, 2]. The smart grid has been evolved recently in managing our vast electricity demands in a sustainable, smart, and economic manner, while utilizing already existing heterogeneous networks' (HetNets) infrastructures. The smart grid is simply an energy network that can automatically monitor the flow of electricity in a city and adjust to changes in users' demands accordingly. It comes with smart meters, which are connected to the Internet to provide consumers/suppliers with smart decisions on their ongoing energy usage/production. For example, a number of smart home appliances such as the dishwasher and air conditioners can communicate with the grid using these smart meters and automatically manage their electricity usage to avoid peak times and make more profit. Within a smart and green grid, mobility has to be intended as the way in which customers can access and explore the grid resources using advanced and eco‐friendly electricity modes. This implies being aware of the available energy resources and their real values (in term of cost, time, and carbon emissions), as well as a simple and unified access to mobile payments. Supporting such an interconnected, heterogeneous, and dynamic grid system with lower environmental impact requires the adoption of innovative and sophisticated solutions from the utility management centers and city administration to control the energy resources and policies in order to proactively enhance/protect them. In order to manage this energy, there is a need for a wireless HetNet that can connect the different system entities, including mobile users' power lines and appliances at home. These wireless HetNets can be home area network (HAN) and/or neighborhood area network (NAN). HANs consists of three components, which measure, accumulate, and examine energy usage from smart devices [3, 4]. NAN connects multiple HANs to local/regional access points (i.e., access points within the range of instantaneous transmitters), where transmission lines carry the data to the utility [3, 7]. HANs need communication infrastructure in order to connect these elements.
One potential solution for such rapidly growing HetNets is the femtocell [1, 5]. A femtocell is a small cell deployed most often for enhanced coverage and energy‐efficient communications. It uses between 8 and 120 mW, which is even lower than the Wi‐Fi access point. Since it can be used as a communication mechanism in HANs and NANs, users can save energy and money using these femtocells in smart grid systems, where the connected home appliances can be programmed to reduce the home electricity demands over the grid as well as the consumers' electricity bill. This can be generalized for homes spanning a country scale, for example, where mobile outdoor femtocells can be utilized to achieve ULS coverages. However, this can overwhelm the existing HetNets' infrastructure and makes our expectations unrealistic in proximity of the green planet vision [1, 39]. Since the number of these femtocells is rapidly growing in several countries nowadays, lots of energy consumption demands and carbon emissions shall be carefully considered over the grid. Moreover, the continuously radiated wireless signals from these dramatically growing HetNets necessitate massive energy supply. This means energy is used for just‐in‐case scenarios where a user might or might not exist. Therefore, femtocells are recommended as powerful candidates vanishing the unnecessary energy loss. Unlike the macrocell, a femtocell can provide local coverage based on users' demands. Meanwhile, the user equipment (UE) can save more energy while connected to a closer femtocell. Thus, femtocell is more energy efficient in addition to providing more coverage, capacity, and better QoS. Nevertheless, significant energy amounts can be wasted in data (re)transmission unless a reasonable load balance is applied between the deployed static/mobile FBSs, which are typically planned to support vast counts of static/mobile users in the grid. This load balance is necessary to avoid overwhelming a femtocell while other feasible femtocells in the same region can still admit the incoming call/data requests. Accordingly, mobile calls/data requests may move to neighboring cells while being served by the FBS, which is a typical departure scenario in the dynamic smart grid. This departure and unavailability of an FBS can degrade the performance of the grid system unless it has been carefully considered at the early planning and validation stages of the femtocellular system design. This would not be achieved without a realistic case study analysis and an accurate analytical model that can predict the system performance under such setups.
In this chapter, a HetNet composed of multiple macrocells and numerous femtocells is deliberated as a use case toward greener future HetNets. Detailed analysis of the system is given for the mobile FBS based on queuing theory concepts. Results are analyzed and elaborated in terms of key performance characteristics of the system such as response time, throughput, waiting time, and energy consumption. The analytical model and solution approach is also validated through extensive measurement‐based simulation results.
7.2 Related Work
There are several attempts in the literature toward validating the effectiveness of HetNets telecommunication systems in general and specifically femtocells. All these attempts can be classified into one of the following performance evaluation techniques: (1) analytical techniques, (2) simulation techniques, and (3) benchmarking (experimental) techniques.
Analytical techniques validate the behavior of a femtocell system using mathematical concepts and languages. For example, [8] proposed a closed‐form expression that describes the derived spectral and energy efficiency in mobile femtocell networks. They investigate the spectral efficiency for multi‐user system‐level using opportunistic scheduling schemes/algorithms. In [9], exponential path loss and fast‐fading models have been proposed to predict the energy consumption metric in static femtocells. In [10], the authors used an M/M/1 queuing model for their analytical study and the Matrix Geometric Method for analyzing the femtocell performance in terms of delay and energy consumption. Similarly, [11] analyze the performance of a limited capacity femtocellular network in terms of blocking probability, delay, and buffer size utilization. They used an M/M/1/K queue and their results assure that the aforementioned metrics are highly dependent on the experienced traffic volumes as well as the buffer size.
On the other hand, simulation techniques provide programming‐based environments to emulate specific parameters in practice while studying the femtocell performance. For example, in [33] simulated a network of varying cells' dimensions. Based on coverage and traffic load parameters, energy consumption was minimized without conceding the quality of service (QoS). They focused on power consumption in five different setups. In the first setup, they assume a femtocellular network instead of the macro one in a region that is fully covered. Under this setup they achieved up to 88% reduction in power consumption. In the second setup, they divided the deployment area into three regions: urban, suburban, and rural. They considered varying mobile users' density and demanded coverage using static femtocells in the urban regions, macrocells in suburban regions, and mobile femtocells in rural regions. Consequently, they achieved up to 80% reduction in power consumption in this setup. In a third setup, femtocells have been allocated to densely populated urban areas, picocells to lightly populated urban regions, microcells to suburban regions, and mobile femtocells to rural regions. Accordingly, the reduction in power consumption rate was about 9%. In the fourth setup, they allocated microcells and femtocells at the borders and macrocells at the remaining parts of the targeted region. The reduction in power consumption was about 5%. In the fifth one, femtocells were allocated at the boundaries of the macrocells, where the radio signal is not enough for making a call. Consequently, a reduction of almost 2% was achieved. Simulation provides fairly precise results, but this approach requires high computation times. Compared to simulation, an analytical modelling technique is computationally more efficient.
Meanwhile, experimental studies (benchmarks) form another technique that aims at performing actual measurements using testbeds in the laboratory or the targeted field. For instance, in the analysis conducted by Bell Labs, the efficiency of a hybrid network of both femtocell and macrocell was practically analyzed [12]. In this validation technique, macrocells were used to assure coverage and femtocells to offload the macrocell traffic. The implementation field was spanning a 10 × 10 km2 urban area, and the population of users was about 200,000. They deployed randomly a varying number of femtocells that can serve up to 8 users in a 10,000 m2 area with 15 W energy consumption. The reason of the higher consumption rate compared to other analyses is that it is an open‐access area. They used continuously the operated macrocells with 2.7 kW energy consumption. The result of this study was dependent on the network usage. When femtocells were used mainly for voice calls, there was no big saving in terms of energy. However, when femtocells were used for data connections, the total energy consumption was reduced by 60%. Another one was performed by Ofcom, a UK telecommunication company [13]. They deployed femtocells to 8 million households, which is nearly 25% of the area of UK. Each femtocell consumed 7 W per day and a total annual energy consumption equal to 490 GWh. They used 30,000 base stations in order to provide the full coverage. Their results conclude that it takes 40 times more energy to deliver a signal to an indoor user from the macrocell compared to the femtocell. As a result, in order to provide the same coverage provided by femtocells, the total annual energy consumption of a macrocell was about 700 GWh per operator. Thus the ratio of energy consumption in order to provide the same indoor coverage in the UK was 7:1 over using macrocells. Moreover, [34] have used benchmarking for the performance evaluation of the femtocell networks. They propose a resource management algorithm to address this problem and study the system performance by experimental work/test‐beds. Results from this experimental work show that the proposed algorithm can significantly improve performance compared to the randomized placement algorithms. Furthermore, the use of femtocells for medical issues in moving vehicles such as the ambulance has been practically studied in [35]. A femtocellular BS is placed inside the ambulance. Data are transmitted/received to/from the backhaul macrocellular network through a transceiver installed on the roof of the ambulance in which it is connected to FBS by the wired network. The obtained results presented reveal that significant performance advantages in terms of packet loss, throughput, and delay are achieved by the use of femtocells in comparison to the macrocellular‐based networks. The main problem associated with use of testbeds in practice is the difficulty in extrapolation of obtained results to various scenarios in terms of cost, time, and efforts [15].
All these validation techniques—analytical, simulation, and experimental ones—vary in the targeted performance metrics, including the average resource utilization, the average number of user equipment in the system, the average power consumption, the average waiting time, throughput, etc. However, all of them can be categorized into either static or dynamic techniques. By static and dynamic techniques, we refer to systems with/without mobile femtocells. In static models such as the ones presented in [18], performance characteristics of cellular networks have been investigated without considering mobility, and thus we call them static systems. Unlike static models, in the dynamic models, mobility is considered as one of the utmost important issues in assessing the grid performance [22].
7.2.1 Static Validation Techniques
In static techniques, FBSs are mostly deployed in indoor environments such as an office, shopping mall, or a smart home to enhance the indoor coverage and improve users' experience. In the literature, several studies have been proposed to analyze and evaluate the performance of typical femtocells in such static setups. For example, in [17], proposed a simple analytical model to predict a static FBS power consumption based on specific traffic load. They assumed only one femtocell that supports up to four simultaneous channels to predict energy consumption of voice and FTP messages. However, radio energy consumption was neglected while performing specific communication setups such as the downlink transmissions. In [8], authors investigated the energy consumption of a Wi‐Fi network on a university campus. A simple queuing model is used to save energy in Wi‐Fi by considering sleep modes for the femtocell according to user demands. Presented results show that by using sleep modes for the femtocell, a considerable amount of power consumption was saved with small number of connected users. The authors in [19] analyze the behavior of static femtocells while applying adaptive modulation and coding techniques with sleep modes using queuing theory. They are interested in evaluating energy consumption rates per packet, average delays, and packet loss. Furthermore, in [20], an admission control problem in an LTE radio network is addressed. The authors proposed a model for two video services: video conferencing and video on demand. Teletraffic and queuing theories are applied to obtain a recursive algorithm in order to assess the system performance using different metrics such as blocking probabilities and the average system throughput. However, and with the rapid increase in demanding coverage and bandwidth everywhere, mobile femtocells deployments and validation techniques are of utmost importance in providing green systems.
7.2.2 Dynamic Validation Techniques
Several attempts have been made toward realizing femtocell‐based HetNets in the literature. However, among the most significant issues in performance evaluation of such HetNets is the mobility factor. The authors [22] propose the idea of deploying FBSs in moving vehicles in order to improve the uplink throughput for mobile users. Results show that mobile FBSs can enhance the QoS and maintain an acceptable level of signal strength. In [23], proposed seamless multimedia service for mobile user equipment (UE) travelling in high‐speed trains by deploying FBSs onboard. The onboard FBSs communicate with macrocells to facilitate the seamless handover. In [24], an integrated cellular/Wi‐Fi system is modelled for high mobility using a two‐phase open queuing system with guard channel and buffering to obtain acceptable levels of QoS in heterogeneous environments. An exact analytical approach of the targeted system is given using the spectral expansion method that can be useful for vertical handover decision management. Similarly, authors in [25] model an integrated cellular/Wi‐Fi HetNet in order to study specific performance characteristics such as the average queue length, throughput, and blocking probability. The FBS system is demonstrated as a two‐phase open queuing network, and the exact solution is presented using the spectral expansion method. Authors in [26] propose a load‐balancing scheme based on the experienced handover performance and dropped call rate while varying the number of user equipment (UE) and their corresponding mobility speeds. This approach demands FBSs, which are typically positioned in multiple macrocells based on the velocity of the UE while considering the number of UE per femtocell. The handover process is determined by using a simulation‐based technique. In [27], authors propose an effective mobile femtocell application for power‐saving purposes in cellular networks. In this application, the signal‐to‐noise‐plus‐interference ratio is enhanced in comparison to traditional schemes. The base station failure probability and energy consumption in the overall network have been analyzed. However, other QoS metrics such as the average delay and packet loss/retransmission have been ignored. In [28], heterogeneous networks and the smart grid are jointly studied to improve the power consumption. The authors formulate the decision problems of the power allocation, electricity, and interference price as a three‐level Stackelberg game. Then, they use a homogeneous Bertrand game to model the price decisions. Simulation results show that their proposed grid‐based approach can considerably reduce operational costs and CO2 emissions. In [29], a mobility extrapolation approach based on users' trajectories is proposed. It considers the received signal quality with mixed real‐time (RT) and non‐RT traffic model. Via simulation results, the authors reveal that the proposed scheme has clearly reduced delay by 29%, and maintained the desired QoS. However, it doesn't provide a closed analytical form for performality analysis while considering other metrics such as system throughput and number of users per cell. In [30], handover approaches considering the signal strength and users' velocities are proposed. Different handover approaches have been simulated and deliberated. Simulation results show that the proposed approaches can obviously eliminate unnecessary handovers compared with conventional soft handover at the same signal level. However, delay and cost metrics have been neglected. In [31], a modified signaling procedure for the mobile user in a gateway‐based femtocell architecture is proposed. A new handover approach based on the user's speed and required QoS is proposed. The comparison between the proposed approach and traditional handover approaches shows that the approach proposed in [31] performs better in reducing the unnecessary handovers. In [40], mobile wireless cellular networks are modelled using a Markov reward model, where multiple channels per cell in homogeneous systems are considered. Performance characteristics of the system such as mean queue length and blocking probability are presented using an analytical model. Moreover, two different handoff schemes with/without preemptive priority procedures for heterogeneous mobile networks are proposed and analyzed in [36]. A 3‐D Markov chain is used to model the system and analyze the HetNet performance in terms of average delay, blocking probability, and the probability of forced termination [42]. The following table further summarizes the comparisons between the aforementioned studies.
Nevertheless, existing research efforts, as depicted in Table 7.1, do not assess the performance gains of green small cells in a systematic closed framework (analytical, test‐bed, and simulation based) that can adapt to varying design factors in practice (e.g., energy, mobility, throughput, delay, etc.) [21]. A measureable performance analysis of such gain is definitely needed nowadays for better energy utilization and more green applications. And hence, the work in this chapter is proposed. Particularly, we consider the different velocity effect of mobile femtocells while applied in typical applications such as the smart grid. For more practicality, we specifically considered the e‐mobility project led by Siemens as a use‐case study [37]. Femtocells' base‐stations (FBSs) [37] are designed to be static/mobile stations on buses, taxis, trains, etc., over the electric grid of a city to provide better coverage and capacity to dramatically increasing mobile users while saving their energy. In fact, e‐mobility represents the concept of using electric powertrain technologies, in‐vehicle information, and communication technologies and connected infrastructures to enable the electric propulsion of vehicles and fleets. It is motivated by the need to address corporate fuel efficiency and emission requirements, as well as market demands for lower operational costs [37]. It aims at reducing CO2 emissions by promoting public and green transport choices. This can ultimately lead to green transportation, which means any eco‐friendly transport practice or vehicle that does not have any negative impact on the environment. Accordingly, electrical vehicles/trains have been used in this case study, where they rely heavily on the mobile FBSs in exchanging their energy status during the day in addition to tracking massive counts of smart home appliances. And thus, a careful FBS traffic load study is indeed required. In this study, we propose a green HetNet framework that can analyze the above mentioned performance metrics in presence of service interrupt due to mobile FBSs departures from the neighborhood of the UEs.
Table 7.1 A Summary of the Aforementioned Related Works in the Literature.
| Ref. | MQL | Through put | Energy | Mobility | Delay | Analy tical | Simu lation | Test‐ bed | Application |
| [8] | ‐ | ‐ | √ | ‐ | √ | √ | ‐ | √ | Univ. campus (outdoor) |
| [20] | √ | √ | √ | ‐ | ‐ | √ | ‐ | ‐ | Video streaming (outdoor) |
| [27, 30] | ‐ | ‐ | √ | √ | √ | √ | √ | ‐ | Transportations (outdoor) |
| [31, 40] | √ | √ | ‐ | √ | ‐ | ‐ | √ | ‐ | Transportations (outdoor) |
| [6, 24, 25] | √ | √ | ‐ | √ | √ | √ | ‐ | ‐ | Transportations (outdoor) |
| [22, 23] | ‐ | √ | ‐ | √ | ‐ | √ | √ | ‐ | Transportation/ multimedia (outdoor) |
| [34] | ‐ | ‐ | √ | ‐ | √ | ‐ | ‐ | √ | Office/home (indoor) |
| [35, 37] | ‐ | ‐ | √ | ‐ | √ | ‐ | ‐ | √ | Transportations (outdoor) |
| [26, 29] | ‐ | ‐ | √ | √ | ‐ | ‐ | √ | ‐ | Real‐time/ transportations (outdoor) |
| [28] | ‐ | ‐ | √ | √ | ‐ | ‐ | √ | ‐ | Electricity pricing (indoor) |
7.3. System Models
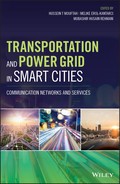
This section presents the proposed model for the performance assessment of a green HetNet composed of multiple macrocells and mobile FBSs. As shown in Figure 7.1, a set of mobile femtocells are deployed inside the coverage area of the macrocells. The considered network comes with a wireless transmission link via Wi‐Fi and other interfaces to the Internet backhaul in an urban area with multiple macro base stations (macroBSs). Each macroBS serves mobile users in the circular macrocell of the figure. We also consider a set of N mobile FBSs deployed in public transportation vehicles (e.g., buses) to provide onboard coverage, and offload data traffic created by UEs in the vicinity of a FBS. The buses move in an urban city, with varying velocities. Mobile FBSs' received signal strength indicators (RSSI) is the triggering condition for an offload operation from the macrocell BS. As in any cellular network, UEs should communicate with the base station that has the highest RSSI. Therefore, when a UEi enters the bus, it will sense the mobile FBS's high RSSI, due to the short distance between the UE and the mobile FBS. Then, the UEi will report the mobile FBS's RSSI to the serving macro BS and send a request to be offloaded.
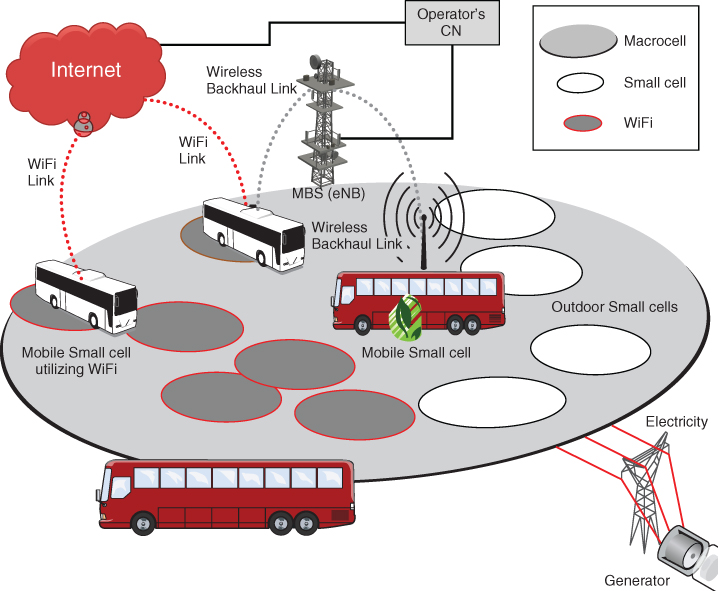
Figure 7.1 A typical grid‐based HetNet and a set of mobile FBSs in e‐mobility.
The system is modeled as an M/M/N/L queuing system in Figure 7.22. There are N identical channels available in a multi‐interface FBS, where each FBS comes nowadays with different communication standards, such as Bluetooth, Wi‐Fi, Ethernet, etc. Requests are assumed to arrive independently following a Poisson distribution process as in [38]. When the femtocell channels are all busy, the incoming user requests are buffered and form a queue of size W. The symbols used in this work are briefed in Table 7.2.
Table 7.2 Summary of Symbols.
| Symbol | Definition |
| r | radius of the femtocell |
| V | velocity of the mobile users |
| P | perimeter of the femtocell |
| A | area of the femtocell |
| N | total number of channels in the FBS |
| W | queue capacity of the cell |
| L | maximum number of requests in the cell |
|
|
total arrival rate of requests in the cell |
| μ | total service rate of completed requests in the cell |
| μp | average service rate of UE requests in the cell |
|
|
departure rate of a mobile FBS deployed on a vehicle. |
| μv | mean arrival rate of a mobile FBS deployed on a vehicle. |
| M | number of mobile FBS in the system. |
In this work, not only the FBS is mobile, but also users can move to neighboring cells while they are being served in the grid system. It is typical in HetNet systems to experience some FBSs' departures due to many different reasons including load balance and/or energy saving. These departures and unavailability of an FBS may degrade the performance of the grid. It is assumed that a single FBS arrival is available for every FBS departure, to replace the departed FBS. Similar to the previous attempts [6, 22], each macrocell is a circle with radius R and is served by a base station placed at the center. The femtocells, which are deployed within the coverage area of a macrocell, are assumed to be circular with radius r and are served by femtocell base stations (FBSs).
7.3.1 Markov Model
In order to satisfy energy requirements for HetNets applications, a Markov discrete‐time stochastic process M/M/N/L queuing model is assumed. The queuing capacity of the system is denoted by W as we mentioned, and L represents the maximum capacity, which includes the number of FBSs in the system (M), and thus, L = M × (W + N). Similar to [38–41], arrivals to the system are assumed to follow a Poisson distribution with rate ![]() p , and the service time of the FBS is exponentially distributed with rate
μ
. Our system is proposed under a realistic assumption of a mobile FBS queue that can hold waiting requests as long as they are within the required communication range. Mobile FBS may move and thus user requests will handover to neighboring cells with rate μp
while they are either in the queue or being served in the system. The departure rate of the FBS is assumed to be exponentially distributed and is denoted by
p , and the service time of the FBS is exponentially distributed with rate
μ
. Our system is proposed under a realistic assumption of a mobile FBS queue that can hold waiting requests as long as they are within the required communication range. Mobile FBS may move and thus user requests will handover to neighboring cells with rate μp
while they are either in the queue or being served in the system. The departure rate of the FBS is assumed to be exponentially distributed and is denoted by ![]() v
[38]. Following the departure, the departed FBS is replaced by an arriving one with arrival rate
μv
with exponential distribution. Figure 7.2 represents our FBS queuing system under this study.
v
[38]. Following the departure, the departed FBS is replaced by an arriving one with arrival rate
μv
with exponential distribution. Figure 7.2 represents our FBS queuing system under this study.
7.3.2 Service‐Rate Model
According to [14], the dwell time of a mobile FBS is the time that the mobile node spends in a given system. The dwell time is assumed to have an exponential distribution with a mean rate
μp
. And thus, the service rate due to mobility can be calculated as ![]() , where E[v] is the average expected velocity of the mobile femtocell, and P and A are the length of the perimeter of the macrocell and area of the macrocell, respectively.
, where E[v] is the average expected velocity of the mobile femtocell, and P and A are the length of the perimeter of the macrocell and area of the macrocell, respectively.
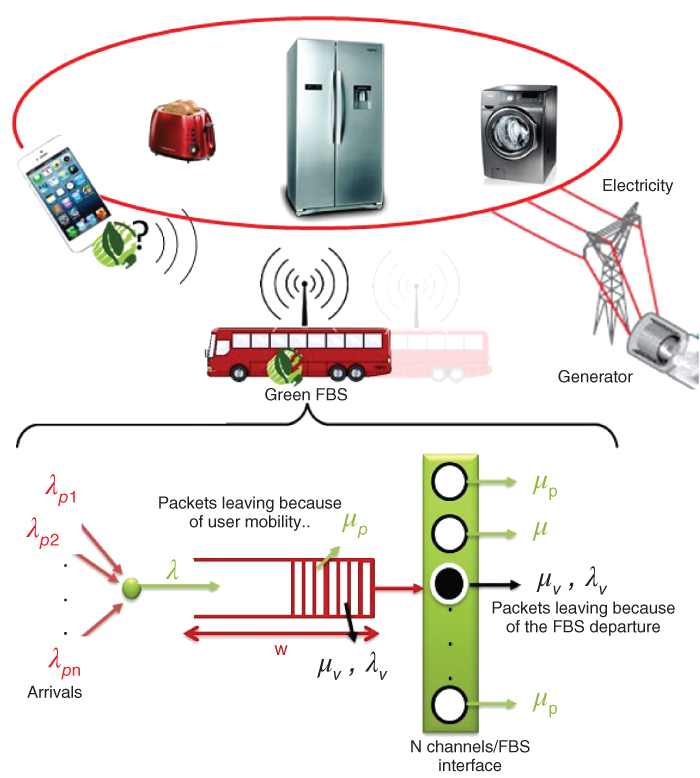
Figure 7.2 The queuing system considered with FBS departures and arrivals.
7.3.3. Communication Model
Typically, the signal level at a distance ![]() from the transmitter depends on the surrounding environment and obstacles. This signal strength can be captured through what we call a log‐normal path‐loss model. According to this model, the received signal power (Pr
) at the distance
from the transmitter depends on the surrounding environment and obstacles. This signal strength can be captured through what we call a log‐normal path‐loss model. According to this model, the received signal power (Pr
) at the distance ![]() follows a log‐normal distribution centered on the average power value [18, 44]. This can be formulated as follows:
follows a log‐normal distribution centered on the average power value [18, 44]. This can be formulated as follows:
where d is the distance in km between the center of a candidate UE and its associate FBS, ![]() is a Gaussian distributed random variable with zero mean and variance
is a Gaussian distributed random variable with zero mean and variance ![]() , i.e.
, i.e. ![]() is the path loss exponent calculated based on experimental data, and K0
is a constant calculated according to the average heights of the transmitter and receiver. Hence, the achievable throughput at each FBS site can be approximated using Shannon's capacity equation with an SNR clipping at 20dB for practical modulation as follows:
is the path loss exponent calculated based on experimental data, and K0
is a constant calculated according to the average heights of the transmitter and receiver. Hence, the achievable throughput at each FBS site can be approximated using Shannon's capacity equation with an SNR clipping at 20dB for practical modulation as follows:
where ![]() is the data rate at UEi
, B is the FBS bandwidth,
is the data rate at UEi
, B is the FBS bandwidth, ![]() , which is computed based on Equation (7.1) is the received power at candidate femtocell i, and N
0 is the background noise power spectral density.
, which is computed based on Equation (7.1) is the received power at candidate femtocell i, and N
0 is the background noise power spectral density.

Figure 7.3 A finite state diagram for the HetNet system. It describes all the FBSs' states and their transitions in a smart grid setup where not only users are mobile but also the FBS itself.
7.4 The Green HetNet (GHetNet) Framework
The green HetNet (GHetNet) framework not only assesses the performance of the grid but also can enable the smart grid operators to offload a portion of the data traffic from the overburdened macrocells to the mobile FBSs installed on top of public transportation buses and trains. The mobile FBS is usually connected to an energy‐limited source and multiple transmitters' interfaces including Wi‐Fi, Bluetooth, 4G, etc. This multi‐interface transmitter provides the backhaul for the mobile FBS. Accordingly, our GHetNet framework is composed of four main entities: UEs, mobile FBSs, macro‐BSs, and the multi‐interface transmitters.
- UE: a handheld device and/or home appliance that has a cellular/Wi‐Fi interface in order to connect to the grid backhaul network.
- Mobile FBS: an enterprise FBS that can serve up to N users, simultaneously. It is registered and preconfigured in all ubiquitously accessible access points to the backhaul.
- Macro‐BS: a regular existing macro‐BS in the city; there are usually more than one.
- Multi‐interface transmitter: a multiple I/O module that is integrated with the FBS circuit and installed together on the roof of the public transportation vehicle.
These components are utilized by the GHetNet framework in four key phases: (1) trigger phase, (2) classify phase, (3) decide phase, and (4) offload phase. In the trigger phase, once a UE enters the coverage of a mobile FBS, a trigger to offload its traffic from the macro‐BS is initiated based on the mobile FBS's signal strength (i.e., the RSSI). When the trigger condition is fulfilled, the UE sends a request to be accepted by the mobile FBS. In the classify phase, the serving macro‐BS receives the request of the UE and checks its feasibility, which can be determined by the current MQL, throughput, and experienced energy consumption of the system. In our framework, we define a number of user classes ![]() , where Cm has the highest importance in C. For example, a user who can experience the best in terms of throughput and delay if it has been offloaded from the macro‐BS to the mobile FBS will be given the highest‐class, Cm. In the decide phase, after the mobile FBS receives the candidate UE, it compares against other received candidates to be offloaded from the macro‐BS based on three main metrics: the present MQL, the instantaneous throughput of the FBS, and the average energy consumed per packet. Once these metrics are checked, the mobile FBS can accept the most appropriate candidate and inform the macro‐BS. Finally, in the offload phase, the macro‐BS will transfer the accepted candidate to the mobile FBS and update the grid system. There are some scenarios where the Wi‐Fi coverage is not sufficient or the signal strength degrades below a certain threshold. In such scenarios, the mobile FBS can use any other communication interface it has to continue. This system can be considered in Q‐theory as a two‐dimensional Markov process on a finite lattice strip, as shown in Figure 7.3. The Markov chain is denoted by
, where Cm has the highest importance in C. For example, a user who can experience the best in terms of throughput and delay if it has been offloaded from the macro‐BS to the mobile FBS will be given the highest‐class, Cm. In the decide phase, after the mobile FBS receives the candidate UE, it compares against other received candidates to be offloaded from the macro‐BS based on three main metrics: the present MQL, the instantaneous throughput of the FBS, and the average energy consumed per packet. Once these metrics are checked, the mobile FBS can accept the most appropriate candidate and inform the macro‐BS. Finally, in the offload phase, the macro‐BS will transfer the accepted candidate to the mobile FBS and update the grid system. There are some scenarios where the Wi‐Fi coverage is not sufficient or the signal strength degrades below a certain threshold. In such scenarios, the mobile FBS can use any other communication interface it has to continue. This system can be considered in Q‐theory as a two‐dimensional Markov process on a finite lattice strip, as shown in Figure 7.3. The Markov chain is denoted by ![]() and is used for performance assessment of the considered HetNet system in this chapter. We assume Z is irreducible1 with a state space of
and is used for performance assessment of the considered HetNet system in this chapter. We assume Z is irreducible1 with a state space of ![]() . Furthermore, we assume that the number of channels in an FBS, P(t),is represented in the horizontal direction, and the total number of UE candidates, V(t), is represented in the vertical direction of a finite lattice strip. In this study, an spectral expansion approach can be employed, where A is the matrix of purely horizontal transitions with zeros on the main diagonal, and one‐step upward and one‐step downward transitions are represented in matrices B and C, respectively.
. Furthermore, we assume that the number of channels in an FBS, P(t),is represented in the horizontal direction, and the total number of UE candidates, V(t), is represented in the vertical direction of a finite lattice strip. In this study, an spectral expansion approach can be employed, where A is the matrix of purely horizontal transitions with zeros on the main diagonal, and one‐step upward and one‐step downward transitions are represented in matrices B and C, respectively.
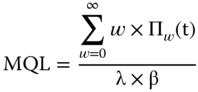
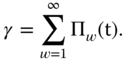
Consequently, the state probabilities in Theorem 7.1 can be used in computing important performance measures such as delay and throughput (γ). According to the probability distribution of the proposed Markov chain, the mean queue length (or MQL) of the admitted packets can be calculated directly from Little's law by
and the FBS throughput to be
Furthermore, the energy consumed by the proposed green HetNet system can be found based on the assumed Markov chain while considering the aforementioned path‐loss model in Equation (7.1). Let us assume that every FBS node in the grid has the following four key power transition states: idle, transmit, receive, and sleep, which can be represented by PTX, PRX, Pidle, and Psleep, respectively. Furthermore, Ptotal is defined as the total power spent for all these power states during the FBS operational lifetime. Accordingly,

where PktLength
represents the received packet length, and Pamp
is the amplifier power denoted by 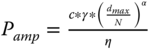 , where η is a performance parameter in the RF amplifier, γ is the sufficient RSSI level, R indicates the data packet transmission rate, dmax
is the total distance between the UE and the FBS, and c is a constant value proportional to the packet length, channel attenuation, and nonlinear effects of the power amplifier. Accordingly, the total energy consumption during the FBS operational period varies according to which status it will be at. Please note that the FBS might be transmitting a packet with a successful transmission probability according to the steady state of the Markovian model. Also, the FBS might be in a receive mode, receiving a packet successfully with a varying probability based on the embedded path‐loss model instead of a random selection. Because of the queue overflow, the FBS may fail to receive the packet; and thus, it should go into an idle mode. Consequently, the expected energy consumption for a multi‐interface FBS can be expressed as follows:
, where η is a performance parameter in the RF amplifier, γ is the sufficient RSSI level, R indicates the data packet transmission rate, dmax
is the total distance between the UE and the FBS, and c is a constant value proportional to the packet length, channel attenuation, and nonlinear effects of the power amplifier. Accordingly, the total energy consumption during the FBS operational period varies according to which status it will be at. Please note that the FBS might be transmitting a packet with a successful transmission probability according to the steady state of the Markovian model. Also, the FBS might be in a receive mode, receiving a packet successfully with a varying probability based on the embedded path‐loss model instead of a random selection. Because of the queue overflow, the FBS may fail to receive the packet; and thus, it should go into an idle mode. Consequently, the expected energy consumption for a multi‐interface FBS can be expressed as follows:

and thus, the energy consumption of a successful communication between the UE and the FBS is given by
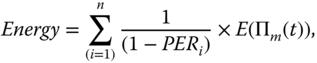
where PERi is the packet error rate at the i‐th FBS in the grid.
7.5 A Case Study: E‐Mobility for Smart Grids
E‐mobility is a real‐case scenario for applied mobile FBS in a smart grid to optimize the electricity usage in the grid while experiencing peak demands [37]. Electrical cars in this project are relying on mobile FBS in exchanging their energy status during the day in addition to other smart home appliances, and thus, heavy data traffic is expected to be generated. In such a comprehensive mobile HetNet model, an energy‐aware design and validation framework is a must for more optimized femtocells' usage in serving the vast incoming requests per time unit. This framework shall be able to overcome defies related to users' mobility as well as FBSs' departures and/or arrivals. Hence, we testify our proposed GNetNet framework in analyzing and improving QoS‐related metrics under real‐world conditions and setups in the grid application. In this use case study, we assume mobile energy‐hungry UEs, which can be static/mobile commuting in outdoor public transportation systems. FBSs can be static/fixed on the road infrastructure or mobile on top of the roof of a public bus as shown in Figure 7.4. Typically, UEs are presumed to be equally distributed in the city under their serving cell coverage. For more realistic studies, we embrace typical LTE‐values that have been used in [43], as depicted in Tables 7.3 and 7.4.
Table 7.3 Specifications of a Femtocell Base Station parameters [[43]].
| Parameter | Value |
| P (mW) | 20 |
| BW (MHz) | 5 |
| N0 (W/Hz) | 4 × 10⁻²¹ |
| pmp (W) | 3.2 |
| pFPGA (W) | 4.7 |
| ptrans (W) | 1.7 |
| Pamp (W) | 2.4 |
Table 7.4 Components of the considered use‐case scenario [[43]].
| HetNet component | Value |
| FBS radius (m) | 30 |
| FBS velocity (km/hr) | low, medium, high |
| FBS channels | 8 |
| Expected departure rate per hour ( |
0.001 |
| Expected service rate per hour (μ) | 200 |
| Expected arrival rate per hour (μv) | 0.5 |
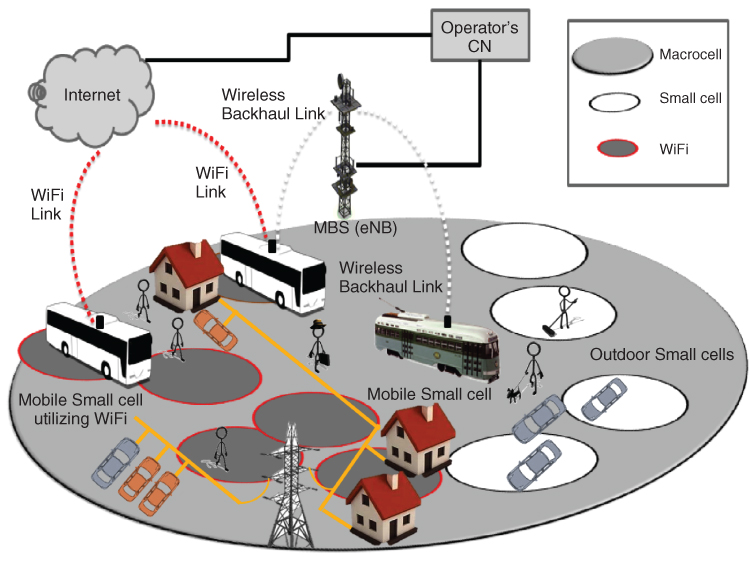
Figure 7.4 Mobile FBS serving mobile/static users in a smart grid setup.
7.5.1 Performance metrics and parameters
In order to assess our proposed GHetNet framework, we consider the following performance metrics:
- Energy (E): is the average power consumption rate per packet as a meter for the grid energy saving. This metric is chosen to evaluate the core infrastructure of the grid in terms of the amount of energy consumed by FBSs. This metric is measured in joules.
- Throughput (γ): is the average percentage of successfully received packets from the FBS. This metric has been chosen to reflect the effectiveness of the proposed GHetNet framework in the grid and is set here as a quality metric. It is measured in packets per hour “pkts/h.”
- Response time (R): is the average time a UE request is experiencing from arrival until the departure from the FBS and is measured in seconds. It plays a significant role in performance evaluation since it incorporates all the delays involved per UE request.
These metrics are assessed while varying the following system parameters:
- Mobile FBS velocity: is the average experienced speed per FBS while it moves in the grid system. It can be either: (i) low speed, between 0 and 15 km/h, (ii) medium speed, between 15 and 40 km/h, and (iii) high speed, above 40 km/h.
- MQL: is the average queue length per FBS in the grid. It is measured in “packets,” and it represents the experienced delay in an FBS.
- Arrival rate (
 p): is the number of packet arrivals per time unit. It is used to reflect the effect of different traffic loads on the grid performance. It is measured in packets per hour “pkts/h.”
 - Service rate (μ): is the rate of packets served per FBS equipped with multiple communication interfaces. It is measured in number of served users per hour “user/h”.
7.5.2 Simulation Setups and Baselines
In this section, we simulate randomly generated heterogeneous networks to represent the targeted smart grid environment using MATLAB and Simulink 8.7. A discrete event simulator is built on top of these MATLAB platforms. Our Simulink simulator supports multiple wireless channels per FBS, users' mobility, and FBSs' departures. Based on experimental measurements taken in a site of dense heterogeneous nodes [[43]], we adopt the signal propagation model described in Section 7.3, where we set the path‐loss model variables as shown in Table 7.5.
Table 7.5 Parameters of the Simulated Networks.
| Parameter | Value |
|
|
4.8 |
|
|
10 |
| K0 | 42.152 |
| r | 30 m |
As for the baselines, we consider two related femtocell‐based approaches in the literature, namely the FemtoWoC [[32]] and the GPowCon approaches [[33]]. The wireless over cable approach for femtocells (FemtoWoC) is projected as a green approach for improving the femtocell energy efficiency. FemtoWoC introduce a novel idle mode energy‐saving procedure to improve the energy efficiency of femtocellular base stations. In [33], a green power consumption (GPowCon) approach is proposed to minimize the average energy consumption based on traffic and coverage parameters. Both of them aim at assessing and improving the femtocell‐based network performance in terms of energy, and hence, they have been chosen in order to evaluate our proposed GHetNet framework. The simulation results obtained from our MATLAB code are presented comparatively with the analytical results from our queue model and validated to reflect the performance of the actual system.
7.5.3 Results and Discussion
Obtained results for the proposed GHetNet framework are divided into two parts in this section. First, we discuss the impact of mobility‐speed factors on an FBS performance in terms of the response time, throughput, and queue length. Second, the impact of traffic load on the FBS energy consumption is considered. Please note that our achieved simulation results are within the confidence interval of 5% with a confidence level of 95%.
7.5.3.1 The Impact of Velocity on FBS Performance
In this subsection, performance metrics of the femtocell‐based grid system are compared under three different velocities, namely the low, medium, and high velocity, while varying the arrival rate (![]() p) from 3500 to 6000 users/h. Consequently, Figure 7.5 shows the effect of the mobile FBS velocity on the mean queue length for various arrival rates. It is clear from the figure that when the system is congested, the mean queue length will also grow. This is due to the increasing service demands from the FBS, simultaneously. As the mobile FBS moves quicker, the mean queue length decreases. This is due to the fact that the service rate, μp
, is directly proportional to the expected velocity of mobile FBS. Therefore, as the velocity increases, users' requests will leave the FBS queue sooner, and the mean queue length will decrease. For instance, when the arrival rate
p) from 3500 to 6000 users/h. Consequently, Figure 7.5 shows the effect of the mobile FBS velocity on the mean queue length for various arrival rates. It is clear from the figure that when the system is congested, the mean queue length will also grow. This is due to the increasing service demands from the FBS, simultaneously. As the mobile FBS moves quicker, the mean queue length decreases. This is due to the fact that the service rate, μp
, is directly proportional to the expected velocity of mobile FBS. Therefore, as the velocity increases, users' requests will leave the FBS queue sooner, and the mean queue length will decrease. For instance, when the arrival rate ![]() p is equal to 6000, the mean queue length is very close to the assumed queue size at velocity of 3 km/h. However, when the mobile FBS starts moving faster at a speed of 60 km/h, the average queue length is equal to 7 packets.
p is equal to 6000, the mean queue length is very close to the assumed queue size at velocity of 3 km/h. However, when the mobile FBS starts moving faster at a speed of 60 km/h, the average queue length is equal to 7 packets.
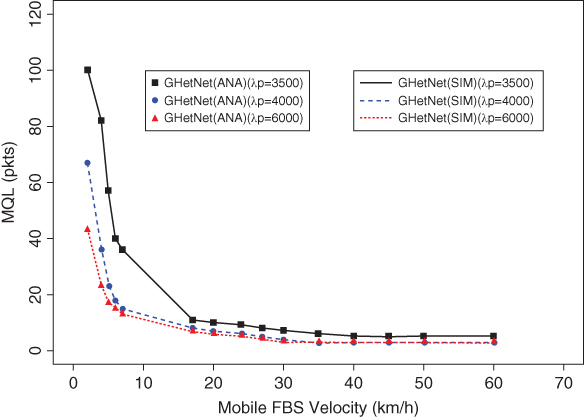
Figure 7.5 The effect of FBS velocity on MQL.
In Figure 7.6, we assume the same setups as the one used in Figure 7.5. It compares throughput of the system versus the average FBS velocity while varying the arrival rate parameter (![]() p). As expected, when the arrival rate increases, more packets are served, and thus, throughput increases accordingly. It has been also observed that as the mobile FBS moves faster, the system throughput decreases. This can be due to the increasing number of removed UE requests from the mobile FBS queue when the velocity increases and the FBS moves faster. And hence, the number of served packets will decrease, and throughput will decrease as well. In order to validate our GHetNet framework, analytical results as well as simulation results have been presented comparatively for both figures: Figure 7.5 and Figure 7.6. The maximum discrepancies between them are 1.96% and 0.07% for Figure 7.5 and Figure 7.6, respectively. Both are less than the aforementioned confidence interval of 5%.
p). As expected, when the arrival rate increases, more packets are served, and thus, throughput increases accordingly. It has been also observed that as the mobile FBS moves faster, the system throughput decreases. This can be due to the increasing number of removed UE requests from the mobile FBS queue when the velocity increases and the FBS moves faster. And hence, the number of served packets will decrease, and throughput will decrease as well. In order to validate our GHetNet framework, analytical results as well as simulation results have been presented comparatively for both figures: Figure 7.5 and Figure 7.6. The maximum discrepancies between them are 1.96% and 0.07% for Figure 7.5 and Figure 7.6, respectively. Both are less than the aforementioned confidence interval of 5%.

Figure 7.6 The effect of velocity of mobile users on throughput.

Figure 7.7 The effect of the FBS velocity on response time.
In Figure 7.7, the effects of mobile FBS velocity on the response time are shown. Obviously, the arrival rate is the most effective factor that influences the response time while experiencing low velocities. As the velocity increases, the main factor affecting response time will be the speed value since the departure of incoming user packets becomes considerably higher than the arrival rate. Consequently, for medium and high speeds, arrival rate does not affect significantly the response time, as depicted in Figure 7.7.
7.5.3.2 The Impact of the Grid Load on Energy Consumption
Generally, when d ≤ R a single communication interface is considered to be more energy efficient. Especially while experiencing low path‐loss exponents, the communication channel condition is close to the perfect value of required SNR. The assumed reduction in energy consumption is considered a vital issue and should be utilized in terms of reducing the power overhead via the GHetNet framework, where FBSs can be placed everywhere to provide a multi‐interface communication in connecting heterogeneous nodes, e.g., sensors, PDAs, and tablets. And thus, an FBS with multiple communication channels can dramatically decrease the power consumption of the grid. For example, in Figure 7.8, we observe the amount of energy consumed while the queue length of the mobile FBS is increasing. Obviously, the increment in the queue length causes undesired exponential energy increase.

Figure 7.8 Energy spent per hour vs. the average MQL.
And thus, more attention shall be given for the queue length in HetNets. Consequently, we consider the MQL factor in our proposed GHetNet, and thus, unnecessary energy waste has been avoided in comparison to other alternatives in the literature such as the FemtoWoC. Meanwhile, the GPowCon approach consumes less amount of energy per hour due to ignoring the QoS requirements (e.g., delay and throughput) that have been set as mandatory constraints by GHetNet and FemtoWoC. In general, there was a steady increase in the energy spend per hour in all categories, which supports the validity of the proposed GHetNet framework. Moreover, it verifies the GHetNet accuracy in predicting/measuring the energy consumption amounts.
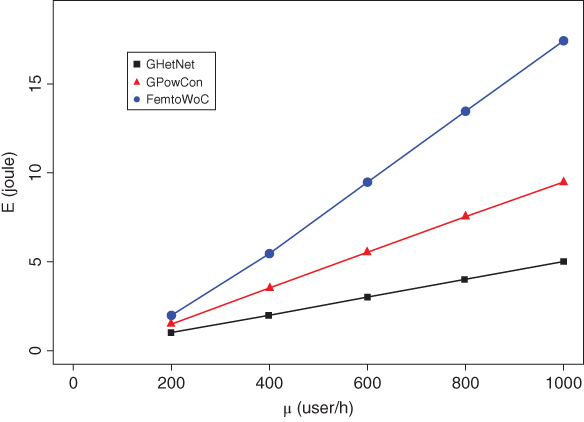
Figure 7.9 Energy spent per hour vs. the average service rate μ.
In Figure 7.9, we further position the proposed GHetNet framework against the other two alternatives in terms of energy while varying the average service rate per user. This figure studies the effect of the FBS users' density against energy consumption as well. The service rate μ is used to reflect the traffic load in the vicinity of an FBS. In general, we observe a linear increase of energy spend per hour in all the categories, where the highest energy consumption trend is recorded by the FemtoWoC approach again, followed by GPowCon, and the lowest by GHetNet. FBSs in FemtoWoC completely switch off their radio transmitters and related processing when they are not considered in an active call. This necessitates further processing and energy consumption when the FBSs wakeup. We generally notice that even with relatively large increments in user/arrivals counts, the FBS energy consumption is not that much affected. This can be returned to the careful consideration of the average service time factor in our Markov‐based framework while considering the mobile FBS departures. Unlike the effect of MQL, number of served users can barely affect the consumed FBS energy. This can be returned to the mobility factor, where a great portion of these arrivals are leaving the queue due to communication range conditions.

Figure 7.10 Response time and energy consumed as a function of the service rate.
Moreover, we show the effect of the service rate (μ) on the response time (R) and the expected energy consumption of the incoming packets per hour in Figure 7.10. At μ equal to 100, the expected energy consumption is ∼0.53 joules per hour. As the service rate increases, the response time starts to decrease, and at the same time more energy is consumed. For instance, when μ is equal to 1000, the response time is equal to 5.4 seconds, which is ∼60 times less than the energy consumed once μ is equal to 100. Using the same figure, we can control as well the optimum service rate at which we can achieve the best response time and energy consumption (e.g., when μ = 300 in Figure 7.10). Figure 7.10 also depicts that there is a trade‐off between the average power consumption and the efficiency of the FBS. Furthermore, the proposed Markov chain can play a key role in specifying the operative space and performance level, as well as the average energy consumption.
7.6 Conclusion
The emerging paradigm of the smart grid is rapidly growing nowadays, intending to improve the quality of our life by connecting vast smart devices, via multiple technologies. Femtocells and heterogeneous networks (HetNets) play a significant role in realizing this vision. In this chapter, a green HetNet consisting of several mobile customers using the smart grid is considered in presence of multiple macrocells and FBSs' departures and arrivals. Accordingly, a new smart grid model is presented in order to validate the usage of mobile FBSs while supporting extreme data traffic in green applications. We believe that the aid of highly available FBSs in such setups in the smart grid will become very important in the coming decades. Furthermore, the obtained results show that traffic load (or UE arrival rate per time unit), the velocity of mobile FBSs, and the multi‐interface FBS are crucial parameters. They play a key role in predicting the best average energy consumed by the grid system. For instance, increasing the users' arrival rate in the femtocell can lead to an increment in the average waiting queue length, throughput, and FBS response time. Moreover, achieved results show that for high and moderate velocity mobile FBSs, traffic load does not significantly affect the response time. Our proposed GHetNet framework can actually provide a threshold on the average energy consumption while maintaining a specific response time. Such a framework can be quite beneficial in specifying the optimum operational conditions in a femtocell‐based grid system.
References
- 1 VNI Mobile Forecast Highlights, 2015–2020, URL: http://www.cisco.com/assets/sol/sp/vni/forecast_highlights_mobile/index.html, 2016.
- 2 Hasan, M.Z. et al., “Optimized Multi‐Constrained Quality‐of‐Service Multipath Routing Approach for Multimedia Sensor Networks”, IEEE Sensors Journal, vol. 17, no. 7, 2017, 2298–2309.
- 3 Bou‐Harb, E., Fachkha, C., Pourzandi, M., Debbabi, M., and Assi, C., ‘Communication security for smart grid distribution networks’, IEEE Communications Magazine, 51(1), 2013, 42–49.
- 4 Al‐Turjman, F., ‘Identification Framework for Smart Environments in the Era of Cloud‐IoT’, in Proc. Of the Inter. Conf. on Internet of Things, Data and Cloud Computing (ICC) , University of Cambridge, United Kingdom, 2017.
- 5 Qutqut, M. et al., ‘Dynamic small cell placement strategies for LTE Heterogeneous Networks’, in Proc . Of the IEEE ISCC , 2014, 1–6.
- 6 Qutqut, M.H. et al ., ‘MFW: Mobile femto‐cells utilizing WiFi: A data offloading framework for cellular networks using mobile femtocells’, in Proc. of the IEEE International Conference on Communications (ICC) , 2013, 6427–6431.
- 7 Al‐Turjman, F., ‘Hybrid Approach for Mobile Couriers Election in Smart‐cities’, in Proc. of the IEEE Local Computer Networks (LCN), Dubai, UAE, 2016, 507–510.
- 8 Haider, F., Wang, C.X., Ai, B., Haas, H., and Hepsaydir, E., ‘Spectral/energy efficiency tradeoff of cellular systems with mobile femtocell deployment’, IEEE Transactions on Vehicular Technology, vol. 65, no.5, 2016, 3389–3400.
- 9 Cao, F. and Fan, Z., ‘The tradeoff between energy efficiency and system performance of femtocell deployment’, in Proc. the IEEE Int. Symposium on Wireless Communication Systems (ISWCS) , 2010, 315–319.
- 10 Kumar, W., Kumar, P., and Halepoto, I., ‘Performance Analysis of an Energy Efficient Femtocell Network Using Queuing Theory’, Mehran University Research Journal of Engineering & Technology, vol. 32, no. 3, 2013, 535–542.
- 11 Kumar, W., Aamir, S., and Qadeer, S., ‘Performance Analysis of a Finite Capacity Femtocell Network’, Mehran University Research Journal of Engineering & Technology, vol. 33, no. 1, 2014, 129–136.
- 12 Feng, Z., Yuexia, Z., ‘Study on smart grid communications system based on new generation wireless technology’, in Proc. of the Int. Conf. on Electronics, Communications and Control (ICECC) , 2011.
- 13 Baines, R. (n.d.). ‘Femtocells ‐ Reducing Power Consumption in Mobile Networks’, Retrieved Dec., 2016, URL: http://www.low‐powerdesign.com/article_baines_092811.html.
- 14 Bolch, G., Greiner, S., de Meer, H., Trivedi, K. S., Queueing Networks and Markov Chains: Modeling and Performance Evaluation with Computer Science Applications, John Wiley & Sons, 2006.
- 15 Hasan, M.Z. et al., ‘A Survey on Multipath Routing Protocols for QoS Assurances in Real‐Time Multimedia Wireless Sensor Networks’, IEEE Communications Surveys and Tutorials, 2017, doi: 10.1109/COMST.2017.2661201.
- 16 Next Generation Mobile Networks (NGMN), ‘NGMN radio access performance evaluation methodology,’ Jan. 2008, URL: http://www.ngmn.org/uploads/media/NGMN Radio Access Performance Evaluation Methodology.pdf.
- 17 Riggio, R. and Leith, D. J., “A measurement‐based model of energy consumption in femtocells”, IFIP Wireless Days , 2012.
- 18 Al‐Turjman, F., ‘Information‐centric sensor networks for cognitive IoT: an overview’, Annals of Telecommunications, 2016 1–16.
- 19 Gong, J., Zhou, S., Niu, Z., ‘Queuing on energy‐efficient wireless transmissions with adaptive modulation and coding’, in Proc. Of the IEEE Int. Conf. on Communications (ICC), 2011, 1–5.
- 20 Borodakiy, V.Y. et al., ‘Modelling and performance analysis of pre‐emption based radio admission control scheme for video conferencing over LTE’, in Proc. of the ITU Kaleidoscope Academic Conference on Living in a converged world‐Impossible without standards, 2014, 53–59.
- 21 Al‐Turjman, F., ‘Cognitive Routing Protocol for Disaster‐inspired Internet of Things’, Elsevier Future Generation Computer Systems, 2017, doi: 10.1016/j.future.2017.03.014.
- 22 Chowdhury, M., Lee, S., Ru, B., Park, N., and Jang, Y., ‘Service quality improvement of mobile users in vehicular environment by mobile femtocell network deployment,’ in Proc. Int. Conf. on ICT Convergence (ICTC) , 2011, 194–198.
- 23 Karimi, O., Liu, J., and Wang, C., ‘Seamless wireless connectivity for multimedia services in high speed trains,’ IEEE J. Sel. Areas Commun., vol. 30, no. 4, May 2012, 729–739.
- 24 Kirsal, Y., Ever, E., Kocyigit, A., Gemikonakli, O., and Mapp, G., ‘Modelling and analysis of vertical handover in highly mobile environments’, The Journal of Supercomputing 71 (2015) 4352–4380.
- 25 Baloch, R., Awan, I., and Min G., ‘A mathematical model for wireless channel allocation and handoff schemes’, Telecommunication Systems, vol. 45, no. 4, 2010, 275–287.
- 26 Yusof, A.L. et al., ‘Handover adaptation for load balancing scheme in femtocell Long Term Evolution (LTE) network’, in Proc. of the IEEE Control and System Graduate Research Colloquium, Shah Alam, 2014, 242–246.
- 27 Nasim, M., Chowdhury M., and Sefat, S., ‘Energy‐efficient cellular communications powered by smart grid technology’, in Proc. of the Int. Conf. on Electrical Information and Communication Technologies (EICT), Khulna, 2015, 298–303.
- 28 Bu, S. and Yu, F. R., ‘Dynamic energy‐efficient resource allocation in cognitive heterogeneous wireless networks with the smart grid’, in Proc. of the Int. IEEE Global Communications Conference (GLOBECOM), Anaheim, CA, 2012, 3032–3036.
- 29 Tabany M.R. and Guy, C.G., ‘A mobility prediction scheme of LTE/LTE‐A femtocells under different velocity scenarios’, in Proc. of the Int. Conf. on Computer Aided Modelling and Design of Communication Links and Networks (CAMAD), Guildford, 2015, 318–323.
- 30 Wu, S., Zhang, X., Zheng, R., Yin, Z., Fang Y., and Yang, D., ‘Handover Study Concerning Mobility in the Two‐Hierarchy Network’, in Proc. of the Int. IEEE Conf. on Vehicular Technology, Barcelona, 2009, 1–5.
- 31 Zhang, H., Wen, X., Wang, B., Zheng, W., and Sun, Y., ‘A Novel Handover Mechanism Between Femtocell and Macrocell for LTE Based Networks’, in Proc. of the Int. Conf. on Communication Software and Networks, Singapore, 2010, 228–231.
- 32 Gambini, J., Spagnolini, U., ‘Wireless over cable for femtocell systems’, IEEE Communications Magazine , 2013, 178–185.
- 33 Mukherjee, A., Bhattacherjee, S., Pal, S., and De, D., ‘Femtocell based green power consumption methods for mobile network’, Computer Networks, vol. 57, no. 1, 2013, 162–178.
- 34 Kulkarni, P., Gormus, S., Chin, W.H., and Haines, R.J., ‘Distributed resource allocation in small cellular Networks‐Test‐bed experiments and results’, in Proc. of the Int. Conf. on Wireless Communications and Mobile Computing, July 2011, 1262–1267.
- 35 Rehman, I.U., Philip, N.Y., and Istepanian, R.S., ‘Performance analysis of medical video streaming over 4G and beyond small cells for indoor and moving vehicle (ambulance) scenarios’, In Proc. of the Int. Conf. on Wireless Mobile Communication and Healthcare (Mobihealth) , 2014, 211–216.
- 36 Zeng, Q.‐A. and Agrawal D.P., ‘Modeling and efficient handling of handoffs in integrated wireless mobile networks’, IEEE Transactions on Vehicular Technology , vol. 51, 2002, 1469–1478.
- 37 [online] http://w3.siemens.com/smartgrid/global/en/products‐systems‐solutions/software‐solutions/solutions_for_emobility/Pages/overview.aspx.
- 38 Trivedi, K. S., Dharmaraja, S., Ma, X., ‘Analytic modeling of handoffs in wireless cellular networks’, Information Sciences , vol. 148, no. 1, pp. 155–166, 2002.
- 39 Al‐Turjman, F., ‘Impact of User's Habits on Smartphones' Sensors: An Overview’, HONET‐ICT International IEEE Symposium, Kyrenia, Cyprus, Oct. 2016, 70–74.
- 40 El Bouabidi, I., Zarai, F., Obaidat, M. S., Kamoun, L., “Design and analysis of secure host‐based mobility protocol for wireless heterogeneous networks”, Journal of Supercomputing , vol. 70, pp. 1036–1050, 2014.
- 41 H. Beigy, M. R. Meybodi, “A learning automata‐based adaptive uniform fractional guard channel algorithm”, Journal of Supercomputing, vol. 71, pp. 871–893, 2015.
- 42 F. Al‐Turjman and H. Hassanein, “Towards augmented connectivity with delay constraints in WSN federation”, International Journal of Ad Hoc and Ubiquitous Computing, vol. 11, no. 2, 2012, 97–108.
- 43 Zhang, J., De la Roche, G., et al., ‘Femtocells: technologies and deployment’, Wiley Online Library, 2010.
- 44 Singh, G. and Al‐Turjman, F., ‘Learning Data Delivery Paths in QoI‐Aware Information‐Centric Sensor Networks’, IEEE Internet of Things Journal, vol. 3, no. 4, 2016 572–580.
- 45 Al‐Fagih, A.E. et al., ‘A priced public sensing framework for heterogeneous IoT architectures’, IEEE Transactions on Emerging Topics in Computing , vol. 1, 2013, 133–147.
- 46 Singh, G.T. and Al‐Turjman, F. M., ‘A data delivery framework for cognitive information‐centric sensor networks in smart outdoor monitoring’, Computer Communications , vol. 74, 2016, 38–51.