4
Machine‐to‐Machine Communications in the Smart City—a Smart Grid Perspective
Ravil Bikmetov1, M. Yasin Akhtar Raja2 and Khurram Kazi3
1 University of North Carolina at Charlotte, NC, USA
2 Center for Optoelectronics and Optical Communication, University of North Carolina at Charlotte, NC, USA
3 Principal Member of Technical Staff, Draper Laboratory, Cambridge MA, USA
4.1 Introduction
“A Smart City is an urban system that uses information and communication technology (ICT) to make both its infrastructure and its public services more interactive, more accessible and more efficient” (Pellicer at al., 2013). The infrastructure of the smart city (SC) is required to be equipped with state‐of‐the‐art technological solutions to support citizens' interaction with urban elements in the most efficient and convenient way. Such requirements are one of the main factors driving recent advancements in ICT, associated sensing manifolds, and data‐handling peripherals to support the SC paradigm (Pellicer et al., 2013; Zanella et al., 2014; Dohler, Boswarthick, and Alonso‐Zárate, 2012; Giffinger et al., 2007; Sun et al., 2015).
The emergence of SCs was prompted by three main factors: a growing migration of constantly increasing world population from rural areas to urban centers (forecast to reach 70% by 2050), inevitable shortage of natural resources for the world population, and concerns about the environment and climate change. By 2020, the SC market is projected to exceed $400 billion with 600 cities around the globe (Maddox, 2016).
The SC concept has been developed to address such urban challenges by efficient management of rapidly growing city infrastructure and services, while meeting the needs of its citizens. According to the initial scheme of SC originally proposed by the Center of Regional Science at the Vienna University of Technology (Center of Regional Science, 2007), the foremost aspects of the SC concept are:
- Smart economy (competitiveness)—innovative entrepreneurship and productivity, flexibility of labor market, international embeddedness, and ability to transform.
- Smart governance (citizen participation)—public participation in decision making, public and social services, transparent control and political strategies.
- Smart people (social and human capital)—high level of qualification, commitment to lifelong learning, social and ethnic plurality, flexibility, and creativity.
- Smart mobility (transport and ICT)—local and international accessibility of safe transport systems and availability of sustainable ICT infrastructure.
- Smart environment (natural resources)—energy efficiency, sustainable resource management, and environmental protection.
- Smart living (quality of life)—cultural facilities, health conditions, individual safety, housing quality, education facilities, and high‐level social organization.
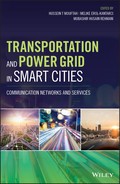
Smart city's (SC's) functional architecture is represented in Figure 4.1 from an information and communication technology (ICT) point of view (Pellicer et al., 2013; Sun et al., 2015). The previously described SC's aspects are located at the service layer of this infrastructure. While other interacting layers of a SC (see Figure 4.1) are part of an essential infrastructure for any human‐populated clusters: cities, towns and villages, etc., the smartness is afforded by information and awareness enabled by ICT.
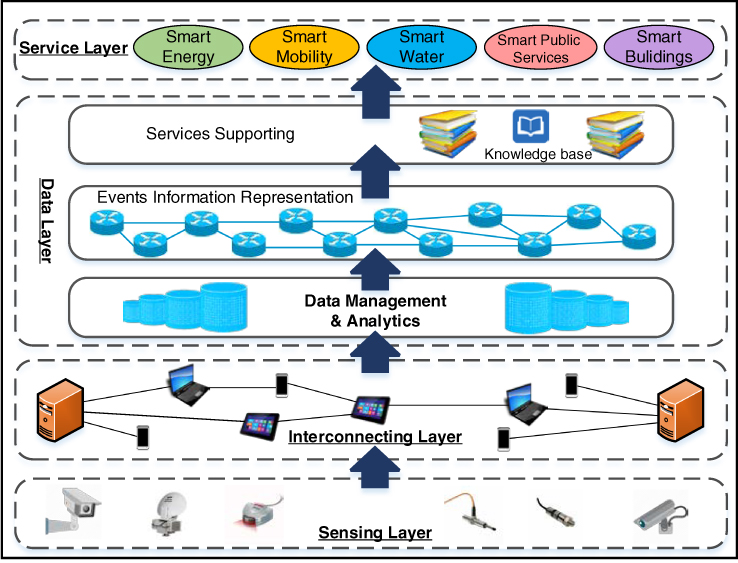
Figure 4.1 A functional architecture of the smart city concept. Sensing, Interconnecting, data, and service are four layers of this infrastructure. Data collection from lower layers to higher layers is shown by arrows.
Each layer of the SC's functional architecture has its own components and functionality (Sun et al., 2015; Sun et al., 2014a; Zhuge and Sun, 2010; Sun et al., 2016; Sun and Jara, 2014; Sun et al., 2014b; Pouryazdan et al., 2016; Ganti, Ye, and Lei, 2011; Campbell et al., 2016; Campbell et al., 2008) that are briefly described in the following.
-
Sensing layer
Represented by radio‐frequency identification (RFID) and utilized for ubiquitous sensing enabled by wireless sensor networks (WSN) that are also becoming popular and essential people‐centric urban sensing (Campbell et al., 2016; Campbell et al., 2008). Further, people‐centric sensing can be categorized into three classes: personal sensing, which focuses on personal monitoring and archiving; social sensing, which focuses on sharing information within social and special interest groups; and public sensing, which focuses on sharing data with everyone for the greater public good (such as entertainment or community action; Campbell et al., 2008). With the popularity of smart phones containing various sensors such as camera, audio, accelerometer, GPS (Global Positioning System), gyroscope, compass, proximity, and ambient light, and among others a new community/public sensing paradigm called “mobile crowd‐sensing (MCS)” rapidly emerging. This paradigm is defined as a sensing by a large group of mobile devices and sharing mutual information in this group for further data analysis (measuring, mapping, estimating, prediction, etc.) of processes of presenting a common interest for this group (Pouryazdan, 2016; Ganti, Ye, and Lei, 2011).
-
Interconnecting layer
It is utilized for data transmission and information exchange among different devices and different domains in the layer (Sun et al., 2015; Sun et al., 2014a; Zhuge and Sun, 2010; Sun et al., 2016; Sun and Jara, 2014; Sun et al., 2014b; Pouryazdan, 2016; Ganti, Ye, and Lei, 2011; Campbell et al., 2016; Campbell et al., 2008.
-
Data layer
It is utilized for storage of massive and heterogeneous data generated from a variety of monitoring devices in the sensing layer (Sun et al., 2014b), extracting useful information from the large amount of data being sensed and representing the meaningful information in reasonable and efficient ways (Sun et al., 2014a; Sun and Jara, 2014; Sun et al., 2014b), decision making and service supporting (Sun et al., 2016; Sun and Jara, 2014), and knowledge maintenance and management (Zuge and Sun, 2010).
-
Services (application) layer
This layer is utilized to provide services to the communities of a smart city in an efficient and reliable manner. It includes the main aspects of the SC's initial scheme and performs a direct interaction with the citizens of the SC (Sun et al., 2015; Sun et al., 2014a; Zhuge and Sun, 2010; Sun et al., 2016; Sun and Jara, 2014; Sun et al., 2014b; Pouryazdan et al., 2016; Ganti, Ye, and Lei, 2011; Campbell et al., 2016; Campbell et al., 2008).
This chapter focuses on the smart energy concept for a SC, which is presented by the smart grid (SG) paradigm. The first main section is designated for the architecture and common characteristics of SGs. The second major section describes intelligent machine‐to‐machine interactions in SGs. In the third section, optimization algorithms for energy production, distribution, and consumption are introduced and briefly discussed. The last section finally outlines the machine learning techniques in efficient energy services and from a management perspective. A quick overview of future perspectives of machine‐to‐machine communications within SGs is given in section five.
4.2 Architecture and Characteristics of Smart Grids for Smart Cities
A pre‐introduced concept of a SC was developed to achieve and maintain efficient management in all areas that belong to any city. Those include urban planning, infrastructure, transport, energy, civic services, education, health, public safety, and so on. Within a SC concept, these areas should satisfy both the needs of individual citizens and the communities as a whole. In any city or population cluster, the energy infrastructure is the foremost important function continuously supporting all other domains and civic aspects of the city. A reliable and efficient energy service can significantly improve the performance of other areas and aspects of a SC including its management efficiency, safety, and resources conservation.
A smart grid (SG) can be considered as “an electric system that uses information, two‐way, cyber‐secure communication technologies, and computational intelligence in an integrated fashion across electricity generation, transmission, substations, distribution and consumption to achieve a system that is clean, safe, secure, reliable, resilient, efficient, and sustainable” (Fang et al., 2013). A smart grid (SG) paradigm was developed to ensure efficient, reliable, and environmentally friendly energy service for the citizens of a population cluster emerging in a SC (Fang et al, 2012; NIST, 2014; NIST, 2010; NIST, 2012). The SG paradigm modernizes the existing power systems through self‐healing, automation, and remote monitoring and control. Besides, the SG informs and educates consumers about their energy usage, costs, and alternative options, to enable autonomous decision making about how and when to use electricity and fuels. In addition, the SG provides safe, secure, and reliable integration of distributed and renewable energy sources to support consumers' comfort experience and environment. All these enhancements of an energy infrastructure make it more reliable, sustainable, and resilient by placing a SG in the heart of the SC. To support their functions and civic services, SCs depend on their SGs, which ensure resilient delivery of energy, present opportunities for its conservation, improve efficiency of its consumption, and most importantly, enable coordination between urban infrastructure operators and energy service providers.
4.2.1 Definition of a Smart Grid and Its Conceptual Model
A traditional energy grid can be generally regarded as an interconnected network for electricity transmission and its delivery from generation sites to the consumers' domains.
During the conventional development of existing energy grids, the electric power industry had traditionally dedicated more attention and resources to generation and power transmission networks rather than to power distribution networks, as shown in Figure 4.2. This process occurred due to traditional paradigm that the demand for electricity completely dictates its generation (Fang et al, 2012; López et al., 2014; Tuttle et al., 2016; Ardito et al., 2013). As a result, bulk generation plants and power transmission systems have been traditionally monitored and controlled using legacy communication networks, which often allow a certain level of centralized coordination. Moreover, power distribution grids have been traditionally passive systems with limited communication capabilities. This fact significantly reduced flexibility, sustainability, and efficiency of traditional energy grids (Figure 4.2; Fang et al, 2012; López et al., 2014; Tuttle et al., 2016; Ardito et al., 2013).

Figure 4.2 Transition from traditional grids to smart grids.
In comparison with traditional energy grids (Figure 4.2), a smart grid (SG) represents a true revolution in energy distribution and supply including its users' domains involving a wide variety of technologies and numerous standards developed to ensure reliability and interoperability (Fang et al., 2012; NIST, 2014; NIST, 2010; NIST, 2012; Ardito et al., 2013). Following a standardization process, the International Electrotechnical Commission (IEC) has created a free “Smart Grid Standards Mapping Tool” (SGSMT) allowing the identification of the standards that are required for any part of the SGs (IEC, 2016). Besides IEC, the standards from other technical organizations were also included in the SGSMT.
During the standardization process, the Smart Grid Interoperability Panel (SGIP) at the National Institute of Standards and Technology (NIST), a private/public partnership funded by different industry stakeholders in cooperation with the United States federal government, focused on the development of a framework for coordinating all SG stakeholders and accelerating standards harmonization and interoperability (NIST, 2010). As a first step of this development, the SGIP established the SG conceptual model, illustrated in Figure 4.3. The first version of this conceptual model was published in January 2010 (NIST, 2010), and it was reviewed and updated in February 2012 (NIST, 2012). The NIST report describing the SG conceptual model identifies about 80 existing standards that can be used to support SG developments. Besides, this report identifies high priority gaps, for which new or revised standards are directly needed (NIST, 2014; NIST, 2010; NIST, 2012).

Figure 4.3 NIST Smart Grid Conceptual Model.
As shown in Figure 4.3, the SG conceptual model defines seven domains as well as the electrical and communication flows among them (NIST, 2012). The electrical flows involve the traditional subsystems of the electrical grid: bulk generation, transmission, distribution, and customer domains. Communication and information data flows create a mesh topology between almost every domain illustrating the outstanding importance of communications in the SG (NIST, 2010; NIST, 2012). Based on the terminology developed for this conceptual model, each domain and its subdomains encompass SG “actors” and “applications.” Actors include devices such as smart meters, data concentrators, various buffers; systems such as energy consumption measurement and control; programs; and stakeholders that make decisions and exchange information. Applications are tasks performed by one or more actors within a domain (home and building automation, etc.) (NIST, 2010; NIST, 2012).
A specific design of a SG can be obtained by implementation of such a conceptual model for a given domain, a given application, its specific requirements, the actors involved in this application, and the description of interactions between the actors. Table 4.1 summarizes the main actors included in each domain of the SG conceptual model (NIST, 2012). Although other standardization institutions (IEEE, ETSI, and others) have defined their own SG conceptual models, the SG conceptual model developed by National Institute of Standards and Technology (NIST) is the most widely accepted (Fang et al., 2013; López et al., 2014; Smart Grid Coordination Group, 2012; Smarter Grid Solutions UK, 2014).
In the following, each domain is briefly described in reference to its typical functionality and role. The corresponding diagrams are used to provide a quick visual and comprehensive functionality.
Table 4.1 Domains and Actors in the NIST Smart Grid Conceptual Model (NIST, 2012).
| Domains | Actors |
| Bulk generation | Power plants—generators of electricity in bulk quantities |
| Transmission | Transmission system operators—carriers of bulk electricity over long distances |
| Distribution | Distribution system operators—distributors of electricity to and from customers |
| Customers | End users of electricity able to generate, store, and manage their energy utilization |
| Operations | Managers of the power flow to and from customers |
| Markets | Commodity markets that specifically control the trade and supply of energy (actors from independent system operators and regional transmission organizations) |
| Service providers | Energy services companies—organizations providing services to electrical customers and utilities (aggregators, retailers, etc.) |
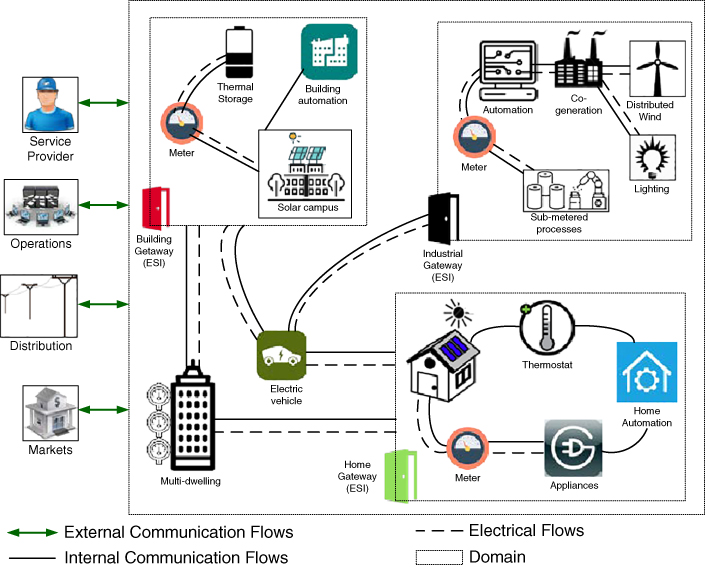
Figure 4.4 General architecture of the customer domain.
The customer domain of the SG conceptual model (Figure 4.4) is an energy consumption domain that consists of stakeholders supported by the entire infrastructure of a SG (NIST, 2012). The actors in this domain are smart meters, Internet of Things (IoT) sensors, and other intelligent electronic devices (IEDs). These actors can manage consumers' energy usage and its generation and control the information flow between the customer domain and other domains of the SG conceptual model (cf. Figure 4.4). To perform these tasks, several actuators are used in the customer domain, such as home and building automation systems. Utility meters and energy service interfaces (ESIs) are the boundaries of the customer domain (Figure 4.4). More details about energy consumers within the SG will be discussed in Subsection 4.1.6.
The markets domain is a part of the Smart Grid (SG) conceptual model (cf. Figure 4.3), where energy grids assets are bought and sold (e.g., Figure 4.5) (NIST, 2010; NIST, 2012). The main functions of this domain are energy price exchange and balance of supply and demand within the power system. The boundaries of the markets domain are at the edge of the operations domain controlling the SG, the domains of supplying assets, such as generation and transmission, and the customer domain (Figure 4.5) (NIST, 2012). Communication flow between the markets domain and all other domains must be reliable, traceable, and auditable to ensure an efficient matching of energy production with its consumption. Besides, these communications must support e‐commerce standards for integrity and non‐repudiation. The participation of distributed energy resource (DER) in the markets domain is persistently increasing and becomes more interactive (Fang et al., 2012; Ardito et al., 2013; Fadlullah and Kato, 2015).
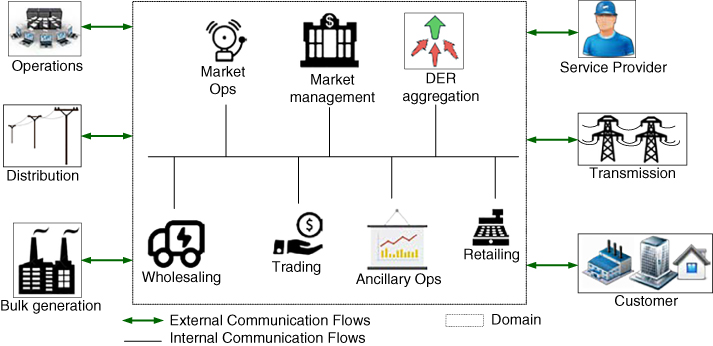
Figure 4.5 General architecture of the markets domain.
According to the SG conceptual model (Figure 4.3), the service provider domain shares interfaces with the markets, operations, and customer domains (Figure 4.6). Communication flow through these interfaces is very critical for each domain connected to the service provider: operations by system control and awareness, markets and customer by the grid's efficiency enabling its economic growth and development of “smart” services (NIST, 2010; NIST, 2012). In the service provider domain, illustrated in Figure 4.7, actors perform services to support business processes of power system producers, distributors, and customers. The examples of these processes are billing and customer account management, management of energy use, home energy generation, etc. (CEN, CENELEC, and ETSI, 2012). More details about service providers within the SG will be given in Subsection 4.1.7.
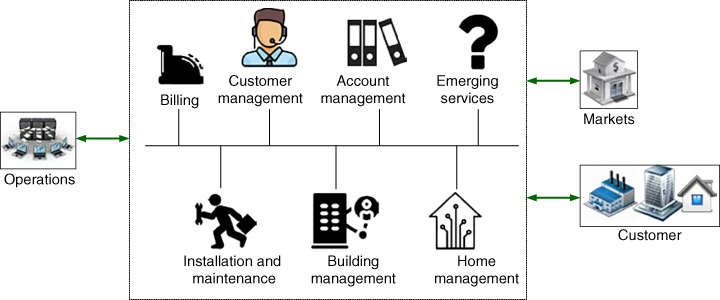
Figure 4.6 General architecture of the service provider domain.
According to the SG conceptual model (Figure 4.3), the operations domain has secure communication connections with all other domains of a Smart Grid (Figure 4.7) (NIST, 2012). Representing the major operated utility, this domain is responsible for the smooth operation of the power system (NIST, 2010; NIST, 2012). Controlling planning and service delivery processes, the operations domain supplements the functionality of the service provider and market domains (NIST, 2010; NIST, 2012).

Figure 4.7 General architecture of the operations domain.
The generation domain, illustrated in Figure 4.9, is electrically connected to the transmission or, in some cases, to the distribution domain and shares communication interfaces with the operations, markets, transmission and distribution domains (Figure 4.3) (NIST, 2010; NIST, 2012). The generation domain communicates key performance and quality of service for variable energy sources, which can be renewable or non‐renewable (e.g., Figure 4.8). In this domain, electricity is produced from other forms of energy, which may include a wide variety of sources: chemical combustion, nuclear fission, water flow, wind, solar radiation, and geothermal heat (Figure 4.8) (NIST, 2010; NIST, 2012). Therefore, applications in the generation domain are the first processes in the electricity delivery to Smart Grid's customers. Besides, various physical actors are presented in this domain: protection relays, remote terminal units, equipment monitors, fault recorders, user interfaces, and programmable logic controllers (Figure 4.8). The boundaries of the generation domain are either the transmission or the distribution domain (NIST, 2010; NIST, 2012).
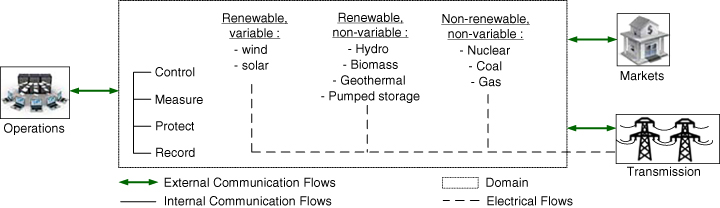
Figure 4.8 General architecture of the generation domain.
The transmission domain of the SG conceptual model (cf. Figure 4.3) performs bulk transfer of electrical power from the generation to the distribution domain through multiple substations (see Figure 4.9) (NIST, 2010; NIST, 2012). The transmission domain is typically operated by a transmission‐owning utility, which can be represented by a regional transmission operator (RTO) or an independent system operator (ISO). The main responsibility of the RTO or ISO is to maintain stability of the electric grid by balancing energy generation with its load across the transmission network. The physical actors of the transmission domain (Figure 4.9) are remote terminal units, substation meters, protection relays, power quality monitors, phasor measurement units, sag monitors, fault recorders, and substation user interfaces (NIST, 2010; NIST, 2012).

Figure 4.9 General architecture of the transmission domain.
As it was described previously, the Smart Grid concept brought decentralization to the energy distribution component of the electric power system. Because of this, many communications and electrical interfaces are considered to work in both directions supporting a bidirectional flow. Based on these considerations, the general architecture of the distribution domain was developed (Figure 4.10) (NIST, 2010; NIST, 2012). In such architectural design, distribution actors may have local peer‐to‐peer communication with more centralized communication methodology in several cases (Fang et al., 2012; NIST, 2010; NIST, 2012; Fadlullah and Kato, 2015).
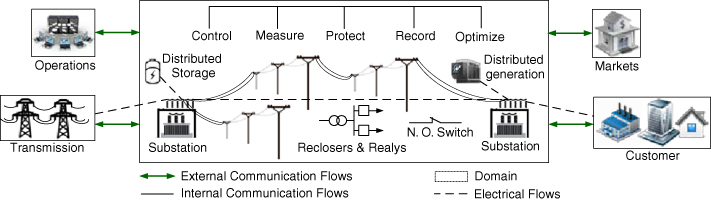
Figure 4.10 General architecture of the distribution domain.
In the Smart Grid, the distribution domain will communicate in real time more closely with the operations domain to manage the power flow associated with a more dynamic markets domain (NIST, 2010; NIST, 2012). The markets domain will communicate with the distribution domain in ways that will affect localized consumption and generation. In turn, these behavioral changes in consumption and generation due to market forces may have electrical and structural impacts on the distribution domain and the larger grid (NIST, 2010; NIST, 2012). In this architecture, service providers may communicate with the customer domain using the infrastructure of the distribution domain. The typical applications within the distribution domain are usually divided into the following categories: substation monitoring and control, management of energy storage unit, management of distributed generation, and control of SG's protection and optimization mechanisms (NIST, 2012).
4.2.2 Standardization Approach in Smart Grids
Beside the SG conceptual model (NIST, 2012), one of the main outcomes of the Smart Grid Interoperability Panel (SGIP) activity is the elaboration of standards, practices, and guidelines that allow the development and deployment of a robust and interoperable SG. As a result, in May 2011 the SGIP governing board established the Catalog of Standards (CoS). This CoS was updated several times and is available online through the National Institute of Standards and Technology (NIST) SG Collaboration (NIST, 2013). As of today, the CoS comprises 20 individual standards and five separate series containing 36 additional standards, which accounts for a total of 56 standards.
Besides the International Electrotechnical Commission (IEC), other technical professional organizations (see Table 4.7) have introduced their own standards and recommendations for development of a SG conceptual model. The prevalent contribution was done by the IEEE, which has more than 100 standards relevant to smart grids. Among them, over 20 IEEE standards were included in the NIST “Framework and Roadmap for Smart Grid Interoperability Standards,” known collectively as Release 3.0, which was issued in 2014. The major standards from this document are listed in Table 4.7 (see appendix at the end of the chapter).
The scope of Institute of Electrical and Electronics Engineers (IEEE) 2030 standardization and overall reference architecture is illustrated in Figure 4.11 (IEEE, 2011). As described previously, the standardization process was initialized by conceptual reference models, such as NIST's Smart Grid conceptual model (cf. Figure 4.3) (NIST, 2014; NIST, 2012). To ensure the SG's interoperability, this process occurred in three architectural perspectives: communications, power systems, and information technology. As a result, various applications were created in a Smart Grid: advanced metering infrastructure, plug‐in electric vehicle, etc. (Figure 4.11).

Figure 4.11 Scope of IEEE 2030 standardization process.
To define and elaborate upon such diverse functionality, a Smart Grid interoperability reference model (SGIRM) was created.
4.2.3 Smart Grid Interoperability Reference Model (SGIRM)
Once a conceptual model of the SG was defined (cf. Figure 4.3) (NIST, 2010; NIST, 2012), a reference architecture elaborating this model would be required. This architecture would define functional blocks and interfaces, thus bringing the developed conceptual model closer to implementation. IEEE's project 2030 pioneered in developing such reference architecture as displayed in Figure 4.11, leading to the SG interoperability reference model (SGIRM), well known in the community (IEEE, 2011). The SGIRM extends the NIST SG conceptual model defining three interoperability architectural perspectives (IAPs). IAPs represent the main areas of expertise involved in the SG: power systems (PS‐IAP), information technology (IT‐IAP), and communications technologies (CT‐IAP) as depicted in Figure 4.11 (IEEE, 2011). Each IAP defines the main functional blocks required in each domain of the NIST SG conceptual model, the interfaces between functional blocks (intra‐domain interfaces), and the interfaces between domains (inter‐domain interfaces) (IEEE Smart Grid, 2015). The defined IAPs are further elaborated for the most important applications in the SG area, such as advanced metering infrastructures (AMIs) or plug‐in electric vehicles (PEVs).
Being the main focus of this chapter, CT‐IAP defines the communication networks that can be used in every domain. Communications networks domains and interfaces defined for the SG in IEEE's project 2030 are listed and described in Table 4.2 (IEEE, 2011; IEEE Smart Grid, 2015).
Table 4.2 Communications Networks Defined for the SG in the IEEE 2030 CT‐IAP (IEEE, 2011; IEEE Smart Grid, 2015).
| Communications Network | Description |
| xAN Energy services interfaces (ESIs) |
Home area network (HAN), building area network (BAN), and industrial area network (IAN) encompassing all the intelligent electronic devices (IEDs) that allow monitoring and control of energy status and patterns within each context. ESIs represent logical gateways. |
| Neighborhood area network (NAN) | Last mile communications network that connects ESIs and smart meters, distributed energy resources (DERs) and microgrids to the utility control and operation center through the backhaul network |
| Backhaul | Backhaul network provides connectivity between the utility control and operation center and any communications network within the distribution, long‐haul, and customer domains |
4.2.4 Smart Grid Architecture Model
The SG architecture model is the other representation of functional architecture of the SG that was developed by the Smart Metering‐coordination Group (SMG) of the European Commission (EC) according to mandate M/490 (European Commission, 2011). According to SMG, the SG architecture model is defined as a three‐dimensional architectural model comprising the domains, zones, and layers as displayed in Figure 4.12 (Smart Grid Coordination Group, 2012). The SG architecture model allows a technologically neutral representation of all the interoperability cases of the SG. The five defined layers of this model represent (top to bottom) the business objectives and processes, the functions, information exchange and data models, communication technologies and protocols, and its physical and logical components (Figure 4.12). The communication layer, the main focus and the core of the current chapter, is developed in a separate document (CEN, CENELEC, and ETSI, 2012). This document defines the communications networks and their deployment at the component layer and maps the identified technologies and protocols onto these networks.

Figure 4.12 Smart Grid architecture model.
In spite of the fact that the SG architecture model was initially created to describe the functional architecture of the SG, it appears to be a well‐formed conceptual model of the power system expanding the initial one developed by the NIST. Specifically, this SG architecture model includes domains from its central generation down to customers, zones of operation from individual processes up to the managing enterprise and the market, and with interoperability layers covering a whole SG system from the business layer down to smart grid components.
4.2.5 Energy Sources in the Smart Grid
In traditional power grids, electricity is generated by a few central energy sources and transmitted in a unidirectional fashion to a large number of users. In contrast, SGs use two‐way flows of electricity supported by a bidirectional information transmission through an automated advanced network for distributed energy delivery (Fang et al., 2012; NIST, 2010; NIST, 2012; Bikmetov et al., 2015a; Bikmetov et al., 2015b; Bikmetov et al., 2016). Beside traditional energy generation stations, SGs have distributed renewable energy sources (RESs) and supporting battery energy storage (BES). The majority of RESs are solar and wind energy sources. BES can be designed and made up using a variety of technologies (Fang et al., 2012; 26th Annual Conference and Expo, 2015; Eurobat, 2013; Sebastián, 2016). The most popular types of BESs are lithium‐based, nickel‐based, and sodium‐based batteries (26th Annual Conference and Expo, 2015; Eurobat, 2013).
As mentioned earlier, electricity in SGs can also be transmitted back into the grid by its users (Fang et al., 2012; NIST, 2010; NIST, 2012; Ardito et al., 2013; Fadlullah and Kato, 2015). As an example, SG's users with solar panels at their premises are able to generate energy and put it back into the grid. Such backward energy flow is important and extremely helpful in situations when SG becomes “islanded” due to power failures. Using such energy feedback received from SG's users, a SG can function reducing the level of its own energy generation (Fang et al., 2012; NIST, 2010; NIST, 2012; Ardito et al., 2013; Ardito et al., 2013; Fadlullah and Kato, 2015). However, the so‐called backward flow of electricity from the user sites toward distribution grids is not simple or straightforward, contrary to the information and data grids—it requires compatibility of legacy hardware by upgrading and implementation of strict safety protocols based on information (Fang et al., 2012; Ardito et al., 2013; Fadlullah and Kato, 2015).
Distributed generation (DG) is one of the key components of the paradigm enabled by SG. DG takes advantage of distributed energy resources (DER) systems: solar panels, wind turbine farms, and gas/diesel generators. All DER systems are often small‐scale power generators (typically ranging from few kW to 10,000 kW) with an improved power quality and reliability (NIST, 2010; NIST, 2012; Bikmetov et al., 2015b; Bikmetov et al., 2016; Bikmetov et al., 2014. From an energy generation perspective, the SG is a localized grouping of electricity generators and loads, which can disconnect from the main grid so that DG can continue to supply users with energy without obtaining power from outside. Thus, the disturbances in the main grid can be isolated, and peak‐shaving techniques (Sebastián, R., 2016; Riffonneau et al., 2011; Dietrich et al., 2012) can be implemented. A study (International Energy Agency, 2002) from the International Energy Agency pointed out that a power system based on a large number of reliable small DGs can operate with the same reliability and a lower capacity margin than a system of equally reliable large generators.
A useful review of various distributed energy technologies such as microturbines (gas, diesel, etc.), photovoltaic panels, fuel cells, and wind power turbines can be found in Adinolfi et al. (2013). However, implementing DG in practice is not an easy scheme due to several reasons (Fang et al., 2012; Ardito et al., 2013; Smarter Grid Solutions UK, 2014; Bikmetov et al., 2016; 26th Annual Conference and Expo, 2015; Eurobat, 2013). First, DG involves large‐scale deployments of RES, whose energy production is a subject to wide fluctuations due to weather and climate conditions. It was shown that the generation patterns from RES are far from being equal during a certain time span (Fang et al., 2012; Tuttle et al., 2016; Bikmetov et al., 2015b). Therefore, it is important to maintain an effective utilization of the DG in a way that is conscious of the variability of the yield from RES. The second challenge of DG's implementation is that the average operation costs of distributed generators for producing one unit of electricity are often higher than those of traditional large‐scale central power plants (Pellicer et al., 2013; Fang et al., 2012; Tuttle et al., 2016).
Considering DG's potential benefits on power quality, it is essential to conduct a systematic research on how to balance the high capital costs and the reliable power supplies available through a DG paradigm. Although there is a limited penetration of DG in today's power system, the future SGs are expected to adopt a large number of distributed generators to increase the level of decentralization of existing power systems (Pellicer et al., 2013; Fang et al., 2012). As predicted in Pellicer et al., this process could include the following three stages:
- accommodation of DG in the current power system;
- introduction of a decentralized system of DG cooperating with the centralized generation system; and
- delivery of most power by DG and a limited amount by central generation.
Since the localized DG enables the users to deploy their own generators, the large‐scale deployment of DG will also change the traditional power grid design methodology, in which the generators are directly connected to the transmission grid (e.g., Figure 4.3). Due to such changes, a layer of energy generation and distribution control can be included between bulk generation and transmission.
The deployment of DG further leads to the concept of a virtual power plant (VPP), which manages a large group of distributed generators with a total capacity comparable to that of a traditional power plant (NIST, 2013). A VPP is a cluster of distributed generators that is collectively run by a central controller. The concentrated operational mode of VPPs allows reduction of a peak electricity load (“peak‐shaving”) and load‐aware power generation at short notice (Fang et al., 2012; NIST Smart Grid Collaboration, 2013). The last benefit leads to real‐time load scheduling and capacity planning within a SG (Bikmetov et al., 2015b; Bikmetov et al., 2016). A VPP cluster can replace a conventional power plant while providing higher efficiency and flexibility of energy distribution. Such advanced flexibility allows energy systems to react quicker to fluctuations in energy demand. Both benefits of VPPs (peak‐shaving and load‐aware generation) require a complex optimization, control, and secure communication methodologies.
Recently developed VPPs have been examined in numerous research studies (Andersen et al., 2008; Lombardi, Powalko, and Rudion, 2009; You et al., 2009a; You et al., 2009b). Anderson et al. (2008) focused on the investigation and description of a suitable software framework that can be utilized for implementation of the VPP concept in future power systems. The importance of service oriented architecture in implementing VPPs was emphasized in this work. Lombardi et al. (2009) focused on the optimization of VPP's architecture. Using an energy management system for this optimization, a VPP can be controlled to minimize the electricity production costs and to increase the utilization of renewable energy. S. You et al. (2009a) proposed a market‐based VPP, which uses bidding and price signal as two optional operations. In this model, a VPP provides individual distributed energy resource units with the access to current electricity markets. S. You et al. (2009b), proposed a generic VPP model running under a liberalized electricity market environment and attempted to provide a summary of the main functions that are necessary for the efficient operation of the developed VPP model. A current integration of vehicle‐to‐grid (V2G) and VPP technologies was investigated in Zhang et al. (2017) as well. The architecture of V2G integrated in VPP was outlined providing a sketch of the distribution algorithm, and the associated optimization problem for the overall VPP system.
4.2.6 Energy Consumers in a Smart Grid
Conventionally, three types of users/customers' domains are considered within a SG paradigm: residential, commercial, and industrial (NIST, 2010; NIST, 2012; NIST, 2014; Bikmetov et al., 2014; Bikmetov et al., 2015a; Bikmetov et al., 2016). According to its definition, the residential domain consists of private dwellings (apartments, townhouses, etc.) of a smart city residents. The energy users within residential domains are single households, whose energy loads usually include the following set of appliances: washers, dryers, cooktops/ovens, dishwashers, water heaters, etc. The energy consumption level of a single residential user is typically less than 20 kW (NIST, 2010; NIST, 2012; Bikmetov et al., 2015a; Bikmetov et al., 2015b). It is common to combine residential users into clusters where energy management is performed by a single energy service provider (NIST, 2010; Bikmetov et al., 2015a; Bikmetov et al., 2015b). The commercial domain is formed by small‐ and medium‐size businesses and enterprises: stores, restaurants, hotels, etc. The typical loads within commercial domains are commercial refrigerators, freezers and ovens, and HVAC systems of an entire building and a cluster. For a commercial user, the average level of energy consumption is about 20–200 kW (NIST, 2010; NIST, 2012; Bikmetov et al., 2015a; Bikmetov et al., 2015a; Bikmetov et al., 2015b). The industrial domain consists of plants, factories, and other manufacturing and engineering facilities with the following typical energy loads: heavy machinery, fabrication and manufacturing equipment, etc. Generally, the energy consumption level of a single industrial user is over 200 kW and less tolerant to fluctuations and load shedding (NIST, 2010; NIST, 2012; Bikmetov et al., 2015a; Bikmetov et al., 2015b).
The boundaries of these domains are generally considered at utility meters, such as smart meters (SMs), typically equipped the energy services interfaces (ESIs). For each user within its domain, energy management and control is performed through a single SM connected to energy loads by means of intelligent devices and sensors (NIST, 2010; NIST, 2012; Bikmetov et al., 2015a; Bikmetov et al., 2015b). These ESIs are secure interfaces for interactions between the energy service provider (ESP) and energy users (Figure 4.4). The ESIs were standardized during the development of the SG architecture model depicted in Figure 4.12. Besides, different domains can communicate through ESIs via the advanced metering infrastructure (AMI) or via another communication network implemented within a SG, such as an Internet infrastructure (NIST, 2012; Bikmetov et al., 2015; Bikmetov et al., 2014). In other words, the ESI can act as a bridge between the ESP and facility‐based systems, such as a building automation system (BAS) or an energy management system (EMS) located at the users' domains of a SG (NIST, 2012; Bikmetov et al., 2015; Bikmetov et al., 2014). Therefore, each domain of users is equipped with a SM and an ESI that may reside in the SM, on the EMS, or in an independent gateway. In addition to that, the ESI allows each energy user to communicate with devices and systems located within the energy users' premises across a home area network or other LAN. In some cases, commercial and industrial users' domains encompass more than one energy management system (EMS) and, therefore, more than one communications path per energy consumer (NIST, 2012; Bikmetov et al., 2015; Bikmetov et al., 2014).
The EMS is the entry point for several applications running at the functional layer of the SG architecture model (cf. Figure 4.12): load control, monitoring and control of distributed generation, in‐home display of customer usage, reading of non‐energy meters, and integration with BASs and enterprises. The EMS provides users logging and auditing functions for cyber security purposes. Each user's domain is electrically connected to the distribution domain and to the ESP through a corresponding telecommunication network of an advanced metering infrastructure (AMI). Besides, each users domain communicates with the operations and market domains. Typical applications of an EMS within the customer domain are presented in Table 4.3.
Table 4.3 Typical Applications of EMS within the Users Domain.
| Application | Description |
| Building/home automation | A system that is capable of controlling various functions within a building such as lighting and temperature control. |
| Industrial automation | A system that controls industrial processes such as manufacturing or warehousing. |
| Micro‐generation | Includes all types of distributed generation including solar, wind, and hydro generators. Generation harnesses energy for electricity at a customer location. May be monitored, dispatched, or controlled via communications. |
To ensure an efficient energy management and its reliable delivery, users domains are required to be in close interaction with their ESP. Based on the SG conceptual model, the service provider domain was introduced in Subsection 4.1.1. More details about this domain are given in the next subsection.
4.2.7 Energy Service Providers in the Smart Grid
Based on the developed SG conceptual model, an ESP or an energy service company (ESCO) can be defined as a commercial or nonprofit organization providing solutions for energy supply and generation, designing and implementing projects for energy efficiency improvement, energy retrofitting, and conservation (Ardito et al., 2013; Fadlullah and Kato, 2015; Nunna et al., 2017; Deng et al., 2015; Salinas et al., 2013). The main role of ESPs is to develop, design, build, and fund projects that produce or save energy, reduce energy costs, and decrease operations and maintenance costs at their customers' facilities (US Department of Energy, 2016). In general, ESPs act as project developers for a comprehensive range of energy conservation measures, assuming the technical and performance risks associated within their projects.
ESPs are acting at the business layer of the SG architecture model (in reference to Figure 4.12). Using the corresponding telecommunication connections and networks (Figure 4.3), they collect information about current, predicted, and required statuses of energy generation, transmission, and distribution from the operations domain of the SG. Besides, the ESPs inquire the data from markets about current energy prices for each source of its generation and the information about users' requirements and preferences from energy users' domains. All the data collected by the ESPs from various domains of a SG are utilized for continuous management of energy flow, which can be performed in real time (Bikmetov et al., 2015a; Bikmetov et al., 2015b). This process will be described in more detail in Section .
From a business point of view, ESPs are distinguished from other firms that offer energy‐efficiency improvements in the fact that they use the performance‐based contracting methodology: when an ESP implements a project, the ESP's compensation is directly linked to the actual energy cost savings. Many of the recent ESP's projects with substantial energy efficiency retrofits involve renewable energy technologies and advanced energy distribution techniques. Typically, such projects require large initial capital investments and have a relatively long payback period.
The substantial energy efficiency retrofits and renewable energy technologies inherent in energy savings performance contract (ESPC) projects typically require large initial capital investments and may have a relatively long payback period.
Each domain of the SG conceptual model (Figure 4.3) is characterized by a tight integration of flexible and secure communication networks (NIST, 2010; NIST, 2012; Bikmetov et al., 2015a; Bikmetov et al., 2015b). In addition to these networks, a large number of sensors and actuators are required to implement novel energy management techniques within a SG. Thus, a SG transforms into an intelligent electricity network, with building blocks represented by M2M communications. The entire monitoring and control infrastructure of a SG is deployed by means of M2M communications and the IoT paradigm.
4.3 Intelligent Machine‐to‐Machine Communications in Smart Grids
As described in the previous section, there are multiple functions that can be supported in a SG by intelligent M2M communications: smart metering, distribution and transmission control, etc. Smart metering in M2M interaction can facilitate flexible demand management where smart meters are two‐way communicating devices that measure energy consumption and transmit that information via some ICT back to the local utility. With near real‐time information available (e.g., the flow of energy in the grid), different levels of tariff can be calculated and made available for the users/consumers, who can make smarter and more responsible choices. Various large‐scale WSANs are deployed in a SG to carry information about electric power system generation, transmission, distribution, and home applications for monitoring demand and response tasks.
4.3.1 Reference Architecture of Machine‐to‐Machine Interactions
M2M interactions are generally defined as a direct communication between devices using any available data transmission channel. M2M interactions enable various sensors or meters to communicate the sensed and recorded data to application software that can utilize this data to adjust certain industrial or manufacturing process (Dohler, Boswarthick, and Alonso‐Zárate, 2012; Bush, 2013).
Figure 4.13 displays the central domains of the M2M reference architecture developed by ETSI (European Telecommunications Standards Institute, 2012). This is a resources‐based, end‐to‐end architecture of M2M interactions identifying the functional entities and the related reference points. The M2M reference architecture can be used for the exchange of data and events between machines and entities involving communications across networks without requiring human intervention.
At the reference architecture (Figure 4.13), M2M interactions are described as a distributed system with service capabilities at both network and the M2M device domains level. These capabilities are defined in the specification and are used to put in communication applications, e.g., network, gateway, and device domains. The M2M device domain encompasses the so‐called capillary networks (in ETSI terminology), i.e., the sensors and actuators networks (SANs) (López et al., 2014). The network domain represents the core of the M2M infrastructure and provides bidirectional bulk data exchange over long distances. Finally, the application domain encompasses the services, which are delivered on the top of the M2M infrastructure.
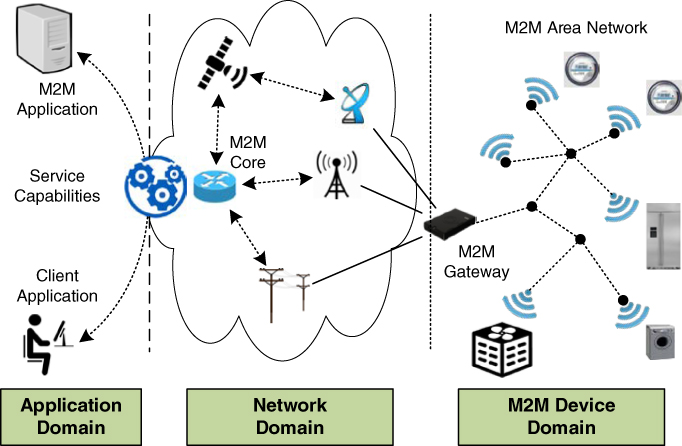
Figure 4.13 Main domains of the M2M reference architecture according to European Telecommunications Standards Institute.
4.3.2 Communication Media and Protocols
Although there are varieties of communications technologies available for use in M2M communication infrastructures for the SG (Gungor et al., 2011; Usman and Shami, 2013), wireless ones are currently of special interest. These avoid wired connectivity and enable mobility and identity. As a token of that, NIST set up a specific working group within the Priority Action Plan 2 (PAP2) to tackle the challenges and opportunities of wireless communications in the SG paradigms (NIST, 2011). Communications for the SG present specific requirements from both the technical and economic perspectives, such as described in (Güngör et al., 2013; Yan et al., 2013; Liu et al., 2012):
- Quality of Service (QoS) required for the target application. Notably, QoS policies are mainly oriented to traffic prioritization and resource allocation to face congestion situations. Some parameters that are widely used to quantify such QoS level are:
- Latency defined as the end‐to‐end delay of the data.
- Bandwidth providing an aggregated data rate high enough to carry the traffic associated to the target application. In general, this would depend on the volume of devices as well as on the size of the exchanged packets and the traffic pattern.
- Reliability guaranteeing the correct performance during a given percentage of time: the more critical the application is, the higher such a percentage needs to be.
- Interoperability allowing equipment from different manufacturers to interact seamlessly. In order to achieve this goal, the main functional blocks comprising the communications infrastructure and the interfaces among them must be defined and standardized. Standardization is crucial for effectively achieving this goal, which eventually fosters competition and thus yields more reliable products at lower cost.
- Scalability dictates that the communication architecture must be able to incorporate new services, devices, and infrastructure upgrades.
- Privacy and security is presented in the form of both physical and cybersecurity. In SGs, various aspects of users' privacy, such as identification, authorization, and access control, are considered (Liu et al., 2012; Dalipi and Yayilgan, 2016; Billewicz, 2016). Therefore, impersonation, data tampering, malicious software, denial of service, and cyberattacks need to be addressed as main security issues in SGs (Bekara, 2014). Along with security, privacy is a major concern for data transmission in SGs (Dalipi and Yayilgan, 2016). Initiatives for data privacy in SGs provide a multi‐metrics approach to calculate system's privacy and dependability levels (Noll et al., 2015). Additionally, pseudo‐nymizing (or differential privacy) and cryptographic computation approaches can be used for preserving privacy for IoT‐enabled SGs (Chowdhery et al., 2015). An elliptic curve cryptography (ECC)–based session key technique was introduced to implement these approaches and gain an efficient authentication and access control (Ye et al., 2014). Because SG applications handle sensitive data, security and privacy represent key factors for their wide deployment and adoption. If privacy is not guaranteed, many users will not embrace the various new services. If security is not guaranteed, many service providers would not be implemented or rely on such new services. However, privacy and security are usually directly proportional to costs, so a trade‐off would be required in order to obtain feasible solutions.
As a result, it is crucial to evaluate how different communication architectures and technologies meet such requirements before undertaking the important investments needed to deploy infrastructures on a large scale.
Table 4.4 Protocol Stack in M2M/IoT Communication System (Elmangoush, 2016).
| Application layer | REST/SOAP/SIP | |||||||
| HTTP/HTTPS | MQTT/STOMP/AMQP | CoAP | ||||||
| Transport layer | TCP RCF 793 | UDP RCF 768 | ||||||
| Network layer | 6LoWPAN RCF 4944 | IPsec RCF 2401 |
IPv4 RCF 791, IPv6 RCF 2460 |
DSCP RCF 2474 |
||||
| Physical and data link layer | IEEE 802.15.4 |
Bluetooth v4.0 | IEEE 802.3 | WLAN 802.11 | WiMax IEEE 802.16 | 2.5G GPRS |
3G UMTS |
4G LTE 3GPP TF25.913 |
Recently, several divergent standards and protocols have been proposed for M2M communication and the IoT service platforms widely utilized in the SC concept implementation. Each protocol focuses on a specific aspect of M2M communication (Elmangoush, 2016). The lack of a protocol that can satisfy the heterogeneous requirements of M2M/IoT applications has resulted in a highly fragmented protocol stack in M2M/IoT systems as summarized in Table 4.4. Considering the variety in operating conditions and QoS requirements, it is impossible to depend on one protocol for all data streams or all applications. The core question that could be raised here is which transport protocol should be selected for a certain M2M application. In different studies (Smart Cities, 2007; Sun et al., 2014; Sun et al., 2015; Elmangoush, 2016), the introduced platform enables the dynamic adaptation for transporting heterogeneous traffic of M2M applications and mediation with other M2M platforms.

Figure 4.14 General architecture of M2M communication system in the smart city's infrastructure.
To impose the protocol stack of an M2M/IoT communication system of SG at the M2M reference architecture, a general framework of M2M communication system in smart city's infrastructure was developed, e.g., Figure 4.14 (Elmangoush, 2016). The major objective of this framework is to increase the adaptability of M2M nodes in transporting sequences of requests from connected objects under different conditions, e.g., resource‐constrained or resource‐rich environments and QoS requirements. In Elmangoush (2016), these conditions were integrated to the open machine‐type communication (OpenMTC) platform.
Currently, there is good momentum on M2M standardization efforts, which aim to achieve interoperability and compatibility in M2M systems independently of the vertical market solutions. Several standardization efforts related to M2M interactions in SGs have been carried out and have contributed to the current state of the art of this area (Elmangoush, 2016; IEEE. 2011; NIST, 2010; NIST, 2012; NIST, 2013; NIST, 2014).
From a structural point of view, the telecommunication network of a SG consists of three parts, namely, WAN, NAN, HAN (NIST, 2010; NIST, 2012; NIST, 2014, Bikmetov et al., 2015a; Bikmetov et al., 2016). Each segment of such networks transmits different amounts of data, which increases from the smallest (within HAN) to the largest (within WAN), and has a corresponding bandwidth capacity.
As a mainstay, WANs support bidirectional communication that maintains distributed automation and power quality management. All power generation stations, substations, and transformers as well as data concentrators (DCs) communicate with the energy service provider (ESP) through the WAN. Such a network can be deployed/configured using several wired or wireless broadband technologies, listed in Table 4.5 (Bikmetov et al., 2015; Bikmetov et al., 2014; Budka et al., 2014; Khan et al., 2014). For all these technologies, the transmission bandwidths are determined by underlying protocols and often vary over a wide range, e.g., from 172 kb/s for GPRS to 10 Gb/s for 10G EPON (Bikmetov et al., 2014; Budka et al., 2014; Khan et al., 2014). A final choice of communication technology for the WAN would depend on the particular requirements of the SG's design. The physical connection is often presented by wireless, copper, and optical fiber media. The medium access control (MAC) is mostly used to form a communication link.
Deployed in a single user domain, HANs offer users a convenient capability for direct power demand and response management through monitoring and control of the intelligent devices described above. In most cases, such demand management can be performed through the usage of smart meters (SMs) as gateways to the utility (NIST, 2013; IEEE Smart Grid, 2015; Bikmetov et al., 2014; Budka et al., 2014; Khan et al., 2014). In other cases, the interfaces of data concentrators are used as gateways. For this demand management, a meter data management system (MDMS) application is used from users' end. Since the amount of data generated within a single user system is quite small, most of the technologies implemented at HAN have a limited bandwidth (Bikmetov et al., 2014; Budka et al., 2014; Khan et al., 2014), as summarized in Table 4.5.
Table 4.5 Telecommunication Media and Protocols for SGs.
| WAN | NAN | HAN |
| Wi‐MAX (IEEE 802.16) | LoWPAN (IEEE 802.15.4) / PLC (IEEE 1901) / G.hn / Homeplug | |
| Cellular (GPRS/UMTS/LTE) | ||
| WLAN (IEEE 802.11 a/b/g/n) | ||
| 10GEPON (G.984) GPON | GPON | ADSL |
NANs are central entities of an advanced metering infrastructure (AMI) to provide the information, obtained by SMs and collected by DCs, to the WAN (Fang et al., 2012; NIST, 2010; NIST, 2012; Bikmetov et al., 2014; Budka et al., 2014; Khan et al., 2014). Most common communication technologies implemented in NAN are listed in Table 4.5. All of these technologies use open standards to provide scalability and flexibility for SG communications and can be developed for small range coverage networks (Bikmetov et al., 2014; Budka et al., 2014). Similar to WAN, the implemented protocols define the neighborhood area network (NAN) transmission bandwidth that has currently an upper limit of 1 Gb/s.
Since hybrid passive optical networks (HPONs) (Bikmetov et al., 2015a; Bikmetov et al., 2015b) have broader transmission bandwidth than wireless networks and other protocols implemented in SGs, HPONs are able to provide a large number of clients per distribution line (Figure 4.15) remaining scalable for future upgrades (Bikmetov et al., 2014; Gungor et al., 2011; Chen, and Mahloo, 2014). Besides, taking into account low losses in fiber distribution systems (≤0.2 dB/km), HPONs can perform and maintain a broadband (over 100 Gb/s per client) connection to the remote devices located at distances of more than 40 km from the central office (Bikmetov et al., 2014). It is well established now that HPONs have high cost‐efficiency (Chen, and Mahloo, 2014; Grobe et al., 2008; Dixit et al., 2011), which can be achieved using only passive components/elements in transmission paths and, on the other hand, by reducing the amount of components at the distribution control center (DCC) and optical network unit (ONU) modules in users' domains based on hybrid technology (Gungor et al., 2011; Chen et al., 2007a). The low cost of passive components (Chen, and Mahloo, 2014; Grobe et al., 2008; Dixit et al., 2011) and the significant reduction of spectral channels in the DCC and ONU modules with hybrid technology (Gungor et al., 2011; Chen et al., 2007a) in the transmission path provide the other key advantage of implementation of HPONs as telecommunication networks for SGs. The flexibility of protection schemes for HPONs is another advantage for their implementation (Bikmetov et al., 2014; Chen et al., 2007a; Chen et al., 2007b).

Figure 4.15 Schematic topology of a hybrid passive optical network (HPON) for an advanced metering infrastructure (AMI). HPON is implemented as a backbone network. Wireless, microwave, and free space optics technologies are considered for distribution and access networks.
The scheme in Figure 4.15 shows a part of the general topology of the HPON for a SG, where the passive optical network (PON) is considered as a backbone. The distribution and access telecom networks are presented by hybrid (with PON) communication technologies: wireless, microwave, power line connections (PLC), and free space optics (FSO). Each SM gathers its data from the group of sensors with the corresponding interface (Bikmetov et al., 2015a; Bikmetov et al., 2015b). The final choice of communication technology for distribution and access networks will depend on a certain location and requirements of users and on the density of users' domain. For instance, PLC can be used for areas with low density of population and a well‐developed cable infrastructure. On the other hand, wireless technologies can be implemented for densely populated territories with limited space. In the presence of a clear line of sight between the transmitting sensor and the access point, FSO communications will have an edge. The main advantage of this topology is the ability to maintain a continuous bidirectional information flow with a large bandwidth capacity (Bikmetov et al., 2015a; Bikmetov et al., 2015b).
4.3.3 Layered Structure of Machine‐to‐Machine Communications
Figure 4.16 shows the European Telecommunications Standards Institute (ETSI) board of directors architecture for a SG, which is formed by three main layers: the energy layer supporting production, distribution, transmission, and consumption; the control layer; and the service layer (European Telecommunications Standards Institute, 2012). The energy layer includes a large amount of sensors, electricity storage systems, and transmission and distribution systems and corresponds to the machine‐to‐machine (M2M) device domain in an M2M framework. The control layer connects the energy plane to the service plane and relates to the M2M network domain. Finally, the service layer provides all the SG‐related services and corresponds to the M2M application domain in the M2M network architecture. All the architectural components located at the control layer can communicate with each other based on the developed standards, which are shown in Table 5 and Table 6, defining such M2M interactions. The corresponding interfaces of these components will follow these standards. In other words, the M2M infrastructure allows mapping the developed standards onto corresponding hardware implementation.
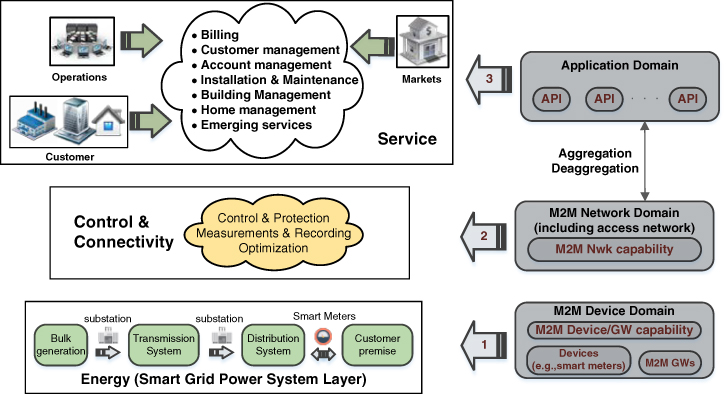
Figure 4.16 The structure of machine‐to‐machine (M2M) network for smart grids according to the European Telecommunications Standards Institute (ETSI). M2M domains are mapped onto the smart grid main layers.
Smart buildings such as offices rely on a set of technology to enhance energy efficiency and user comfort factors as well as for monitoring and safety of the building. The M2M technology and wireless sensor and actuator networks (WSANs) are used in the building management system for lighting and heating, ventilation, and air conditioning (HVAC). They identify empty offices and then switch off devices such as monitors, lighting, and related IT peripherals and enable security and access systems.
Table 4.6 summarizes various wireless technologies for machine‐to‐machine (M2M) communications along with their attributes, advantages, and limitations. It is important to notice that the main requirement of the M2M devices in a home and office environment is their very low power consumption and advantage of mobility. That is because many devices can last years without requiring battery replacement. With the wide range of home/office devices that need to be networked, there is a need to support several different physical layer links.
Table 4.6 M2M Wireless Technologies and Standards Implemented in a SG (López et al., 2014; Elmangoush, 2016).
| 802.15.4 (ZigBee/6LoWPAN) | Bluetooth/bluetooth low energy (LE) | 802.11 (Wi‐Fi) | |
| Max data rate | 250 kb/s | 3 Mb/s (enhanced) 1 Mb/s (basic or LE) |
22 Mb/s (802.11 g) 144 Mb/s (802.11 n) |
| Indoor range | 10–20 m | 1, 10, and 100 m classes, 5–15 m (LE) |
45 m |
| Power | Low | medium low (LE) | high |
| Battery life | Years | days years (LE) | hours |
| Frequency band | 2.4 GHz 868 MHz and 915 MHz |
2.4 GHz | 2.4 GHz, 3.6 GHz, and 5 GHz |
| Channel access | CSMA/CA (non‐beacon based) or superframe structure (beacon based, non‐contention) | frequency hopping or CSMA/CA |
CSMA/CA |
| Applications | smart appliances smart meters lighting control home security office automation |
voice smart meters data transfer game control health monitoring computer peripheral |
networking between WAN and customer premises (M2M area networks) digital audio/voice |
Among different networking technologies, Ethernet, 802.15.4, Wi‐Fi, Bluetooth, power line communications (PLC), and cellular all have a place in the home networking environment. The home M2M network will have to support all the different physical links and protocol stacks through the M2M gateways. The gateways also need to be equipped with corresponding interfaces for gathering information on what processing and energy resources are available in the M2M devices (usually with limited resources) and decide on how to disseminate data to optimize the resources. In general, the gateway capabilities include routing, network address translation (NAT), authentication, resource allocation, and so forth. Other capabilities of the M2M gateway are addressing remote entity management, security, history and data retention, transaction management, interworking proxy, and compensation brokerage. Smart building systems with wireless sensor and actuator networks (WSANs) are also expected to learn from the building environment and adapt the monitoring and control functions accordingly.
The right side of Figure 4.16 provides a graphical overview of how the three domains of the European Telecommunications Standards Institute (ETSI) M2M reference architecture are mapped onto a SG (López et al., 2014). The implementation of ETSI M2M communications architecture to SG scenarios is also described in Lu et al. (2012). Based on the layout of the SG's telecommunication network architecture, these domains can be imposed with corresponding parts of this architecture and presented as the overall system (Figure 4.17). Figure 4.17 shows the architecture of this system based on the information and communications technologies (ICT) platform developed under the scope of the European Union (EU) Framework Program 7 (FP7) project called Energy Saving Information Platform (ENERsip) (López et al., 2012). This project enables electricity consumption, energy costs savings, and proper integration of DERs (distributed energy resources) at the neighborhood level.
As is evident from Figure 4.17, the overall M2M system architecture for SGs is divided into four domains, which represent the main pillars from the ICT perspective (López et al., 2014). The building domain comprises the physical infrastructures owned by the customers of the power distribution grids, including consumption and generation equipment and the sensor and actuator networks (SANs) to monitor and control them.
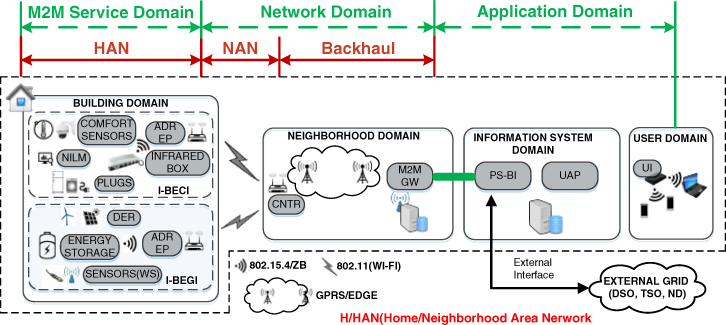
Figure 4.17 Overall system architecture, highlighting the relation with the standardization work.
The user domain (UD) encompasses the means through which the users and the system interact. Within the UD, energy efficiency can be achieved both through automated actions (e.g., demand response event) and by influencing users' behaviors. Thus, it is crucial to present information to the user in an easily understandable way. Also, the tools provided to the users for making their decisions should be user‐friendly. The available applications may run in smartphones, tablets, or even in smart TVs.
The information system domain represents the “brain” of the system from the energy perspective, comprising the logic that allows the optimal use of the available resources at the neighborhood level at any time. Gathering the consumption and generation data of the same location or district at a given moment of time and processing them all together allows reaching global optimizations at the neighborhood level. It is more comprehensive than local optimizations at the household level, as it is the case in state‐of‐the‐art home energy management systems (HEMSs) (Bikmetov et al., 2016; Perera, Halstensen, and Skeie, 2015; Hassoun and Dincer, 2015; Wu and Xu, 2013; Rafiqul, St‐Hilaire, and Kunz, 2014). Additionally, since the users are still allowed to configure a set of parameters and thresholds and they are taken into account when running the optimization algorithms, local optimizations can also be reached.
The neighborhood domain represents the “workforce” of the system and encompasses the core communications infrastructure that carries data and commands back and forward, allowing that everything works correctly. Thus, the information system domain and the user domain are related with IT, whereas the building domain and the neighborhood domain are tightly related with mutual communications. As a matter of fact, the M2M communications architecture addressed in this chapter is spread across the latter domains, as illustrated in Figure 4.19.
The consumption and generation infrastructures are named as in‐building energy consumption infrastructures (I‐BECIs) (Carreiro et al., 2011) and in‐building energy generation infrastructures (I‐BEGIs) (López et al., 2013), respectively. I‐BECIs and I‐BEGIs may or may not be combined, giving rise to different profiles of customers:
- Consumers: users whose households or buildings are only composed of I‐BECIs.
- Producers: users whose infrastructures comprise only I‐BEGIs connected to the grid.
- Prosumers (Jablonska, 2014): those who own the so‐called energy‐positive households or buildings, which integrate both I‐BECIs and I‐BEGIs.
Every I‐BECI and I‐BEGI is equipped with the so‐called automatic demand response end point (ADR‐EP). The ADR‐EPs work as communications gateways, aggregating and sending consumption or generation data and routing commands to the appropriate device(s). The ADR‐EPs communicate directly with their associated concentrator. A given concentrator manages a group of ADR‐EPs, forwarding the data coming from them and routing commands to the appropriate ADR‐EP(s). Lastly, the M2M gateway has the global picture of the M2M communications infrastructure and works as operation support system (OSS), performing tasks such as network inventory, network components configuration, fault management, or service provisioning, as well as communications gateway to the information system (López et al., 2011).
As Figure 4.17 also illustrates, the communication within I‐BECIs and I‐BEGIs is based on IEEE standard 802.15.4/Zigbee. The communication between ADR‐EPs and concentrators is based on user datagram protocol/Internet protocol (UDP/IP) on top of IEEE 802.11; and the communication between the concentrators and the M2M gateway is based on transmission control protocol (TCP/IP) on top of general packet radio service (GPRS). López et al. (2011) explain why these communications technologies are chosen.
The M2M communications architecture proposed in López et al. (2014) can be mapped onto the communications technologies of interoperability architectural perspectives (CT‐IAP) of the overall IEEE 2030 smart grid interoperability reference model (SGIRM), as shown in Figure 4.17 in the continuous line of red arrows. The I‐BECIs and the I‐BEGIs represent the HANs, and the ADR‐EP provides the functionality of the energy service interface (ESI); the communications segment comprising the ADR‐EPs and the concentrators represents the NAN; and the communications segment composed by the concentrators and the M2M gateway represents the backhaul.
In a dashed line, Figure 4.17 also shows the relationship between the M2M domains defined by ETSI (European Telecommunications Standards Institute, 2012). The SANs within the I‐BECI and I‐BEGI can be seen as capillary networks at the customer domain. The M2M communications architecture can be shown in two main sites (Figure 4.18) (Lu et al., 2012): M2M core and M2M devices are connected through corresponding communication networks. Each site consists of parts that belong to SG conceptual model (NIST, 2010; NIST, 2012).

Figure 4.18 Mapping of the proposed M2M communications architecture onto the European Telecommunications Standards Institute (ETSI) M2M architecture applied to the Smart Grid.
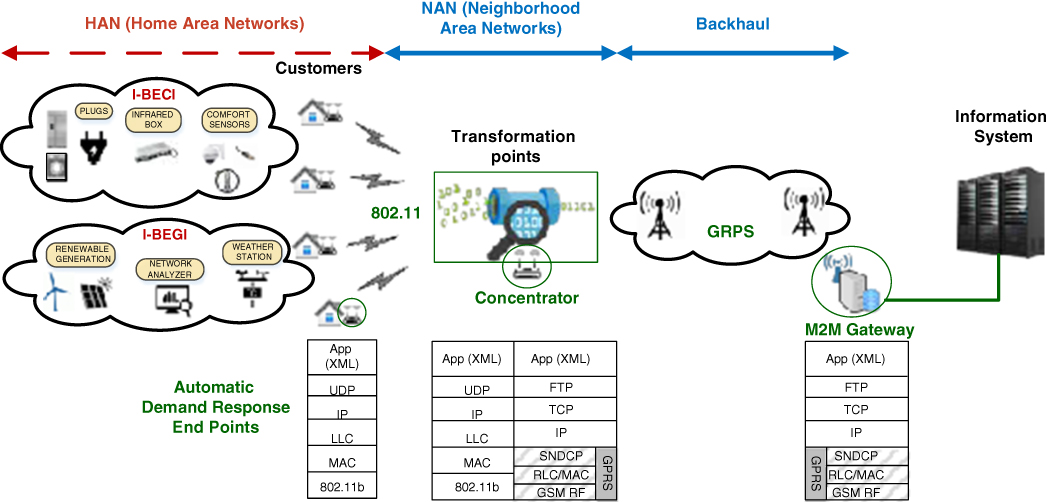
Figure 4.19 Mapping of the proposed M2M communications architecture onto the power distribution infrastructure.
Figure 4.19 shows a mapping of the proposed M2M communications architecture onto the power distribution infrastructure (López et al., 2014). In this figure, the automatic demand response end points are associated to the customers and the concentrators, which are also associated to the transformation points or feeders.
The M2M gateway is logically associated to the substation that manages the target neighborhood. However, using GPRS as backhaul technology allows the M2M gateway to be physically located at the substation or the data centers of the entity operating the platform: distributed system operator, retail electric provider, aggregator (López et al., 2014; European Commission, 2011; European Telecommunications Standards Institute, 2012; Lu et al., 2012).
The significance of M2M communication in SGs follows from the numerous benefits that it brings. First, real‐time M2M communication establishes a close interaction between energy users and the ESPs, which in turn allows to reduce the retail energy price and improve the efficiency of energy generation, transmission, and distribution (Bikmetov et al., 2015b; Bikmetov et al., 2016; Perera, Halstensen, and Skeie, 2015; Federal Energy Regulatory Commission, 2017; Castro, Jara, and Skarmeta, 2013; Shelby, 2010; Bikmetov et al., 2017; Ramallo‐Gonzáleza, 2015; Ji, et al., 2016; Harish and Kumar, 2016). Advanced data analytics enabled by M2M communication in combination with IoT sensing is the other major benefit. The main applications of this benefit are proactive decision‐making (e.g., demand response management by ESP) and future electricity price forecasting in SGs (Castro, Jara, and Skarmeta, 2013; Shelby, 2010; Donitzky et al., 2016; Wan et al., 2014; Rafiei et al., 2017; Liu et al., 2015; Vayá, and Andersson, 2015; Gungor et al., 2010). Additionally, the self‐healing feature of SGs enabled by implementation of M2M communications increases the grid's reliability and improves its resiliency to failures (Ye et al. 2014).
4.4 Optimization Algorithms for Energy Production, Distribution, and Consumption
One of the latest achievements in the areas of distributed intelligence and M2M communication is a vast implementation of IoT sensors and emerging fusion in various aspects of the SC concept (Zanella et al., 2014; European Telecommunications Standards Institute, 2012; Jin et al., 2014; López et al., 2011; Lu et al., 2012). Utilization of SGs in the SC model (Figure 4.20) allows vast reduction of energy generated by traditional sources and high penetration of “green energy” (Xi et al., 2012; Igualada et al., 2014; Comodi et al., 2015; Yoon et al., 2014). These facts in turn lead to cost‐efficient energy distribution and anticipated reduction of carbon dioxide emission. However, an overall demand of electric energy is still constantly growing in all sectors of the prototypical SC (Bikmetov et al., 2015b; Bikmetov et al., 2016; Igualada et al., 2014; Erol‐Kantarci and Mouftah, 2015; Soroudi et al., 2016; Vardakas et al., 2015).
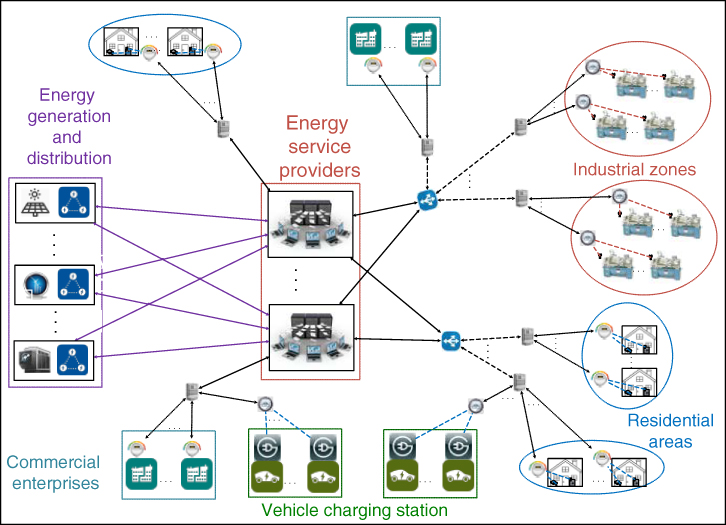
Figure 4.20 A typical architecture of a smart grid in the smart city paradigm.
In order to improve the environment, a further reduction of carbon dioxide footprint in the atmosphere, efficient energy generation and distribution within SGs, the ESPs should be in a close and continuous interaction with the users. Such interaction can be established based on M2M communication and could reduce the requisite energy price and improve the efficiency of generation and distribution by renewables and traditional energy sources (see Figure 4.4) (Bikmetov et al., 2015a; Bikmetov et al., 2015b; Jin et al., 2014). Besides, IoT‐friendly advanced metering infrastructure (AMI) supported by optimized telecommunication networks architecture is crucial in achieving these goals (Fang et al., 2012; CEN, CENELEC, and ETSI, 2012; Bikmetov, 2015a; Bikmetov, 2015b; Bush, 2013 European Telecommunications Standards Institute, 2012; Elmangoush, 2016; Rana and Li, 2015; Industrial Internet Consortium, 2018; Bikmetov et al., 2015.
There are several applications for optimization algorithms implementation within SGs. The major applications include energy consumption management for various types of users (residential, commercial, and industrial) that further developed into the “demand‐response” (DR) concept, distributed multi‐generation, real‐time electricity pricing control, and home energy management based on comfort control.
In Liu et al. (2016), energy consumption management is performed based on dividing demands into essential and flexible, which are further categorized into delay sensitive and delay tolerant, classified by priorities based on historically given probabilities. In that work, an optimization problem is formulated to minimize the total electricity cost and the operation delay of flexible demands by obtaining the optimal energy management decisions. This problem was solved by a combination of centralized and distributed algorithms that were designed for practical implementation at neural networks (Liu et al., 2016). The optimal energy management method for residential buildings considering comfortable lifestyle was developed in Anvari‐Moghaddam et al. (2015) using multi‐objective mixed integer nonlinear programming model. A “thermal comfort zone” algorithm was utilized to ensure an optimal task scheduling. The optimization problem was formulated to minimize the cost of the energy drawn from the external grid, while the usage of energy from internal grid (user's renewable sources and battery storage) for appliances is subject to individual delay constraints and a long‐term average delay constraint. The developed algorithm requires some prediction of electricity prices assuming that energy can be sold from the battery to the grid.
A comprehensive framework was set up in Mancarella and Chicco (2013) to analyze distributed multi‐generation (DMG) systems for the purpose of identifying and quantifying their potential to participate in real‐time DR methodology and programs. In this work, the novel concept of electricity shifting potential is deployed within the DMG system to establish the upper limit for the possible reduction of the electricity flowing from the electrical grid to this system without affecting customers comfort level and experience (Mancarella, and Chicco, 2013). A third‐party energy consumption control for a group of users was considered in Salinas et al. (2013) or formulation of the load‐scheduling problem as a constrained multi‐objective optimization problem (CMOP). The optimization objectives were to minimize energy consumption cost and to maximize the efficiency of a certain utility, which can be conflicting and non‐commensurable. The modeling of an intelligent energy control center (ECC) for DGs using a multi‐agent system has been presented in Manickavasagam (2015). In this work, a multi‐agent system has been proposed to provide intelligent energy control and management in SGs based on the following benefits: extensibility, autonomy, and reduced maintenance. The DER model was created in a client and the ECC was created in the server. Communication between the server and clients is established using transmission control protocol/internet protocol (TCP/IP) (Manickavasagam, 2015). The results show that the agent‐controlling DER can be achieved from the server and clients.
In Qian et al. (2013), DR management is performed by a real‐time pricing scheme that reduces the peak‐to‐average load ratio in SG systems. The proposed scheme addresses a two‐stage optimization problem. On one hand, users react to prices announced by the retailer and maximize users' payoff. On the other hand, the retailer designs the real‐time prices in response to the forecast user reactions to maximize its profit (Qian et al., 2013). To implement such scheme, a simulated‐annealing‐based price control (SAPC) algorithm is developed and used to solve the nonconvex price optimization problem (Qian et al., 2013). To address spatial and temporal constrains of DR, a distributed optimization algorithm based on dual decomposition without revealing user's private information was developed (Deng et al., 2015). A quick performance of this algorithm was obtained by implementation of binary search. The scheme proposed in Lampropoulos et al. (2013) captures the operational planning, the real‐time operations, the verification of the energy and service provision, and the financial settlement. In this study, the emphasis is given to the real‐time operations, where the convergence of DR system under load frequency control is investigated (Lampropoulos et al., 2013).
Dynamic electrical load scheduling and corresponding energy capacity planning are the other important techniques for energy distribution optimization in SGs (Bikmetov et al., 2015a; Bikmetov et al., 2015b; Bikmetov et al., 2016). These techniques can be implemented based on real‐time pricing schemes, which can be modeled relying on users' preferences and availability of energy from various sources in a SG (Bikmetov et al., 2015a; Bikmetov et al., 2015b; Bikmetov et al., 2016).
4.5 Machine Learning Techniques in Efficient Energy Services and Management
As described previously in Sections and , intelligent communication and networking must be designed to support SG's functionality (Figure 4.12). Utilization of these components of SG's architecture involves the development of artificial intelligence and machine learning techniques for the SGs highlight (Bush, 2013; Livani and Evrenosoglu, 2014; Li and Jayaweera, 2015) [119–120]. The main role of these techniques is to benefit from advances in machine intelligence via M2M and IoT interaction. During the past decade, M2M communication, the semantic web, cognitive radio, and cognitive networking served as attempts to incorporate intelligence into communication and, as an extension of it, into the SG concept (Figure. 4.3) (Bush, 2013; Li and Jayaweera, 2015) [119]. The fundamental nature of intelligence and communications implemented in the form of machine learning techniques plays a key role in power system information theory as the power grid itself becomes more active and “smart” (Bush, 2013; Livani and Evrenosoglu, 2014; Li and Jayaweera, 2015) [119].
One of the purposes of machine learning implementation in SGs is to create an effective algorithm selection between power system control algorithms depending on the state of a network. Such functionality can achieve better performance than the utilization of the same algorithm for every state (Bush, 2013) [119]. A novel method for creating algorithm selectors for power flow management on the IEEE 14‐ and 57‐bus networks has been discussed in King et al. (2015). According to this method, the selectors were chosen from a diverse set of power flow management algorithms based on constraint satisfaction, optimal power flow, power flow sensitivity factors, and linear programming. The benefits of the developed method include minimization of overloads number and the curtailment applied to generators [119].
The other purpose of machine learning implementation in SGs is a real‐time decision‐making framework that can be effectively integrated with demand response schemes (see Section ) that are prediction based and therefore inevitably lead to real‐time power‐load mismatches. To implement this functionality, the Baum‐Welch algorithm based on Markov chains was adopted in Li and Jayaweera (2015) to learn the nonstationary dynamics of the environment. Instead of iterating the value function in each time step, the representational parsimonious sets were iterated by using the incremental pruning algorithm. The developed complex framework leads to optimal policies giving maximum rewards for the smart homes. A low‐complexity real‐time decision‐making framework that allows adaptive incorporation of new observations, such as environment changes and weather conditions, was developed by the same research group.
Another area of machine learning implementation in SGs is automatic fault locations. In one of the most recent research works (Livani and Evrenosoglu, 2014), a single‐ended traveling wave‐based fault location method was developed for a hybrid transmission line, an overhead line combined with an underground cable. A discrete wavelet transformation technique was used for extraction of transient information from the measured voltages. The developed method is based on support vector machine (SVM), a machine learning technique (Livani and Evrenosoglu, 2014). As an extension of automatic fault location application, automatic early warning generation methods can be developed based on machine learning techniques. The development of these methods is very important in case of any grid disturbances, such as line contingency leading to cascade failure. A proactive blackout prediction model for a smart grid early warning system was proposed in Gupta et al. (2015) [120]. In this model, the probabilistic evaluation of system's performance is completed in steady state and under dynamical (line contingency) state that prepares a historical database for normal and cascade failure states. As in Livani and Evrenosoglu (2014), a SVM has been “educated” with this historical database and is used to predict blackout events and cascading failure in advance. A proactive prediction of cascading failure can significantly increase the resilience of SGs.
Machine learning techniques were not the focus of this chapter. Useful information about machine learning implementation in SGs can be extracted from the cited references and other specialized literature [121–126].
4.6 Future Perspectives
M2M communications in SGs is a fast‐evolving field with numerous possibilities: smart metering, control of energy generation, transmission, and distribution, etc. After the description of this topic from various perspectives—reference architecture, layered structure, telecommunication media and protocols—there are several issues that outline the basis for future work.
Widely implemented in SGs, wireless communication systems including 3G and LTE cannot satisfy high demands of M2M services (Gungor et al., 2011; Usman and Shami, 2013) [127]. Being designed for SGs, 5G systems will accumulate multiple radio access technology networks (including LTE), with an increased flexibility in radio resource utilization. This combined architecture can enable the prioritization of immense M2M traffic, which allows meeting the ultra‐low end‐to‐end latency requirements existing in SGs [128].
Within 5G systems, massive machine communications (MMC) can be considered as three different radio access types implemented for SGs [121]: MMC‐D, MMC‐A, and MMC‐M. MMC‐D is defined by a direct connection to the access network that is further used for communication between M2M devices. In MMC‐A, M2M devices communicate through a connection to the access network via an accumulation point (dedicated gateway, smartphone connecting personal devices, or other dynamically selected device) collecting local traffic. MMC‐M is a direct device‐to‐device (D2D) communication between M2M devices (Elmangoush, 2016). All these state‐of‐the‐art architectures of MMC are optimized for specific applications [129]. The MMC‐D type is the most suitable for devices with a high level of transmitting power, while the MMC‐A solution is more common to be used for low‐power devices. All the described types of MMC require a very high protocol efficiency (i.e., very low signaling overhead) and devices with long battery life. These aspects are open research issues that need to be addressed for the realization of MMC and should also bring significant improvements in development of emergency applications, such as vehicle‐to‐vehicle communication [130].
Security is another important characteristic of M2M communications implementation in SGs. Due to a quick integration of IoT in home appliances and commercial and industrial equipment and devices, new vulnerabilities arise almost daily [131]. Several cryptographic protocols designed for computer networks could be used to form authenticated and encrypted connections between M2M nodes (Dalipi and Yayilgan, 2016; Bekara, 2014) [132]. However, such protocols have been initially designed for the Web and entail further adaptation for their usage on embedded devices, which are very resource limited.
4.9 Appendix
Table 4.7 Standards identified by NIST “Framework and Roadmap for Smart Grid Interoperability” (NIST, 2014).
| Standard | Application | Domains of SG | |
| ANSI | C12.1 | Establishes acceptable performance criteria for new types of smart meters, demand meters and registers, pulse and auxiliary devices. Describes acceptable in‐service performance levels for meters and devices used in revenue metering. | Customer, service provider |
| C12.18 | Revenue metering end device tables. | Customer, service provider | |
| C12.19 | Electricity meters—0.2 and 0.5 accuracy classes. | Customer, service provider | |
| C12.20 | Transport of measurement device data over telephone networks. | Customer, service provider | |
| C12.21 /IEEE 1702 | Protocol and optical interface for measurement devices. | Customer, service provider | |
| /ASHRAE 135/ISO 16484‐5 BACnet | Defines an information model and messages for building communications at a customer's site. Incorporates a range of networking technologies, using IP protocols, to provide scalability from very small systems to multi‐building operations that span wide geographic areas. | Customer | |
| IEC | 60870‐6 ‐503 | Performs Telecontrol Application Service defining the messages sent between control centers of different utilities. | Transmission, distribution |
| 60870‐6‐702 | Defines a standard profile specifying which services and objects are mandatory and optional for compliance with the standard for implementing the application, presentation, and session layers. For a complete protocol implementation, this profile links to a connection‐oriented transport profile specifying the transport, network, and data link layers. | Transmission | |
| 60870‐6‐802 | Formerly known as inter control center protocol (ICCP), the standard is used for communication of electric power system status and control messages between power control centers. | Transmission | |
| 61850 Suite | Defines communications within transmission and distribution substations for automation and protection. It is being extended to cover communications beyond the substation to integration of distributed resources and between substations. | Transmission, distribution |
|
| 61968/61970 Suites | Define information exchanged among control center systems using common information models: application‐level energy management system interfaces and messaging for distribution grid management in the utility space. | Operations | |
| IEEE | 1815 (DNP3) | Used for substation and feeder device automation, as well as for communications between control centers and substations. | Generation, transmission, distribution, operations, service provider |
| C37.118.1/2 | Defines phasor measurement unit (PMU) performance specifications and communications for it. | Transmission, distribution | |
| C37.238 | Ethernet communications for power systems |
Transmission, distribution | |
| C37.239 | Defines a common format for interchange of power system event data | Transmission, distribution |
|
| 1547 Suite | Defines physical and electrical interconnections between the grid and distributed generation and storage. | Transmission, distribution, customer |
|
| 1588 | Standard for time management and clock synchronization across the Smart Grid for equipment needing consistent time management. | Transmission, distribution |
|
| 1901/ ITU‐T G.9972 | Broadband over power line networks for home networking: medium access control and physical layer. | Customer | |
| NAESB | REQ18, WEQ19 | The standards specify two‐way flows of energy usage information based on a standardized information model. |
Customer, service provider |
| REQ‐21 | Enables retail customers to share energy usage information with third parties who have acquired the right to act in this role. | Customer, service provider |
|
| OASIS | Energy interoperation | An information model and a communication model to enable demand response and energy transactions. | Markets |
| Energy market information eXchange | An information model to enable the exchange of energy price, characteristics, time, and related information for wholesale energy markets, including market makers, market participants, quote streams, premises automation, and devices. | Markets | |
| NEMA SG‐AMI | Used by smart meter suppliers, utility customers, and regulators to guide both development and decision making in smart meter upgradeability. |
Customer, distribution |
|
| OPC‐UA industrial | A platform‐independent specification for a secure, reliable, high‐speed data exchange based on a publish/ subscribe mechanism |
Customer | |
| Open automated demand response (OpenADR) | Specification of messages exchanged between the demand response (DR) service providers and customers for price‐responsive and reliability‐based DR. | Operations, service providers | |
| CEA‐852.1 | Provides a way to tunnel local operating network messages through an IP network using the user datagram protocol (UDP), thus providing a way to create larger internetworks | Customer, service provider | |
| Smart energy profile 2.0 | Home area network (HAN) device communications and information model. | Customer | |
References
- 26th Annual Conference and Expo, 2015, URL: http://26th‐annual‐conference.energystorage‐events.org/agenda/26th
- Adinolfi, G., Cigolotti, V., Graditi, G., and Ferruzzi G., 2013, ‘Grid integration of distributed energy resources: Technologies, potentials contributions and future prospects’.
- Al‐Fuqaha, A., Guizani, M., Mohammadi, M., et al., 2015, ‘Internet of Things: A Survey on Enabling Technologies, Protocols, and Applications’, IEEE Communications Surveys & Tutorials 17, 2347–2376.
- Ali, S., Wu, K., Weston, K., and Marinakis, D., 2016, ‘A Machine Learning Approach to Meter Placement for Power Quality Estimation in Smart Grid’, IEEE Transactions on Smart Grid 7, 1552–1561.
- Andersen, P.B., Poulsen, B., Decker, M., Træholt, C., and Østergaard, J., 2008 , ‘Evaluation of a generic virtual power plant framework using service oriented architecture’, In: IEEE PECon'08, 1212–1217.
- Anvari‐Moghaddam, A., Monsef, H., and Rahimi‐Kian, A., 2015, ‘Optimal Smart Home Energy Management Considering Energy Saving and a Comfortable Lifestyle’, IEEE Transactions on Smart Grid 6, 324–332.
- Ardito, L., Procaccianti, G., Menga, G., and Morisio, M., 2013, ‘Smart grid technologies in Europe: An overview’, Energies 6, 251–281.
- Bekara, C., 2014, ‘Security Issues and Challenges for the IoT‐based Smart Grid’, Procedia Computer Science 34, 532–537.
- Bikmetov, R., Raja, M.Y.A., and Kazi, K., 2017, ‘Machine‐to‐Machine Communications in the Smart City — A Smart Grid Perspective’, In: Transportation and Power Grid in Smart Cities: Communication Networks and Services, H. Mouftah, M. E. Kantarci, and M. H. Rehmani, Eds., UK: John Wiley.
- Bikmetov, R., Raja, M.Y.A., et al., 2015b, ‘Efficiency and robustness capabilities of MGs with AMI using dynamic algorithm of energy consumption prediction’, IEEE Explore.
- Bikmetov, R., Raja, M.Y.A., Kazi, K., et al., 2015, ‘A perspective of RoF implementation for an advanced Smart Metering Infrastructure’, In: North American Power Symposium (NAPS), Charlotte, US, 1–4.
- Bikmetov, R., Raja, M.Y.A., Kazi, K., Sane, T.U., and Shevchenko, N., 2016, ‘Dynamic energy capacity planning for distributed resources in Smart Microgrids’, In: 2016 HONET‐ICT, 159–163.
- Bikmetov, R., Raja, Y., et al., 2014, ‘Role of PONs with the conventional communication systems used in today's smart‐ and MicroGrids’, presented at HONET 2014, U.S.
- Bikmetov, R., Raja, Y.M.A., Kazi, K., Chowdhury, B., and Enslin, J., 2015a, ‘Dynamic Prediction Capabilities of Smart Metering Infrastructure’, In: North American Power Symposium (NAPS), Charlotte, NC, USA.
- Billewicz, K., 2016, ‘Possibility of Internet of things technology implementation in smart power grids’, Energetyka , 264–270.
- Budka, K. et al., 2014, Communication Networks for Smart Grids: Making Smart Grid Real. Springer 2014, ISBN 978-1-4471-6302-2
- Bush, S.F., 2013, ‘Machine Intelligence in the Grid’, Smart Grid, Wiley‐IEEE Press (eBook).
- Campbell, A.T. et al., 2008, ‘The rise of people‐centric sensing’, IEEE Internet Comput. 12, 12–21.
- Campbell, A.T., Eisenman, S.B., Lane, N.D., Miluzzo, E., and Peterson, R.A., 20116, ‘People‐centric urban sensing’, In: 2nd Annual Int. Workshop Wireless Internet (WICON), New York, NY, USA.
- Carreiro, A., López, G., Moura, P., et al., 2011, ‘In‐house monitoring and control network for the Smart Grid of the future’, In: IEEE PES International Conference and Exhibition on Innovative Smart Grid Technologies, Manchester, UK, 2011, 1–7.
- Castro, M., Jara, A.J., and Skarmeta, A.F., 2013, ‘Smart Lighting Solutions for Smart Cities’, presented at the 27th International Conference on Advanced Information Networking and Applications, 2013.
- CEN, CENELEC, and ETSI, 2012, ‘Smart Grid Reference Architecture—Annex F: Communication Architecture’, In: Standardization mandate M/468 , ed. Brussels, Belgium: EC.
- CEN, CENELEC, and ETSI, 2012, ‘Smart Grid Reference Architecture’, In: Standardization mandate M/468 , ed. Brussels, Belgium: EC.
- Chen, J. and Mahloo, M., 2014, ‘Toward Reliable Hybrid WDM/TDM Passive Optical Networks’, IEEE Communication Magazine 52, 14–23.
- Chen, J. et al., 2007a, ‘Analysis of Protection Schemes in PON Compatible with Smooth Migration from TDM PON to Hybrid WDM/TDM PON’, Opt. Net. 6.
- Chen, J. et al., 2007b, ‘A Novel Protection Scheme for a Hybrid WDM/TDM PON’, Proc. SPIE, Network Architectures, Management, and Applications 6784.
- Chowdhery, A., Bahl, V., Mahajan, R., et al., 2015, ‘Privacy‐preserving Data‐aggregation for Internet‐of‐things in Smart Grid’, In: IEEE Rising Stars Conference, 2015.
- Chrysoulas C., and Fasli, M., 2016, ‘A service oriented QoS architecture targeting the smart grid world & machine learning aspects’, In: 2016 International Multidisciplinary Conference on Computer and Energy Science (SpliTech), 1–6.
- Comodi, G., Giantomassi, A., Severini, M., et al., 2015, ‘Multi‐apartment residential microgrid with electrical and thermal storage devices: Experimental analysis and simulation of energy management strategies’, Applied Energy 137, 854–866.
- Corici, A., Ancuta, A., Shrestha, R., et al., 2015, ‘A solution for provisioning reliable M2M infrastructures using SDN and device management’, In: 3rd International Conference on Information and Communication Technology (ICoICT), 2015, 81–86.
- Dalipi, F. and Yayilgan, S.Y., 2016, ‘Security and Privacy Considerations for IoT Application on Smart Grids: Survey and Research Challenges’, IEEE Xplore, 63 ‐ 68.
- Deng, R., Xiao, G., Lu, R., and Chen, J., 2015, ‘Fast Distributed Demand Response With Spatially and Temporally Coupled Constraints in Smart Grid’, IEEE Transactions on Industrial Informatics 11, 1597–1606.
- Dietrich, K., Latorre, J.M., Olmos, L., and Ramos, A., 2012, ‘Demand Response in an Isolated System With High Wind Integration’, IEEE Transactions on Power Systems 27, 20–29.
- Dixit A. et al., 2011, ‘Flexibility Evaluation of Hybrid WDM/TDM PONs’, presented at the IEEE Int'l. Conf. Advanced Networks and Telecommun. systems, 2011.
- Dohler, M., Boswarthick, D., and Alonso‐Zárate, J., 2012, ‘Machine‐to‐machine in smart cities & smart grids’, in IEEE Global Communications Conference, Anaheim, CA, USA, 2012.
- Donitzky, C., Roos, O., and Sauty, S., 2016, ‘A Digital Energy Network: The Internet of Things & the Smart Grid’, URL: https://www.intel.com/content/dam/www/public/us/en/documents/white‐papers/iot‐smart‐grid‐paper.pdf.
- Elmangoush, A.A., 2016, ‘Application‐derived Communication Protocol Selection in M2M Platforms for Smart Cities’, Ph.D., Electrical Engineering and Computer science, Technical University of Berlin, Berlin, Germany.
- Erol‐Kantarci, M. and Mouftah, H.T., 2015, ‘Energy‐Efficient Information and Communication Infrastructures in the Smart Grid: A Survey on Interactions and Open Issues’, IEEE Communications Surveys & Tutorials 17, 179–197.
- Esmalifalak, M., Liu, L., Nguyen, N., et al., 2014, ‘Detecting Stealthy False Data Injection Using Machine Learning in Smart Grid’, IEEE Systems Journal. PP, 1–9.
- Eurobat, 2013, ‘Battery Energy Storage for Smart Grid Applications’.
- European Commission (EC), 2011, ‘Standardisation Mandate to CEN, CENELEC and ETSI Concerning the Charging of Electric Vehicle’, In: Standardization mandate M/468 , ed. Brussels, Belgium: EC.
- European Telecommunications Standards Institute (ETSI), 2012, ‘Applicability of M2M Architecture to Smart Grid Networks. Impact of Smart Grids on M2M Platform’, Sophia‐Antipolis, France.
- Fadlullah, Z.Md. and Kato, N., 2015, ‘Evolution of Smart Grids’, Springer Briefs in Electrical and Computer Engineering.
- Fang, X., Misra, S., Xue, G., et al., 2012, ‘Smart Grid—The New and Improved Power Grid: A Survey’, IEEE Communications Surveys & Tutorials 14, 944–980.
- Federal Energy Regulatory Commission, 2017, ‘Assessment of Demand Response & Advanced Metering’.
- Ganti, R.K., Ye, F., and Lei, H., 2011, ‘Mobile crowdsensing: Current state and future challenges’, IEEE Communications Magazine 49, 32–39.
- Grau, A., 2015, ‘Can you trust your fridge?’, IEEE Spectrum 52, 50–56.
- Grobe, K. et al., 2008, ‘PON in Adolescence: from TDMA to WDM PON’, IEEE Communication Magazine 46, 26–34.
- Gungor, V., Sahin, D., et al., 2011, ‘Smart Grid Technologies: Communication Technologies and Standards’, IEEE Communication Magazine 7, 529–539.
- Gungor, V.C., Lu, B., and Hancke, G.P., 2010, ‘Opportunities and challenges of wireless sensor networks in smart grid.’, IEEE Transactions on Industrial Electronics 57, 3557–3564.
- Güngör, V.C., Sahin, D., Kocak, T., et al., 2013, ‘A survey on smart grid potential applications and communication requirements’, IEEE Trans. Ind. Inf . 9, 28–42.
- Gupta, S., Kambli, R., Wagh, S., and Kazi, F., 2015, ‘Support‐Vector‐Machine‐Based Proactive Cascade Prediction in Smart Grid Using Probabilistic Framework’, IEEE Transactions on Industrial Electronics 62, 2478–2486.
- Harish, V.S.K.V. and Kumar, A., 2016, ‘Reduced order modeling and parameter identification of a building energy system model through an optimization routine’, Applied Energy 162, 1010–1023.
- Hassoun, A. and Dincer, I., 2015, ‘Analysis and performance assessment of a multigenerational system powered by Organic Rankine Cycle for a net zero energy house’, Applied Thermal Engineering 76, 25–36.
- IEC, 2016, ‘Smart Grid Standards Mapping Tool’, URL: http://smartgridstandardsmap.com/.
- IEEE Smart Grid, 2015, ‘Approved & Proposed IEEE Smart Grid Standards.’ URL: http://smartgrid.ieee.org/component/finder/search#gsc.tab=0&gsc.q=Approved%20%26%20Proposed%20IEEE%20Smart%20Grid%20Standards&gsc.page=1.
- IEEE, 2011, ‘Guide for Smart Grid Interoperability of Energy Technology and Information Technology Operation with the Electric Power System (EPS), and End‐Use Applications and Loads’, in IEEE 2030, ed. New York, NY, USA: IEEE.
- Igualada, L., Corchero, C., et al., 2014, ‘Optimal energy management for a residential microgrid including a vehicle‐to‐grid system’, IEEE Trans. on Smart Grid 5, 2163–2172.
- Industrial Internet Consortium, 2018, ‘Communication & control testbed for microgrid applications’, URL: http://www.iiconsortium.org/microgrid.htm.
- International Energy Agency, 2002, ‘Distributed generation in liberalised electricity markets’.
- Jablonska, M.R., 2014, ‘Microgrids technology review for the creation of urban prosumers societies’, Studies & Proceedings of Polish Association for Knowledge Management 72, 16–27.
- Ji, Y., Xu, P., et al., 2016, ‘Estimating hourly cooling load in commercial buildings using a thermal network model and electricity submetering data’, Applied Energy 169, 309–323.
- Jin, J., Gubbi, J., et al., 2014, ‘An Information Framework for Creating a Smart City Through Internet of Things’, IEEE Internet of Things 1, 112–121.
- Khan, M.F., Jain, A., Arunachalam, V., and Paventhan, A., 2014, ‘Communication technologies for smart metering infrastructure’, presented at the 2014 IEEE Students' Conference, Bhopal.
- Khan, R. and Khan, J., 2013, ‘A comprehensive review of the application characteristics and traffic requirements of a smart grid communications network’, Computer Networks 57, 825–845.
- King, J.E., Jupe, S.C.E., and Taylor, P.C., 2015, ‘Network State‐Based Algorithm Selection for Power Flow Management Using Machine Learning’, IEEE Transactions on Power Systems 30, 2657–2664.
- Lampropoulos, I., Baghină, N., Kling, W.L., and Ribeiro, P.F., 2013, ‘A Predictive Control Scheme for Real‐Time Demand Response Applications’, IEEE Transactions on Smart Grid 4, 2049–2060.
- Li, D. and Jayaweera, S.K., 2015, ‘Machine‐Learning Aided Optimal Customer Decisions for an Interactive Smart Grid’, IEEE Systems 9, 1529–1540.
- Li, D. and Jayaweera, S.K., 2015, ‘Machine‐Learning Aided Optimal Customer Decisions for an Interactive Smart Grid’, IEEE Systems Journal 9, 1529–1540.
- Liu, J., Xiao, Y., Li, S., et al., 2012, ‘Cyber security and privacy issues in smart grids’, IEEE Commun. Surv. Tutor . 14, 981–997.
- Liu, M., Quilumba, F.L., and Lee, W.‐J., 2015, ‘Dispatch Scheduling for a Wind Farm With Hybrid Energy Storage Based on Wind and LMP Forecasting’, IEEE Transactions on Industry Applications 51, 2375–2385.
- Liu, Y., Yuen, C., Yu, R., Zhang, Y., and Xie, S., 2016 ‘Queuing‐Based Energy Consumption Management for Heterogeneous Residential Demands in Smart Grid’, IEEE Transactions on Smart Grid 7, 1650–1659.
- Livani, H. and Evrenosoglu, C.Y., 2014, ‘A machine learning and wavelet‐based fault location method for hybrid transmission lines’, IEEE Transactions on Smart Grid 5, 51–59.
- Lombardi, P., Powalko, M., and Rudion, K., 2009, ‘Optimal operation of a virtual power plant’.
- López, G., Moura, P., Kantsepolsky, B., et al., 2012, ‘European FP7 project ENERsip: Bringing ICT and energy together’, Glob. Commun. Newsl. 15, 2–4.
- López, G., Moura, P., Moreno, J.I., and Camacho, J.M., 2014, ‘Multi‐Faceted Assessment of a Wireless Communications Infrastructure for the Green Neighborhoods of the Smart Grid’, Energies 7, 3453–3483.
- López, G., Moura, P., Moreno, J.I., and de Almeida, A., 2011, ‘M2M‐based platform to enable energy efficiency within energy‐positive neighborhoods’, In: INFOCOM Workshop on M2M Communications and Networking, Shanghai, China, 2011, 217–222.
- López, G., Moura, P., Moreno, J.I., de Almeida, A., et al., 2013, ‘Monitoring system for the local distributed generation infrastructures of the smart grid’, In: 22nd European Conference and Exhibition on Electricity Distribution, Stockholm, Sweden, 2013.
- Lu, G., Seed, D., Starsinic, M., Chonggang, W., and Russell, P., 2012, ‘Enabling smart grid with ETSI M2M standards’, In: IEEE Wireless Communications and Networking, Paris, France, 2012, 148–153.
- Mancarella, P. and Chicco, G., 2013, ‘Real‐Time Demand Response From Energy Shifting in Distributed Multi‐Generation’, IEEE Transactions on Smart Grid 4, 1928–1938.
- Manickavasagam, K., 2015, ‘Intelligent Energy Control Center for Distributed Generators Using Multi‐Agent System’, IEEE Transactions on Power Systems 30, 2442–2449.
- National Institute of Standards and Technology (NIST), 2010, ‘Framework and Roadmap for Smart Grid Interoperability Standards, Release 1.0’, Gaithersburg, MD, USA.
- National Institute of Standards and Technology (NIST), 2011, ‘Guidelines for Assessing Wireless Standards for Smart Grid Applications: Priority Action Plan 2’, Gaithersburg, MD, USA.
- National Institute of Standards and Technology (NIST), 2012, ‘Framework and Roadmap for Smart Grid Interoperability Standards, Release 2.0’, Gaithersburg, MD, USA.
- National Institute of Standards and Technology (NIST), 2014, ‘Framework and Roadmap for Smart Grid Interoperability Standards, Release 3.0’, Gaithersburg, MD, USA.
- NIST Smart Grid Collaboration, 2013, ‘SGIP Catalog of Standards’, URL: http://collaborate.nist.gov/twiki‐sggrid/bin/view/SmartGrid/SGIPCatalogOfStandards.
- Noll, J., Garitano, I., Fayyad, S., et al., 2015, ‘Measurable Security, Privacy and Dependability in Smart Grids’, Journal of Cyber Security 3, 371–398.
- Nunna, S.K., Battula, S., Doolla, S., and Srinivasan, D., 2017, ‘Energy Management in Smart Distribution Systems with Vehicle‐to‐Grid Integrated Microgrids’, IEEE Transactions on Smart Grid PP.
- Pellicer, S., Santa, G., Bleda, A.L., and Maestre, R., 2013, ‘A Global Perspective of Smart Cities: A Survey’, presented at the Seventh International Conference on Innovative Mobile and Internet Services in Ubiquitous Computing, Spain, 2013.
- Perera, D.W.U., Halstensen, M., and Skeie, N.‐O. 2015, ‘Prediction of Space Heating Energy Consumption in Cabins Based on Multivariate Regression Modelling’, International Journal of Modeling and Optimization 6, 385–392.
- Pouryazdan, M., Kantarci, B., Soyata, T., and Song, H., 2016, ‘Anchor‐assisted and vote‐based trustworthiness assurance in smart city crowdsensing’, IEEE Access 1, 1–3.
- Qian, L.P., Zhang, Y.J.A., Huang, J., and Wu, Y., 2013, ‘Demand Response Management via Real‐Time Electricity Price Control in Smart Grids’, IEEE Journal on Selected Areas in Communications 31, 1268–1280.
- Rafiei, M., Niknam, T., and Khooban, M.‐H., 2017, ‘Probabilistic Forecasting of Hourly Electricity Price by Generalization of ELM for Usage in Improved Wavelet Neural Network’, IEEE Transactions on Industrial Informatics 13, 71–79.
- Rafiqul, A.M., St‐Hilaire, M., and Kunz, M., 2014, ‘A modular framework for cost optimization in smart grid’, In: IEEE World Forum on Internet of Things (WF‐IoT) 2014.
- Ramallo‐Gonzáleza, A.P., Blightb, T.S., and Coleyb, D.A., 2015, ‘New optimisation methodology to uncover robust low energy designs that accounts for occupant behaviour or other unknowns’, Journal of Building Engineering 2, 59–68.
- Rana, M.M. and Li, L., 2015, ‘Microgrid state estimation and control for smart grid and Internet of Things communication network’, Electronic letters 51, 149–151.
- Rapeepat, R., Prasad, A., Li, Z., et al., 2015, ‘Recent Avdances in M2M Communications in 4G Networks and Evolution towards 5G’, In: 18th International Conference on Intelligence in Next Generation Networks, 52–57.
- Riffonneau, Y., Bacha, S., Barruel, F., and Ploix, S., 2011, ‘Optimal Power Flow Management for Grid Connected PV Systems With Batteries’, IEEE Transactions on Sustainable Energy 2, 309–320.
- Salinas, S., Li, M., and Li, P., 2013, ‘Multi‐Objective Optimal Energy Consumption Scheduling in Smart Grids’, IEEE Transactions on Smart Grid 4, 341–348.
- Salinas, S., Li, M., et al., 2013, ‘Dynamic Energy Management for the Smart Grid With Distributed Energy Resources’, IEEE Transactions on Smart Grid 4, 2139–2151.
- Sebastián, R., 2016, ‘Application of a battery energy storage for frequency regulation and peak shaving in a wind diesel power system’, IET Generation, Transmission & Distribution 10, 764–770.
- Sheikhi, A., Rayati, M., and Ranjbar, A.M., 2015,‘Energy Hub optimal sizing in the smart grid; machine learning approach’, In: 2015 IEEE Power & Energy Society Innovative Smart Grid Technologies Conference (ISGT), 1–5.
- Shelby, Z., 2010,‘Embedded web services’, Wireless Communications, IEEE 17, 52–7.
- Smart Cities, 2007, ‘Ranking of European Medium‐Size Cities’, Vienna University of Technology.
- Smart Grid Coordination Group, 2012, ‘Smart Grid Reference Architecture.’
- Smarter Grid Solutions UK, 2014, ‘Smart Grid Architecture Model’, in Power in Unity: A Joint Vision Approach, Austin Court, UK, 1–5.
- Soroudi, A., Siano, P., and Keane, A., 2016, ‘Optimal DR and ESS Scheduling for Distribution Losses Payments Minimization Under Electricity Price Uncertainty’, IEEE Transactions on Smart Grid 7, 261–272.
- Sun Y. and Jara, A.J., 2014, ‘An extensible and active semantic model of information organizing for the Internet of Things’, Pers. Ubiquitous Comput. 18, 1821–1833.
- Sun, Y. et al., 2014, ‘Organizing and querying the big sensing data with event‐linked network in the Internet of Things’, Int. J. Distrib. Sensor Netw. 1.
- Sun, Y., Lu, C., Bie, R., and Zhang, J., 2016, ‘Semantic relation computing theory and its application’, J. Netw. Comput. Appl. 59, 219–229.
- Sun, Y., Song, H., Jara, A.J., and Bie, R., 2015, ‘Internet of Things and Big Data Analytics for Smart and Connected Communities’, IEEE Access (Special Section on Smart Cities) , vol. 4, Dec 2015, 766–773.
- Sun, Y., Yan, H., Lu, C., Bie, R., and Zhou, Z., 2014, ‘Constructing the Web of events from raw data in the Web of things’, Mobile Inf. Syst . 10, 105–125.
- T. Maddox. (2016, Nov). New forum seeks to unite 100 cities in standards to drive smart city innovation. Available: http://www.techrepublic.com/article/new‐forum‐seeks‐to‐unite‐100‐cities‐in‐standards‐to‐drive‐smart‐city‐innovation/
- Tehrani, M.N., Nader, M., Uysal, M., et al., 2014, ‘Device‐to‐device communication in 5G cellular networks: challenges, solutions, and future directions’, IEEE Communications Magazine 52, 86–92.
- Tuttle, D.P., Gülen, G., Hebner, R., King, C.W., et al., 2016, ‘The History and Evolution of the U.S. Electricity Industry’, The University of Texas at Austin, U.S..
- US Department of Energy, 2016, ‘Energy Service Companies’, URL: https://energy.gov/eere/femp/energy‐service‐companies‐0
- Usman A., and Shami, S., 2013, ‘Evolution of communication technologies for smart grid applications’, Renewable & Sustainable Energy Reviews 19, 191–199.
- Vardakas, J.S., Zorba, N., and Verikoukis, C.V., 2015, ‘A Survey on Demand Response Programs in Smart Grids: Pricing Methods and Optimization Algorithms’, IEEE Communications Surveys & Tutorials 17, 152–178.
- Vayá, M.G. and Andersson, G., 2015, ‘Optimal Bidding Strategy of a Plug‐In Electric Vehicle Aggregator in Day‐Ahead Electricity Markets Under Uncertainty’, IEEE Transactions on Power Systems 30, 2375–2385.
- Vienna University of Technology, ‘Smart cities Ranking of European medium‐sized cities’, Vienna, 2007.
- Wan, C., Xu, Z., Wang, Y., and et al., 2014, ‘A Hybrid Approach for Probabilistic Forecasting of Electricity Price’, IEEE Transactions on Smart Grid 5, 463–470.
- Wu Z., and Xu, J., 2013, ‘Predicting and optimization of energy consumption using system dynamics‐fuzzy multiple objective programming in world heritage areas’, Energy 49, 19–31.
- Xi, F., Satyajayant, M., et al., 2012, ‘Smart Grid—The New and Improved Power Grid: A Survey’, Communications Surveys & Tutorials 14, 6–9.
- Xu, H., Huang, H., Khalid, R.S., and Yu, H. 2016, ‘Distributed machine learning based smart‐grid energy management with occupant cognition’, In: 2016 IEEE International Conference on Smart Grid Communications (SmartGridComm), 491–496.
- Yan, Y., Quian, Y., Sharif, H., and Tipper, D., 2013, ‘A survey on smart grid communication infrastructures: Motivations, requirements and challenges’, IEEE Communications Surveys & Tutorials 15, 5–20.
- Ye, N., Zhu, Y., et al., 2014, ‘An Efficient Authentication and Access Control Scheme for Perception Layer of Internet of Things’, Applied Mathematics & Information Sciences 8, 1–8.
- Yoon, J.H., Baldick, R., and Novoselac, A., 2014, ‘Dynamic Demand Response Controller Based on Real‐Time Retail Price for Residential Buildings’, IEEE Transactions on Smart Grid 5, 121–129.
- You, S., Træholt, C., and Poulsen, B., 2009a, ‘A market‐based virtual power plant’, In: International Conference on Clean Electrical Power, 460–465.
- You, S., Træholt, C., and Poulsen, B., 2009b, ‘Generic virtual power plants: Management of distributed energy resources under liberalized electricity market’, 8th International Conference on Advances in Power System Control, Operation and Management, 1–6.
- Zanella, A., Bui, N., Castellani, A., et al., 2014, ‘Internet of Things for Smart Cities’, IEEE Internet of Things Journal , vol. 1, 22–32.
- Zhang, H., Hu, Z., Xu, Z., and Song, Y., 2017, ‘Evaluation of Achievable Vehicle‐to‐Grid Capacity Using Aggregate PEV Model’, IEEE Transactions on Power Systems 32, 784–794.
- Zhuge H. and Sun, Y., 2010, ‘The schema theory for semantic link network’, Future Generat . Comput. Syst. 26, 408–420.