
CONTENTS
6.3 Insulation Materials Response at Operating Stress
6.3.2 Dielectric Constant/Permittivity/Specific Inductance Capacitance
6.3.5 Mineral Filled Systems and Interfacial Polarization
6.4 Insulation Response at High Stress
6.4.4.2 Breakdown Strength Considerations
6.4.5.2 What Happens to the Insulation
6.4.5.3 Key Partial Discharge Phenomena Parameters
6.4.5.3.1 Partial Discharge Inception Voltage and Partial Discharge Extinction Voltage
This chapter is concerned with the electrical properties of polymers employed as insulation. The emphasis is on extruded polymers. In Chapter 5, we demonstrated that the physicochemical properties of polymers employed as electrical insulation are determined by the chemical structure of the polymer; the nature of their chemical bonds and their geometry. The fundamental properties of the polymers employed as insulation and as shields were reviewed therein.
With reference to the electrical properties, it is convenient to classify these same polymers according to their response to the voltage stress under which they operate. We will demonstrate that the electrical properties of polymers serving as cable insulation are indeed related to their structure at low or operating stress; however, at high stress (applied or local), other factors become significant and can override this parameter.
Insulation materials, whether they be (for example) cross-linked polyethylene (XLPE), an ethylene propylene rubber (EPR), or polyvinyl chloride (PVC), all serve the role of protecting the conductor from the local environment; they ensure that the current flow path remains constant. They are intended to be poor conductors and are expected to fulfill that function for the projected lifetime of the wire or cable. They are expected to serve that role in dry or wet environments. Key properties that characterize good insulating polymers at operating stress are volume resistivity (VR), dielectric constant (K), and dissipation factor (DF). Any polymer serving this role must possess VR, K, and DF property requirements as defined in industry specifications. Polarization is another key phenomenon to be understood.
VR is a clearly defined parameter for electrical insulation materials; it is the electrical resistance between opposite faces of a cube of the polymer of interest, when measured at a defined temperature and pressure. DF represents a measure of the amount of energy lost as heat rather than transmitted as electrical energy; it is therefore a measure of dielectric losses. K (also referred to as permittivity or specific inductance capacitance) is a measure of how well the insulation holds charge. A good dielectric (insulation) material is one that holds the charge well (low K) combined with very low losses (low DF). Polyolefins such as polyethylene (PE), XLPE, and most EPRs represent examples of polymers that possess excellent combinations of these properties.
All three phenomena are intimately related; however, each will be discussed individually as we review what happens to the insulation itself when it responds to the operating stress. Some overlap in the discussion of the phenomena is inevitable. Polarization, another key property of polymeric insulation, is discussed first (Section 6.3.1), after VR is defined.
At higher voltage stresses, the ability of the insulation to prevent flow of electrons becomes threatened. The property of the insulation that matters here is referred to as dielectric strength, and if this value (which is high initially and often drops upon aging) is such that the insulation can no longer prevent electron flow, failure results. There are several mechanisms by which this can occur, the common one being partial discharge. Operation under high voltage stresses (applied or local) and resultant failure mechanisms are discussed in Section 6.4.
The emphasis shall be on polyolefins employed for medium voltage insulation; polyethylene, XLPE, tree-retardant cross-linked polyethylene (TR-XLPE), and ethylene–propylene polymers. The principles involved with regard to how they, and other copolymers, respond to voltage stress shall be reviewed.
In this chapter, the terms power factor and DF will be used interchangeably. In addition, the terms K, permittivity, and specific inductance capacitance will be used interchangeably.
The reader is also referred to Chapter 4 for discussion of many of these terms with reference to cables.
VR can be understood by reference to Figure 6.1, which shows a hypothetical cube of polymer insulation material. Since insulating polymers are poor conductors, they have high resistance to movement of electrons. VR is the term commonly applied and represents (under direct current [DC]) the resistance to passage of electrons between opposite faces of the cube, where the cube dimensions, distance between cube faces, and temperature are all defined.
The greater the resistance between two opposite faces, the better the ability of the polymer to serve in electrical insulation applications. The VR units are ohm-cm. The VR is a fundamental material parameter for insulation and semiconducting materials. Polyethylene is an excellent insulation and its VR is 13.
It should be noted that VR is different from insulation resistance, which is another way of describing the quality of the insulation, but in a cable construction. Insulation resistance is a measure of the ohmic resistance of a cable for a given set of conditions. The value depends on the test parameters (e.g., cable length) and will differ as the test parameters change. It is therefore not a basic polymer insulation materials property, but is useful for estimating the condition of cables where the lengths being measured will likely vary. As noted above, the dimensions for determining VR of an insulation are clearly defined. [In addition, VR (ohm-cm) should not be confused with resistance per unit volume (or ohms per cubic centimeter).]
An additional concept employed for studying insulation materials is “surface resistivity,” which is represented by the passage of electrons between opposite portions along the surface of a film of defined dimensions (this can be visualized as one surface of the cube described above, Figure 6.1); the units here are ohms (not ohm-cm), as the width and length of the film being measured (one square cm) are chosen to be the same.
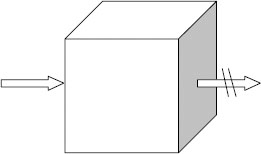
FIGURE 6.1 Volume resistivity.
Hence, VR represents a three dimensional measurement, and surface resistivity represents a two dimensional measurement.
VR, insulation resistance, and the other properties noted above are influenced by moisture content, voltage, time of applied voltage, and temperature. The conditions of measurement are vital to understanding how to compare this property information for different insulations. It is also an important parameter when considering the properties of semiconducting materials.
6.3 INSULATION MATERIALS RESPONSE AT OPERATING STRESS
Under an applied field, polymers become polarized. Polarization can be visualized as shown in Figures 6.2 and 6.3. If the polymer is placed between two electrodes and voltage stress is applied, mobile charge carriers will migrate. In simplest terms, anions migrate toward the anode and cations toward the cathode. As seen, there is a charge accumulation at each surface, but no overall change within the polymer. There is migration, but no conduction. Figure 6.3 provides another perspective on charge migration. This is referred to as polarization. Under DC polarization persists, while under AC it is easy to visualize that “cyclic” migration will result. The broader question is, since the polymer is intended to be an insulation, what exactly are these charge carriers?
Polymer molecules employed as insulation can be classified as being polar or nonpolar; polar molecules possess a slight “distortion” in their electronic charge distributions. Even a simple molecule like water is “unbalanced” via this principle, as the oxygen portion of the molecule draws electrons closer, causing the oxygen region of the molecule to have a permanent slightly negative charge (referred to as a dipole). Another way of viewing this is that the electrons spend more time in the vicinity of the oxygen than that of the hydrogen. The overall molecule is neutral but the electronic distortion renders it as being polar in nature, and it is referred to as being a permanent polar dipole.
These principles of orientation apply to polymers that contain atomic constituents that possess polar components. Here we have orientation of the more complex polymer chains, relative to simple polymer molecules. Recall (Chapter 5) that during processing of extruded cables, a small amount of oxidation is virtually unavoidable (see below). This means that instead of the insulation consisting of solely carbon–carbon and carbon–hydrogen bonds, there will be a small quantity of carbon–oxygen bonds. In turn, this leads to a permanent “unbalance” in the electronic configuration of that portion of the polymer molecule.
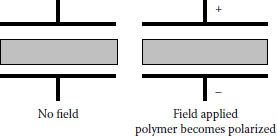
FIGURE 6.2 Polarization of a polymer subjected to an electric field.
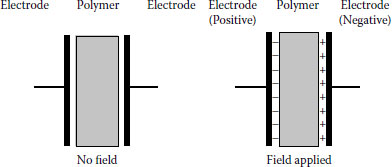
FIGURE 6.3 Charge migration on a polymer subjected to an electric field.
When voltage stress is applied during operation, this situation becomes exacerbated. Under these conditions, the distortion is increased and the extent is related to the magnitude of the applied stress. Ethylene copolymers with vinyl acetate or ethyl acrylate (employed in shields), each possessing oxygen-containing functionality, are more polar than polyethylene homopolymers (or even very slightly oxidized ethylene polymers) and will respond accordingly; however, since these polymers are intended for use in semiconducting layers, their increased polarity involves no practical issue. (If a cable insulation undergoes oxidation during aging [i.e., water tree formation], it is obvious that permanent dipoles will increase in quantity.)
The nonpolar regions (those that contain no permanent dipoles) can also be affected by voltage stress but to a lesser extent. Here, the field can induce a displacement of the electrons (referred to as an induced dipole) and the displacement occurs only while the field exists. Since operating cables are under continuous voltage stress after being energized, from a practical perspective both phenomena become relevant.
One result of these stresses is segmental motion of the polymer chain. In principle, the dipole regions can be on the polymer branch or the main chain. Figure 6.4 is an idealized description of motion of side chains; note the orientation of the side chains in the portion of the energized polymer chain. Figure 6.5 provides an idealized depiction of polarized side chains. Figure 6.6 depicts main chain motion. Note also the segmental motion; the lower half of the upper chain has rotated above the plane of the paper and is now “twisted” over in the same chain as depicted on the right. The other polymer chain behaves in a similar manner. Since there is a tendency for the positive charges on the polymer to move toward the negative electrode, and for the negative charges on the polymer to move toward the positive electrode, the polymer is “pulled” in two directions. This movement is an attempt to align with the field. Hence, the process induces a very slight mechanical stress in the polymer. These figures illustrate the point in a simplified manner. In reality, there will be a distribution of polarities along the chains of different molecular weights.
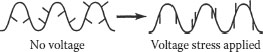
FIGURE 6.4 Orientation of polar functionality on polymer side chains.
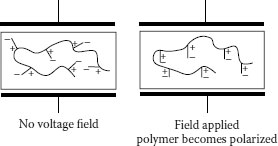
FIGURE 6.5 Polarization of side chains depicted on a coiled polymer.
It must also be noted that any foreign impurities (not part of the polymer structure) can also exhibit migration under the applied stress. Examples include water and ions, as well as cross-linking agent by-products (if present) and antioxidant residues.
It must be emphasized that this generic description focuses on what happens under DC. Consider now what would happen under alternating current (AC); here the polymer chain alignments will be shifting back and forth in accordance with the polarity change, and this realignment will be taking place at a rate controlled by the frequency. In considering these points, it becomes evident that the response of a polyolefin polymer, even a slightly polar one, is quite different under AC than under DC. Such motion may result in increased losses and heat dissipation (Section 6.3.3).
It is worth reviewing some key points established in Chapter 5, but this time from the perspective of electrical properties. Recall that the polymer insulation chains that we have been considering consist of many methylene groups linked together and these are essentially nonpolar in nature. However, during polymer insulation manufacture (polymerization of the monomer or monomer mixtures) and fabrication into cable insulation, these very long chains are always subjected to small chemical changes due to oxidation. More specifically, this may occur during conversion of the monomer to the polymer, during conversion of the polymer to cable insulation over the conductor, or during the high temperature/pressure conditions employed for the chemical cross-linking process. The reason is that when the cable is manufactured, the polymer is heated to very high temperatures in an extruder barrel (to melt the crystalline regions and to ensure uniform dispersion of the catalyst), and is subjected to mixing and grinding due to screw motion and frictional contact against the barrel wall. When cross-linking is performed later by using peroxides, the temperature and pressure in the curing tube are raised even higher in order to decompose the peroxide catalyst. As noted earlier, an effort is made to prevent any elevated-temperature-induced degradation (but more realistically, the event is kept to a minimum) by incorporating antioxidant(s) into the polymer. The antioxidant preferentially degrades and protects the polymer insulation. However, a small degree of oxidative degradation, while controlled, is normal. Therefore, there will always be some oxidized functional groups on the polymer chains.
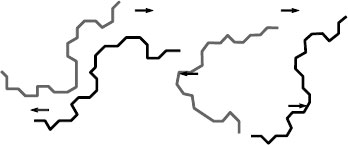
FIGURE 6.6 Schematic of modes of main chain motion of a polymer under voltage stress.
The polymerization process also leads to polymer chains of varying molecular weights and various degrees of branching, so we are working with polymers defined by their molecular weight distributions. To these parameters we must now add another variable; we will have polymer chains having varying degrees of polarity, either on the branch or on the backbone, or both. Recall also that we may have long or short chain branches (only short chain branches are shown in Figure 6.4). These differences mean that the response of the insulation (the polarization phenomena) will be time-dependent. These are important points to keep in mind when reviewing the polymer insulation response to frequency.
The wide variety of molecular weights (broad distribution), variety of short and long chain branches emanating from the backbone, different degrees of oxidation on the branches and backbone, and different nature of polar functionality (carboxyl, ester, carbonyl) possibly present, all ensure that there will be a distribution of relaxation times (even at any single frequency and temperature). The fact is that all the chains cannot respond simultaneously and in the same manner. Also, as the frequency increases, the polar groups have a more difficult time following the field, and at high frequencies (well above 50–60 Hz) the polar groups can no longer follow the field and properties change (e.g., K drops); the phenomenon is referred to as dispersion (see Section 6.3.4). The fundamental principle described here has been referred to as Maxwell–Wagner polarization.
The broad review of polarization of insulation materials operating under AC implies that there will also be dielectric relaxation taking place. The latter also occurs within the polymer molecules during each cycle due to movement under the changing field, and the rate of change is determined by the relaxation time. These phenomena influence permittivity and dielectric losses.
6.3.2 DIELECTRIC CONSTANT/PERMITTIVITY/SPECIFIC INDUCTANCE CAPACITANCE
Dielectric constant (K) can be visualized as what is taking place at the atomic level inside the polymer chain as polarization occurs [polarization being viewed as the observed “outer” response of the chain (i.e., motion or displacement) to voltage stress]. K is not related to motion of the polymer as is polarizability, but instead is related to capacitance, and is a measure of the ability of the insulation material to store electrical energy. The key point is that as a result of motion of the polar functional groups, energy is stored. The ratio of the energy stored in the insulating polymer to that of a vacuum is referred to as the dielectric constant.
Permittivity is intimately related to the polymer structure. A polymer insulation material like polyethylene, which has very few dipole regions, can store very little energy, and has a low K; when polar bonds are present in polymers, K increases. Polymers that have permanent dipoles, such as an ethylene copolymer with vinyl acetate or ethyl acrylate, can store more energy than polyethylene (or XLPE) and they have higher dielectric constants. Very polar polymers have even higher dielectric constants; an example would be a polyamide such as Nylon or Hypalon (chlorosulfonated polyethylene). K varies with frequency and is relatively low at 50–60 Hz. Since the dielectric constant is a ratio (charge stored in the polymer as compared with that in a vacuum), it has no units, and is simply a pure number.
Permittivity can be determined by procedures described in ASTM-D 150 and IEC 60260. In essence, a sample of insulation material is placed between two metallic plates and voltage applied. The sample size is defined in the procedure, and must be flat (and larger than the 50 mm (2 in) circular electrodes used for the measurement). A second voltage run is made without the specimen between the two electrodes. The ratio of these two values is the dielectric constant. Permittivity is the ratio of the capacitance of the dielectric material to that of air. Since an insulation cannot have dielectric constants less than that of a vacuum, K must, obviously, be greater than 1 regardless of the insulating polymer being measured. Dielectric constants of polymers at room temperature are normally in the range of 2 to 10, the lower values also being associated with the lowest dielectric losses. The dielectric constant is dependent upon the temperature and (to a lesser extent) frequency of testing. It is usually reported at 60 Hz or 1,000 Hz. The dielectric constants of various common polymeric materials are shown in the Table 6.1.
[Small differences in K exist between polyethylenes of different densities (crystallinity), K decreasing slightly as density decreases, but these are very minor relative to differences between different polymers.]
TABLE 6.1
Dielectric Constants of various polymers Employed as Electrical Insulation
Polymer type |
Dielectric Constant (K) |
Polyethylene-Low density |
2.25–2.35 |
Polyethylene-High density |
2.30–2.35 |
Ethylene–Vinyl Acetate Copolymer (EVA) |
2.50–3.16 |
Ethylene–Ethyl Acrylate Copolymer |
2.70–2.90 |
Ethylene–Propylene Copolymer (unfilled) |
2.25–2.35 |
Polypropylene |
2.22–2.26 |
PVC (plasticized) |
3.1–10.0 |
Chlorosulfonated polyethylene (Hypalon) |
7.0–10.0 |
Nylon |
3.4–4.0 |
Polyimide (Nomex) |
2.8 |
Cyanoethyl cellulose |
13.3 |
Based on the principles described, one would expect that as polyolefin cable insulation ages and becomes oxidized (e.g., water trees form), K should increase slightly.
We have seen from the prior discussion that the cable insulation acts as a capacitor. Most capacitors lose part of their energy under AC. The ratio of the energy dissipated through the insulation to the energy stored (in each cycle) is referred to as the dissipation factor (DF), or Tan delta (the tangent of the loss angle when the system is subjected to a sinusoidally varying applied field). This energy is lost as heat, and therefore the DF can be viewed as a measure of the efficiency of the insulation.
The lossyness has also been referred to as power factor, which is the sine of the loss angle. The power factor is not identical to the DF, but the values are nearly identical when the Tan delta is <0.1. This is relevant to low loss insulations, where Tan delta is always less than about 0.1 (and hence the difference is negligible). As losses increase, Tan delta and Sine delta start to diverge.
The losses described result from motion of the polymer as described in Section 6.2.1. As with K, losses are frequency-and temperature-dependent. Dielectric losses are also discussed in Section 6.3.4.
Now that we have discussed polarizability, dielectric constant, and dielectric losses, we will review dispersion in greater detail. The question to consider is what happens if the motion of the chains cannot respond rapidly enough to the changes in frequency, and how this influences permittivity and dielectric losses. Of course, our interest is in the 50–60 Hz range, but to understand the polymer response, it is desirable to review what happens over a very broad frequency range.
Different regions of the polymer chains will be sensitive to and respond differently to voltage stress. Different functional groups will be sensitive to different frequencies. When the “proper” frequency–functional group combination occurs, the chain portion will respond by exhibiting motion (i.e., polarization). Since this phenomenon is frequency-dependent, it should not be surprising that different responses will result from different functional group–frequency combinations. The upper portion of Figure 6.7 depicts the change in dielectric constant with frequency. The lower portion of the figure depicts the change in power factor with frequency. Referring to the top curve in Figure 6.7, we can see that at low frequencies, when stress is applied, the polar region dipoles can respond and “accept” the charge, and realign as previously described. The dielectric constant is relatively high under these conditions. As the frequency increases, no change in this effect will occur as long as the dipoles can respond. At some point as the frequency continues to increase, the chains will respond more slowly as the field is changing more rapidly. When the frequency change occurs at so rapid a rate that no rotation can occur, the charge cannot be held and the dielectric constant drops.
The reason for the change in dielectric constant with frequency is therefore apparent. It should also be noted that other parameters such as temperature will also affect this response. In essence, any change that affects the motion of the polymer chain will affect the dielectric constant.
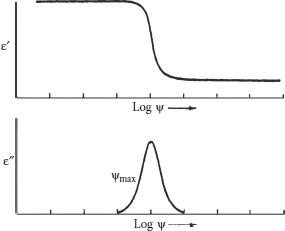
FIGURE 6.7 Permittivity and power factor as a function of frequency.
The point where the polymer chain segments undergo the rapid change in the rate of rotation is of special interest. The lower curve of Figure 6.7, focusing on losses (e.g., DF), shows a peak at this point. In considering DF, the same explanation applies; changes are affected by frequency and specific polymer nature. At low frequencies, the dipoles on the polymer chains follow variations in the AC field, and the current and voltage are out of phase; hence, the losses are low. At very high frequencies as noted above, the dipoles cannot move rapidly enough to respond, and hence the losses are low here also. But where the change takes place, there the losses are greatest. This can be visualized by thinking in terms of motion causing the energy to be mechanical rather than electrical in nature. As noted above, it is common in technical literature to refer to the dielectric constant and power factor at 50 or 60 Hz and at 1,000 Hz.
We referred earlier to various degrees of oxidation influencing results. For example, as seen in Chapter 5, some insulations possess additional polar functional groups that are a result of additives intentionally incorporated to generate specific properties; chloride, amine, amide, and sulfur are examples. Chloride, for example, a flame retardant additive, is a relatively large molecule, even compared to oxygen, and it is rigidly attached to the backbone in some polymers. It will impede the rotation response of the backbone to the AC stress. Different functional groups will respond differently at the same frequency, whether on the main chain or a branch.
Therefore, chain motion can be hindered due to what is referred to as the polymer viscoelastic nature. If the dipole is rigidly attached on the polymer backbone, then main chain motion is involved. If the dipole is on a branch, it can be considered to be “flexibly attached” in which case the rate of motion of the branch will be expected to differ from that of the main chain, even if the functional group is the same.
The end result of all of this is the phenomenon called dispersion. In response to the applied field, different chains will exhibit motion at different rates at any single frequency and temperature. The polymer chains may exhibit this change over a broad region rather than a sharp or localized region as the frequency and temperature is changed slightly.
For the purposes of understanding power cable insulation response, the main interest is, of course, at 50 or 60 Hz. Also, our interest is in what is intended to be relatively nonpolar systems. It is always necessary to remember that no system is perfect and there will be variations in degrees of polarity not only from one insulation material to another, and not only from one grade of the same material to another, but perhaps also from one batch of supposedly identical material to another. Much depends upon the processing control parameters during manufacture of the materials and during extrusion.
The literature reports dielectric losses of many different types of polyolefins as a function of temperature at controlled frequencies. Hence, it is known that conventional low-density polyethylene undergoes losses at various different temperatures. In addition, antioxidants, antioxidant degradation by-products, and low molecular weight molecules will also respond; this complicates interpretation. With conventional XLPE, the situation is even more complex as there are peroxide residues and cross-linking agent by-products (see Chapter 5). These low molecular weight organic molecules, acetophenone, dimethyl benzyl alcohol, alpha methyl styrene, and smaller quantities of other compounds will gradually migrate out of the insulation over time.
Till now, we have focused on polyethylene and XLPE. TR-XLPE possesses additives or more polar components (see Chapter 5) that lead to slightly increased dielectric constant and DFs.
With reference to EPR, the same principles regarding dispersion apply. In addition, it is necessary to consider the differences between the different EPR polymers themselves, and also distinguish among the filled EPR compounds employed as insulation (see Section 6.3.5). The dielectric properties of unfilled EPR are quite good; low dielectric constant and low DF. But unfilled EPR is not a practical insulation material (see Chapter 5). After the required fillers and other additives are incorporated, the dielectric constant and DF both increase. The reason is due to these additives. Any discussion of EPR must consider that all EPRs are not alike, as discussed in Sections 5.6.3 and 5.6.4.
Contaminants can be defined as “unintended non-polymeric components” that might be present. We have already noted their influence on low operating stress parameters; they can migrate under voltage stress just as do polar portions of polymer insulation chains. [Examples are ions that can enter the cable core from the outside soil or from the shields, and water.] These can also influence other cable properties.
Interpretation of data therefore requires knowledge of the system, and some degree of caution is prudent in the absence of adequate information.
6.3.5 MINERAL FILLED SYSTEMS AND INTERFACIAL POLARIZATION
Up to this point in the discussion, we have reviewed what could be viewed as situations solely involving the polymer response to applied stress, and not influenced by other components. However, as seen in Chapter 5 with reference to EPR (and other elastomers employed for low voltage applications), substantial amounts of inorganic fillers and other additives are required to improve the mechanical properties in order to render them useful as cable insulation. Inorganic fillers will affect electrical properties such as dielectric constant and modify the polymer behavior. (They also influence conductivity, as well as other nonelectrical properties.) The nature of the interface where the polymer matrix and the clay additive interact is another key parameter.
An EPR compound can be considered as a heterogeneous dielectric where polarization is generated as a result of the two materials having different dielectric constants; charge is accumulated at the polymer–filler interface. This is referred to as interfacial polarization, and conductivity differences will also exist. Space charge can build up at these interfaces leading to dielectric losses.
Conventional polarization as described in Section 6.3.1 is a result of orientation due to charges that are “bound” in the polymer structure. Charge carriers can also migrate through the dielectric material (hence leakage current results, see Section 6.3.6). However, the motion of these charge carriers can be hindered or even stopped at certain interfaces, and when this occurs, space charge trapping results. This trapping leads to a distortion of the field and an increase in capacitance (but not a change in the inherent dielectric constant of the polymer). The phenomenon is a result of the different nature of the interfaces. Clearly, the nature of the polymer–filler interface is critical, and this means the particle size, shape, and processing history are relevant; it is one reason that silane-coated clays are used in modern EPR insulated cables instead of solely heat-treated (calcined) clays. This phenomenon, in principle, is relevant whenever significantly different surfaces are in contact. In principle, it also applies where an antioxidant is in contact with the polymer matrix (here, however, the concentration is trivial compared with that of mineral fillers). In the case of conductive fillers such as specific types of carbon black, interfacial polarization becomes quite significant and the dielectric constant can be very high (e.g., perhaps ~100 at commercial levels of carbon black present in semiconducting shield materials). It can also apply to water presence and defects, in which cases localized charge will accumulate.
The phenomena of polarization, permittivity, and losses all relate to how charge is held in the insulation and the consequences of the polymer response to the applied voltage stress. Despite being a poor conductor, the fact is that the polymer insulation does allow some level of conductivity. A fundamental point relates to the ability of the polymeric insulation to continue to hold charge over time; in this regard, we go beyond charge motion and trapping but to charge release. This can be influenced by morphology changes of the polymer over time (not only to crystalline melting but also to chain motion in the absence of crystallinity); morphology of the clay particles (shape, size, and architecture) in an elastomer, and the nature of the polymer/filler interface (as a subset here, the nature and extent of the coating on the clay). In addition, the numerous other additives can influence events. Not all components present need be trapped initially; foreign ions may facilitate conductivity directly.
To this point, we have examined what happens to the polymer insulation materials when subjected to voltage stress. It is of merit now to compare information generated primarily on cables (rather than solely cable materials) from an engineering perspective.
The classical view of events that occur when applying DC voltage to a cable refer to three components of current flow; capacitive, absorption, and leakage. Capacitive current is seen immediately after application of DC voltage; the cable (i.e., the capacitor) becomes fully charged. There are no chemical reactions, simply charge accumulation. It is likely due to realignment of charged atoms. This phenomenon takes place rapidly and the time constant is less than few seconds. It is not a significant factor in influencing reliability.
Absorption current has also been referred to as polarization current and is the phenomenon we have been discussing in Section 6.2.1 from a materials perspective; temporary realignment of polar molecules induced by the field. This leads to dielectric losses, which are trivial under DC, but significant under AC.
Leakage current has not been discussed earlier in our review of insulation materials (however, see Section 6.3.6). For cables, leakage current is significant, as it provides an indication of the “state” of the insulation. It can be viewed as the inability of the polymer insulation to prevent charge motion; the phenomena of polarization and permittivity to induce trapping are not adequate to keep ions and electrons from passing into and along the insulation.
From a cable reliability perspective, the leakage current is the most significant of the three phenomena discussed here. The leakage current should be proportional to the applied voltage stress; if it is nonlinear, that is an indication of “weakened” insulation.
The significant physicochemical differences in components and construction of an extruded cable as compared with a paper/fluid system has been discussed in Section 5.10. From the perspective of the dielectric phenomena involved, the only difference is that we are now dealing with a solid/liquid system, instead of a solid (e.g., XLPE) or solid/solid (e.g., filled EPR) system. The same principles apply; indeed, they were applied to paper/fluid systems before solid dielectrics were developed.
For example, many principles were established by studying paper/fluid systems. It was known in the 1920s that:
1. The relationship between power factor and temperature was a function of the nature of the paper, as well as the nature of the impregnating compound (and also to the presence of moisture).
2. Additional stored energy (apparent dielectric constant) is due to the presence of polar molecules.
3. Water (which has a high dielectric constant) in a liquid dielectric will be drawn to the strongest part of the field (high stress site).
4. Dielectrics subjected to a potential will experience a “rush of current” (i.e., charging current) that will gradually disappear.
Power factor is, today, considered to be a significant characteristic of interest for paper/fluid systems. Related to this, another measurement referred to as “ionization factor” is relevant; this is the difference in power factor measured at two stresses (one high and one low). Also, the relationship between power factor and temperature is as relevant today as it was in the past (as any increase in losses as one approaches operating temperature could lead to thermal runaway and reliability concerns).
Overall, perhaps the most significant practical technical difference between solid dielectrics and fluid systems is that the latter provide a fluid that can impregnate voids that may develop and prevent them from leading to shortened life (see Section 6.4.4).
We have reviewed the concepts of VR, polarization, dielectric constant, dielectric loss, and interfacial polarization for insulation materials, as well as leakage current regarding cables. We have noted that:
• VR is a clearly defined property that tells how good the polymer is as an insulation material.
• Polarization is a measure of the response of the polymer dipoles to the applied stress and also influences the extent of degradation.
• Dielectric constant provides information on how well the insulation holds charge; nonpolar insulations have lower values than polar ones, and dielectric loss tells us about the energy dissipated as heat as a result of the voltage stress being applied and resulting polarization.
• Interfacial polarization is a phenomenon relevant to mineral filled systems (as well as what happens during aging).
We have also seen that, in a cable construction, the voltage stress may induce a leakage current through the insulation despite it functioning as desired; leakage current provides some practical qualitative indication of the future reliability of the cable system.
It is clear at this point that all these parameters are intimately related and a change in one affects the others.
6.4 INSULATION RESPONSE AT HIGH STRESS
High stress is defined here as either higher than normal applied stress (greater than operating stress) or higher than normal localized stress. The latter refers to sites within the insulation wall that have degraded, or sites where voids or foreign contaminants are located. In these latter cases, the local stress may be higher than operating stress, even though the operating stress may be low. This section discusses dielectric strength and breakdown, and encompasses failure of insulation materials and parameters influencing the same, test methods, and partial discharges (the main cause of failure).
In reviewing insulation response at high voltage stress, the discussion will focus on cables as well as the materials. The reason is that we are eventually discussing failure, and there are issues involving cable failure mechanisms that are not relevant for insulation materials alone. An example would be partial discharge (Section 6.4.5), which is a more relevant failure mode for insulation in fabricated cables than for insulations alone; this is due to the greater probability of voids being present in cables as compared with polymer slabs. Hence, we will be reviewing both insulation and cable failure modes in part of the discussion of insulation response to high stress.
When the operating stress is high, the relevant properties discussed in Section 6.3 can be superseded in importance, as the insulation is now more susceptible to failure. This occurs when the voltage can no longer be maintained without physical disruption of the insulation. A stream of electrons is released and the excess current passes through the insulation (see Section 6.4.4). The key parameter influencing the response is the dielectric strength of the insulation. The dielectric strength can be defined as the limiting voltage stress beyond which the dielectric can no longer maintain its integrity; a distinct rupture occurs leaving char and a nonfunctional insulation. The breakdown strength value is high initially, and in order for failure to occur, the applied stress must be very high. As the insulation ages under thermal or thermal/voltage stress (in the presence or absence of water), the dielectric strength drops and the increase in applied voltage stress required to induce failure is reduced. This applies to laboratory testing of insulation materials, full size cables, or cables in service.
The reason for the reduction in dielectric strength upon aging is due to defects developing upon aging, or small defects present initially becoming larger. This applies to all insulation materials (and cables). Water presence accelerates the process, and water tree development upon aging represents one well-known phenomenon leading to reduced dielectric strength of extruded cable materials and cables (see Chapter 19).
The dielectric strength is reported as the applied voltage at which the insulation fails, in volts per mil (or kV/mm) of insulation thickness.
The dielectric strength can be determined via different methods; by applying DC, AC (of different frequencies), or impulse. For cables, AC is most common (as the cables operate at 50–60 Hz) and impulse is of interest to simulate lightning and switching surges. Test methods on cables are discussed in Chapter 10. For materials testing, AC and DC are common. The rate of rise of applied AC voltage on small test samples is often greater than on full size cables (see Section 6.4.4).
Although not a direct cause of failure, mention should be made of water trees as their presence causes a reduction in dielectric strength. Water trees growing under low (normal) operating stress can penetrate the entire insulation wall and yet the cable can continue to function without causing immediate failure. Water trees consist of water-filled small voids separated by “tracks” of oxidized polymer, and water-treed regions possess higher K than the surrounding polymer matrix (at least for XLPE). Failure occurs only after water trees are converted to electrical trees; the two types of treeing defects have different shapes. The differences are summarized as follows:
WATER TREES |
ELECTRICAL TREES |
Water required |
Water not required |
Fan or bush shaped |
Needle or spindle shaped |
Grow for years |
Failure shortly after formation |
Microvoids connected by tracks of oxidized polymer |
Carbonized regions |
The next section discusses breakdown measurements and testing in more detail.
When studying insulation materials, several possible methods can be employed. Small samples of the insulation material in slab or block form are placed between electrodes. The electrode shape and size represent a significant parameter for small sample testing (and is always defined). Voltage stress is applied and increased until failure occurs. One common method employs a needle electrode (Figure 6.8). A sharp but controlled radius of curvature exists at the needle tip, and the latter is inserted into the specimen (flat sheet or slab) part way to the ground plane (it may be inserted while warm to avoid inducing “cracks” in semicrystalline polymers). Voltage stress is applied and raised under controlled conditions until failure occurs. Failure of the test specimen is induced at the location of the sharp needle, an intentional high stress site. The dielectric strength is recorded as kilovolts per millimeter (or V/mil). This test methodology simulates the influence of a sharp defect within the insulation, and it is not uncommon to be employed when studying the influence of additives on dielectric strength.
Another common method employs curved electrodes (Figure 6.9) which are inserted into the polymer slab or block; this provides a uniform stress gradient (in contrast to the use of sharp needles) and provides an understanding of the dielectric strength of insulation itself, which can fail anywhere at the interface of the electrode and the polymer. The electrodes are referred to as Rogowski electrodes, and the test conditions are the same.
These test configurations represent two common methods employed to determine the dielectric strength of insulation materials (not cables). In actual practice, many variables must be controlled to ensure that reliable data is obtained. These include control of:
FIGURE 6.8 Depiction of needle electrode for performing breakdown test.
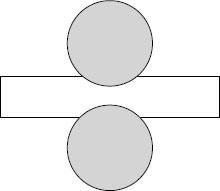
FIGURE 6.9 Curved Rogowski electrodes provide uniform voltage stress gradient during dielectric strength testing.
• Sample thickness
• Pretreatment of specimens (e.g., annealing)
• Temperature
• Environment (relative humidity)
• Electrode nature (described above)
• Test parameters
• Rate of rise of applied voltage
• Test frequency; one can employ DC, 50–60Hz, or impulse
Failure during testing as described must occur at the electrode/polymer interface (see Figure 6.9) and not along the periphery (edge) of the sample; if the latter occurs it is referred to as flashover, which is not a valid indication of the insulation integrity. If foreign contaminants (such as metals) are present within the sample they act as localized high stress sites and will be the region where the failure occurs. Finally, since relatively small specimens are involved (compared to full size cables), a large number of specimens are tested to overcome the inherent variability in results, and the results are analyzed statistically.
One can expect that at the interface of a high surface energy material (metal) and a low surface energy material (nonpolar polymer), there will exist a weak boundary layer.
A materials test method for inducing degradation (ASTM D-6097) that leads to failure requires mention. This test method is intended to study water tree growth, but failure is possible depending on the test conditions and the material. Small molded specimens of insulation (or as a composite with semiconducting shields) are employed. A conical defect is molded into small specimens (using a steel needle). Samples (at least 10) are aged in a defined salt water solution under voltage stress for a controlled time period (30–90 days).
Test methods for full size cables are more complex (and more expensive), as the total construction is involved (conductor, shields, and insulation) and the polymer layers are significantly thicker. For this reason, sometimes model cables are employed; a model cable might have a ~ 60 mil wall with strand shield and insulation shield layers significantly less thick. Miniature and full size cable tests are performed for accelerating water tree growth. Full size testing of insulated cables is discussed in Chapter 10 (Standards and Specifications).
Failure occurs when the applied stress is greater than that the insulation material can withstand. As the dielectric strength drops upon aging, failure is more likely (at any specific operating stress). Although dielectric strength is the most common and most important parameter relative to quantification of insulation failure, there are several issues relative to the technology of measurement and interpretation that require clarification.
Perhaps the most obvious assumption is that the value of the measured dielectric strength would be anticipated to be the intrinsic strength of the insulation. This is defined as the dielectric strength characteristics of the material itself in its pure and defect-free state, and measured under ideal test conditions, and that allows breakdown at the highest possible voltage stress. In practice, however, this is never achieved. One reason is the difficulty in attaining defect-free pure insulation specimens. We have already referred to the small amount of oxidation that normally occurs during manufacture. In addition, the fact is that as the test specimen insulation thickness increases, the chances of extremely small (micro) voids developing as a result of the fabrication process also increases. Voids above a certain size are weak links that lead to failure (see Section 6.4.5). Hence, (for example) a 2 cm thick slab would be expected to possess more small (micro) voids than a 1 cm thick slab (or film). For thicker slabs, the problem increases and this is one of the reasons that the dielectric strength of a full size cable (e.g., 175 mil/445 mm wall thickness) in volts per mil or kilovolts per millimeter is significantly less than that of a slab or thin film of the same insulation material.
The closest one can come to intrinsic dielectric strength is by performing measurements of very thin, carefully prepared films with appropriate electrodes. Under these ideal conditions, the insulation itself would come closer to failing due to its inherent properties.
6.4.4.2 Breakdown Strength Considerations
The following points require consideration when evaluating the significance of breakdown strength information.
1. The field strength at which breakdown occurs depends on the respective geometries of the insulation and the electrodes with which the electric field is applied. For insulation materials tests and cable tests these are defined, but it is obvious that they differ significantly; this is one factor that leads to different values of dielectric strength between the materials and cable tests.
2. We have referred to the fact that the insulation materials will contain minute defects, due to processing-induced localized degradation. This leads to a reduction of the dielectric strength that may be far below the intrinsic value of the defect-free material. Since this degree of degradation (oxidation) may differ significantly between samples (slabs or cable sections), this may manifest itself as different breakdown values for apparently similar samples. In addition, foreign ions may be nonuniformly dispersed in the insulation wall, contributing to the nonuniformity from one sample to another.
3. The apparent dielectric strength for common polymeric insulation materials at breakdown (kilovolts) increases with an increase in thickness of the test specimen; however, when normalizing the dielectric strength data for thickness, the breakdown strength in terms of volts per mil (kilovolts per millimeter) basis is reduced.
4. The measured dielectric strength is related to the rate of increase at which the voltage stress is applied. Hence, the results will vary as the test conditions are varied. This is another reason why the breakdown values (kilovolts per millimeter) obtained when an insulation fails are not absolute.
To compensate for this, industry specifications control this parameter. Thus, referring to Figure 6.10 (see Section 6.4.4.3), the AC breakdown strength data shown was obtained employing a 5 min step rise time. What this means is that when starting the test, the voltage (always initially at about 50% of the anticipated breakdown strength) was applied and held for 5 min; the voltage was then increased (by 40 V/mil, or 1.6 V/mm) and held for another 5 min. The process is repeated by increasing the voltage by the same amount and holding for 5 min at each volt per mil (kilovolts per millimeter) value, until failure occurs. By controlling the voltage stress increase and keeping it constant, this variable is eliminated.
5. The apparent dielectric strength decreases with an increase in operating temperature; we have previously seen (Chapter 5) how increasing molecular motion as the temperature is increased influences properties.
6. It is also possible for failure to occur by thermal runaway; this can occur when the rate of temperature increase within the insulation is greater than the rate of heat dissipation. Under voltage stress, some insulation systems that possess high losses will generate heat, and if the rate of heating exceeds the rate of cooling (that normally occurs by thermal transfer), then thermal runaway can occur, and the insulation fails by essentially, thermally induced degradation. Several relevant points are as follows: (1) the heat transfer capability of polyolefins is low and heat dissipation is normally not rapid, (2) these events may occur in the presence or absence of discharges (see Section 6.5), and (3) the presence of additives such as inorganic fillers or organic components can contribute to increasing dielectric losses. For direct buried cables, the soil nature plays a role here.
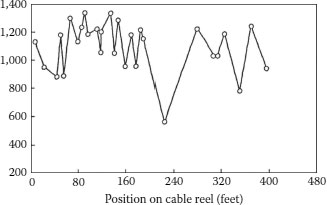
FIGURE 6.10 AC breakdown of XLPE insulated cables.
7. For completion, it is noted here that shielded cables can fail by a different mechanism involving corrosion of the concentric neutrals, leading to erosion of the insulation shield and eventual degradation of the outer region of the extruded cable insulation.
The main lesson here is that when discussing dielectric strength, it is essential to understand how the test was performed. In comparing AC dielectric strength values for tests performed at different times and at different locations, it is vital to understand relevant test parameters. This holds true whether one is comparing different grades of the same material (different grades of polyethylene or XLPE) or different insulation materials (Polyethylene versus polypropylene or EPR). It is emphasized that it is particularly important, when comparing the properties of different grades of an insulation, to ensure that the same test conditions are employed.
Measurements involving breakdown testing of polymer insulations provide values that vary among duplicate test samples; the test results are not always identical, and this statistical variation is inherent. As an example, Figure 6.10 shows the AC breakdown strengths of 30 ft lengths of full size XLPE cables obtained from a 5,000 ft reel of a 50,000 foot extrusion run. The cables tested are as identical as possible: same conductor, same strand shield, same insulation shield, same insulation, and same extrusion conditions, as well as same AC breakdown strength test procedure. Hence, despite the fact that sample lengths tested were from the same production run and from the same reel, the dielectric strength of the full size cables varies from a low of about 600 V/mil to a maximum of about 1,350 V/mil. This demonstrates that although the cable was manufactured in (presumably) the same manner, significant differences can exist between cable sections. [This is the type of breakdown strength measurement commonly performed on full size cables as an aid in characterization.]
From what has been noted above in referring to physicochemical phenomena that affect electrical properties, it is most likely that these variations are due to the inevitable imperfections that result during processing (although other factors noted in Section 6.4.4 2 can be involved). Variations such as these are not uncommon.
The manner in which this information is handled is to analyze the data in a statistical manner. The method considered to be most reliable is the Weibull distribution (log normal distributions are also commonly employed). The breakdown strength values are plotted against the cumulative probability of failure. Thus, if there are 10 samples that were tested and failed, the individual breakdown strengths are plotted on the X axis with the first sample representing 10% of the total tested samples on the Y axis, the second value would be 20 %, and so forth. If there were 20 breakdown strength tests performed, the first value plotted would be the 5% value. (If there were only four samples tested, the first value would represent 25%.)
In an ideal situation, a straight line is obtained (commercially available software is employed, although in the past, manual handling of data on probability paper was performed). The least squares fit of this straight line provides the two parameters of interest: (a) the scale parameter, which is the 63.2% probability of failure, and (b) the shape parameter, which is the slope of the line. The scale parameter is what is generally reported in the technical literature; however, one is often interested in the early failures. This is where the shape parameter is important as it provides guidance on the spread of the failure data. A vertical slope indicates a uniform cable, while a slope that trends away from vertical is indicative of nonuniformity and differences between samples (insulation slabs or cable) lengths.
Thus, a breakdown strength value considered to be the “best value” for multiple samples tested in an identical manner requires supplemental information on the spread of the data to be truly meaningful.
Partial discharge is due to decomposition of air in the voids within the insulation material wall or at the surface–shield interface. The discharges lead to eventual degradation and failure of the polymer. This process, which involves electron and ion bombardment, is a major cause of insulation failure in cables. Void presence may be due to impurities that lead to poor interfacial contact, aging-induced degradation, or less likely, perhaps, is related to the manufacturing process. This section covers the basic fundamentals from the perspective of electrical properties of polymeric insulation. Aspects of partial discharge events not directly related to insulation materials phenomena are noted here, but not covered in this chapter: these include high frequency signals that travel along the conductor and shield, electromagnetic waves that radiate in the surrounding area, and light and acoustic wave emission. For a discussion of the significance of discharge patterns or pulse magnitudes, references should be consulted.
Small voids may be present within the insulation of extruded cables due to aginginduced changes leading to their development. Voids above a certain size are not present in extruded cables that are required to meet industry specification requirements; partial discharge testing is performed on newly manufactured cables precisely to prevent cables with voids of certain sizes (and quantities) to reach the user.
The dielectric strength of air (in the void) must be understood. The greater the dielectric strength of the insulation material, the greater the resistance to degradation under discharge conditions. Thus, while the dielectric strength of the thin films of (polyethylene or XLPE) insulation itself is very high (perhaps as high as 16,000 V/mil), that of air is lower by 2–3 orders of magnitude and it is more susceptible to degradation by the accelerated electrons.
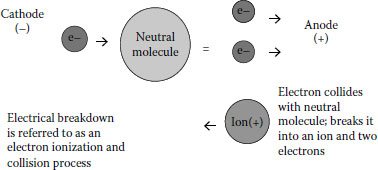
FIGURE 6.11 Electron decomposes air molecule to yield additional electrons and anions.
Void size (diameter), shape, pressure, and temperature all have a significant influence on the discharge events that occur (see below). Different insulation materials can respond differently when subjected to the energized electrons, but the fundamental degradation response of air will not change.
The air degradation process leads to additional electrons and ions being formed. This is depicted in Figure 6.11.
Degradation of the air, which is ~80% nitrogen, can lead to ions and other degradation products that possess nitrogen (e.g., nitrogen oxides). Once the newly formed ions and electrons are generated, they continue the process; attacking the remaining air in the void. This is depicted in Figure 6.12.
At some point a threshold is passed and an avalanche occurs; this avalanche is referred to as the partial discharge inception voltage (PDIV) (see Section 6.5.4.3.1). After the avalanche occurs, the voltage across the void momentarily drops to zero (or almost zero). This is the partial discharge extinction voltage (PDEV). For the discharge process to continue and additional avalanches to occur, the voltage must build up again. It is this repetitive process of degradation of the air in the voids that is so harmful. Hence, discharges lead to avalanches within the voids that cause air degradation.
6.4.5.2 What Happens to the Insulation
As the repetitive avalanche process continues, the insulation wall will eventually be attacked at the solid/gas interfacial region. This leads to polymer chain scission and additional degradation products; gases such as carbon monoxide and dioxide, methane, and other low molecular weight hydrocarbons are generated. Inorganic carbonates also form; this is in addition to the degradation products caused by the degradation of air. Furthermore, electrons, ions, and other degradation products can be deposited at the surface of the insulation (which is now more highly oxidized and therefore more polar). The trapped charges may remain there (for a finite time) and be released at a later time. As the process continues, the degradation process works its way deeper and into the region away from the original void and from the polymer surface. In place of the original polymer insulation, there now exists degraded polymer, a highly oxidized black char residue that renders the insulation noncontinuous. This is part of an electrical tree, a hollow channel that is filled with air and other gases from the degradation process. As this process continues further, the degraded region will eventually reach the surface of the insulation causing a breach in the insulation continuity. Since this degraded polymer is ruptured, it is no longer insulating and failure occurs.
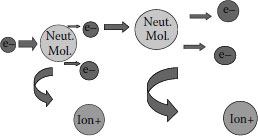
FIGURE 6.12 Generated electrons react with additional neutral molecules.
This degradation mechanism is more likely to occur with cables than with thin films or slabs of the same polymeric insulation material. The processing methodology for preparing films or slabs (e.g., injection molding) is more likely to remove any very small voids that could persist during the extrusion process employed for cables (and grow upon aging), e.g., a conventional medium voltage distribution cable may have an insulation thickness of 175 mils versus 1–5 mils for a slab. However, needle tests on slabs (see Chapter 5) can lead to void development.
For paper/fluid systems, the possibility of void formation at butt spaces during load cycling has been discussed (Section 5.10.2.3).
Although the events in the voids and in the insulation are discussed separately in Section 6.4.5.1 and Section 6.4.5.2, they can occur simultaneously as the process continues.
6.4.5.3 Key Partial Discharge Phenomena Parameters
Some major concepts related to influencing partial discharges that affect degradation rate are introduced here. For further details, references should be consulted.
6.4.5.3.1 Partial Discharge Inception Voltage and Partial Discharge Extinction Voltage
PDIV will be influenced by the following factors:
• Geometry of the void: In most cases, the voids are spherical or ellipsoidal. However, a void adjacent to a high energy surface such as a metal particle may be elongated. The “sharper” the tip of the void, the lower the PDIV.
• Location in the cable wall: For any void of constant diameter/shape, the closer to the conductor (i.e., the higher stress regions), the lower the PDIV.
• Pressure of the gas (air) in the void: Increasing pressure increases PDIV; however, this parameter may vary as a result of the discharge process. Thus, the gases produced by degradation of air or of the insulation wall can lead to dynamic pressure changes.
• Void size: Larger voids are more susceptible to discharges (all other factors being equal) as the probability of the air in the larger volume being attacked by an electron is greater.
After the discharge takes place, the voltage drops and at some point, ceases entirely; this is referred to as the PDEV. Then the process starts over again.
The statistical time lag is the time required for a free electron to initiate the discharge once the voltage across the void reaches the actual breakdown voltage. [The longer this time lag, the greater will be the actual breakdown voltage developed (within the void) before breakdown occurs.] The existence of the time lag can be viewed from the perspective of the major components; what is happening to the air (oxygen and nitrogen) as well as the polymer insulation. Oxygen is an electronegative gas, which means that it will attract electrons to a greater extent than will nitrogen. In the early stages, electrons present are “trapped” by the electronegative gas, resulting in a relatively long waiting time (reduced availability of the initiating electron) for degradation to start. As the oxygen is “consumed,” the waiting time is diminished. This waiting time can be, initially, in the order of minutes, and drops later to milliseconds.
This phenomenon is intimately related to what happens not only in the void but at the polymer surface also. As the polymer chains become oxidized, the ability of the modified polymer to trap electrons is increased. Trapped electrons that result early in the process can be released later in the process. [At the beginning, there are very few electrons that can be released in this manner.] This overall process is referred to as the statistical time lag, which is “long” at the beginning but becomes “shorter” as trapped electrons are released.
It should not be forgotten that when discharges occur, ions are deposited at the opposite end of the void.
The collapse of the voltage to zero when PDEV occurs may actually not fully occur. In other words, some “residual” voltage across the void may persist in the absence of discharges. This is not necessarily uncommon, but is generally small. (In the extreme case, not relevant to cables, continuous glow discharges can occur if the residual voltage is large and approaches the actual breakdown voltage.) Residue voltage is related to void size, partial discharge repetition, and conductivity of the degraded polymer insulation wall. The significance of residue voltage is that voids that would not exhibit partial discharge early in the process may do so after the residue voltage builds up due to subsequent discharges.
Electrical properties have been reviewed from the perspective of what happens when insulation materials (and cables) are subjected to low and high voltage stress. VR and insulation resistance are defined. Under low stress, the chemical structure of polymeric insulation materials influences the dielectric constant, DF, and polarization of the insulation molecules. The phenomenon of dispersion has been reviewed; the ability of the polymer insulation molecules (of varying molecular weights and degree of polarity) to respond to changes in frequency, and how this influences power factor and permittivity.
These properties are significant at operating stress. Polyolefins such as polyethylene, XLPE, and unfilled ethylene-propylene copolymers have low dielectric constants and low DFs. Low levels of oxidation, generally resulting from processing the polymer or aging-induced changes, lead to slight increases in these properties. Insulation materials with inorganic fillers (such as EPR) or additives that are polar in nature (such as some TR-XLPE insulation materials) have increased dielectric constants and DFs. The phenomenon of interfacial polarization with reference to mineral-filled materials is discussed.
At higher than normal operating voltage stress, the insulation’s ability to maintain its continuity and integrity is challenged. Higher than normal stress can be either the applied stress, or even higher than normal localized stress. The key property here is the insulation’s dielectric strength, that can drop on aging and is followed by breakdown. Test methods for determining dielectric strength of polymeric insulation materials are discussed and the normal spread of dielectric strength data is analyzed.
Finally, the subject of partial discharge is introduced. Partial discharge is a failure mechanism resulting from decomposition of air in voids within the insulation. The decomposition products attack the air and the insulation itself, eventually causing electric trees and failure. Partial discharge (PD) is a very complex topic and a few key concepts resulting in degradation of the insulation from electron and ion bombardment are reviewed [inception and extinction voltages, time lag, (for PD to initiate) and residue voltage (which influences breakdown on subsequent discharges).
1. Alger, M., 1997, “Polymer Science Dictionary,” Springer Press.
2. Bartnikas, R. (ed.), 2000, “Power and Communication Cables,” McGraw Hill and IEEE Press.
3. Dissado, L. A. and Fothergill, J. C., 1992, “Electrical Degradation and Breakdown in Polymers,” G. C. Stevens (ed.), Peter Peregrinus Ltd.
4. Dunsheath, P., 1929, “High Voltage Cables,” Sir Isaac Pitman and Sons Ltd.
5. Ku, C. C. and Liepens, C. R., 1987, “Electrical Properties of Polymers: Chemical Principles,” Hanser Publ.
6. Miller, M. L., “The Structure of Polymers,” SPE Polymer Science and Engineering Series, Reinhold Book Corporation.
7. Nobile, P. and LaPlatney, C., September–October 1987, “Field Testing of Cables: Theory and Practice,” IEEE Transactions on Industry Applications, Vol. 1A-23 (No. 5).
8. Nelson, W. B., 2005, “Applied Life Data Analysis,” John Wiley and Sons.