INFLATIONARY SALARY MECHANISMS
DO FIRMS HAVE SHORT MEMORIES?: EVIDENCE FROM MAJOR LEAGUE BASEBALL
Andrew Healy
A growing, and now large, body of evidence indicates that economic agents often do not conform to the classical rational model of behavior. In many cases, bounded rationality better describes behavior (Kahneman, 2003; Simon, 1957). Rather than carefully considering all available information, agents often rely on rules of thumb to solve problems, particularly when those problems are complex (Tversky & Kahneman, 1974). One rule of thumb that may cause significant inefficiencies involves limited memory. Psychological research shows that people tend to primarily remember only salient events (Thompson, Reyes, & Bower, 1979). If economic agents forget or ignore less salient information, they will fail to act optimally when making decisions that could be improved by that information. This article shows that these limits to memory lead firms to make systematic mistakes in their salary offers.
Because performance and pay are easily measured, the market for baseball players offers an ideal laboratory for testing theories about compensation (Kahn, 1993; Sommers & Quinton, 1982), including theories relating to the effect of limited memory on salary offers. Also because salaries are so high, the costs of any mistakes are amplified. The presence of inefficient behavior in the market for baseball players would likely extend to other environments where the stakes are lower. The data show that teams are susceptible to a specific kind of inefficient behavior. Teams reward players for performing well in the immediate past, ignoring other evidence of a player’s quality from his earlier performance. When choosing salary offers, teams have short memories.
This finding will likely not surprise baseball fans. Many anecdotes suggest that players often receive excessively lucrative contracts after one anomalous good season. For example, Adrian Beltre, a third baseman for the Los Angeles Dodgers, had an exceptional season in 2004. After the 2004 season, despite the absence of any similar success in the preceding years, the Seattle Mariners offered Beltre a 5-year $64 million contract. The contract paid Beltre as if he would continue to perform at his 2004 level, but he has instead reverted to his pre-2004 form.1 Although other anecdotes also suggest that players are excessively rewarded for performing well in the final years of their contracts, testing the hypothesis that teams have short memories requires a comprehensive analysis of players’ salaries.
In this article, I analyze salary and performance data for all major league baseball hitters who signed free agent contracts from 1985 to 2004. The data show that a player’s performance this year is predicted about 20% more strongly by his performances from 2 and 3 years ago than by his performance from last year by itself. In contrast, a player’s salary this year depends only half as much on his performances from 2 and 3 years ago as on his performance from last year. In other words, for determining future performance, there is more information in a player’s earlier performance history than in his performance last year alone. Salaries, however, respond much more strongly to performance in that most recent year than to the earlier performance history.
Teams are not equally prone to underweighing earlier performance relative to recent performance. Controlling for total payroll, the teams that win the most games use past performance data most effectively. Only the unsuccessful teams put significantly too much weight on recent performance relative to earlier performance. One plausible explanation for this result is that well-managed teams are less susceptible to making memory-based mistakes in their salary offers.
What could cause memory-based biases to affect baseball salaries? Previous research in the psychology of memory offers a compelling explanation. People often access the most salient memories when making decisions. Reacting primarily to salient memories in this way corresponds to the availability heuristic (Kahneman & Tversky, 1973; Mullainathan, 2002). The most salient memory about a player who just had a remarkable season may be his recent outstanding play, whereas other relevant performance data fail to stand out as much. Availability could have caused the Seattle Mariners, for example, to believe that Adrian Beltre’s lone exceptional season more accurately described the player’s skills than his previous years of unexceptional play.2 In general, this sort of behavior could explain why teams fail to take into account a player’s performance in earlier years when making a salary offer.
….
ESTIMATION STRATEGY
As in previous research using baseball data, I focus on a player’s contribution toward winning games, through which the player affects a team’s revenues (Quirk & Fort, 1992; Scully, 1974; Sommers & Quinton, 1982). The previous research indicates that, to maximize revenues, a team primarily needs to focus on winning games. To the extent that other factors influence salary offers, the estimation strategy only requires that those other factors are not related to changes in a player’s performance history over time.
In this article, I will focus entirely on hitters. A variety of measures captures different aspects of a hitter’s value to his team. The number of homeruns that a player hits, a player’s on-base percentage, and his slugging percentage are three such measures. Previous research suggests that a measure called OPS, the sum of on-base percentage and slugging percentage, is the best single measure of a player’s offensive value (Albert & Bennett, 2001). In this article, I use OPS to measure a player’s worth.
….
THE DATA
To test hypotheses relating to how effectively teams use past performance data to make salary offers, I use data on free agent signings in major league baseball from 1985 to 2004. The term free agent refers to a player whose contract has expired and who is free to negotiate with all teams except his original team. The competition for highly valued free agents can be fierce.3
For the analysis, I focus on free agent signings that occur between October and April, when regular-season games are not taking place and the vast majority of free agent signings occur. Focusing on off-season signings allows for a clear comparison between a player’s performance before and after the contract is signed. Of those signings, the regressions in this study are based on all observations for which players have at least 200 at-bats in the previous two or three seasons.4 By using this sample, I analyze the performance and salary data for all players who have played a significant amount of time in each of the 3 years preceding the signing of the free agent contract.
The data on players’ salaries and past performances are obtained from The Baseball Archive.5 The past performance data include measures of every standard statistic for each player. I construct a player’s OPS by adding his on-base percentage and slugging percentage. The salary information refers to a player’s base salary for the given years. To determine free agent signings, I use the data on baseball transactions compiled by Retrosheet (2006). These data contain information on all free agent signings that occur from 1985 to 2004.
The data show that the average salary has increased from $500,000 in 1985 to $2.8 million in 2004. Baseball salaries are also highly skewed and have become more skewed over time. The median baseball salaries in 1985 and 2004 were $410,000 and $870,000, respectively….
RESULTS
In this section, I estimate how a player’s performance history affects current performance and salary. The data show that past performance predicts current performance and salary in strikingly different ways. In addition, the data show that these differences and the inefficiencies they imply do not occur for the teams that are generally managed more effectively.
Testing for Short Memories
… [A] player’s performance is predicted only slightly more effectively by last year’s performance than by his performance from 2 years ago…. On the other hand, an increase in last year’s performance is about twice as effective at increasing that player’s salary as is an increase in performance from 2 years ago….
Although teams could do somewhat better by assigning more weight to performance data from 2 years ago, they are even more ineffective at using earlier performance data….
Teams’ incorrect weighting of previous performance information occurs primarily for older players, as shown in Table 7. Comparing players who are 32 and younger to those who are 33 and older breaks the data roughly in half. Relative to last year’s performance, earlier performances predict current performance about equally well for older and younger players. To some extent, all previous performances (last year and earlier) predict current performance less well for older players. The stark difference between older and younger players, however, occurs for salary. For younger players, performance last year predicts salary about 1.5 times more strongly than performance from 2 years ago. For older players, this ratio is more than 4. Teams appear to have particularly short memories for older players. Teams pay older players almost entirely based on their performance in the previous season, and the data show that, by doing so, they make significant mistakes in their salary offers.
Testing for Optimal Use of Previous Performance Data
…. If teams use past performance data in an optimal way, they will use past performance data to determine salary offers in the same way that those performances affect current performance…. For example, for current performance, the predictive power of performance from 2 years ago is about 0.864 times as large as performance from last year. For salary, the predictive power of performance from 2 years ago relative is about 0.451 times as large as performance from last year…. In predicting current performance, the effect of performance from 3 years ago is about 0.448 times the effect of performance from last year. The estimated effect of performance from 3 years ago on salary is only 0.053 times the effect of last year’s performance….
Taken together, the effects of all three earlier years on performance and salary indicate the significant gap between how teams actually use past performance data and how they would optimally use that information. For current performance, the predictive power of performance from 2 and 3 years ago is about 1.312 times larger than performance from last year. For salary, the predictive power of performance from 2 and 3 years ago is only 0.505 times the performance from last year. The difference between these two ratios is significant (p = .016). If the goal is to predict how well a player will perform, there is more combined information in that player’s performances from 2 and 3 years ago than in his performance from last year by itself. Nevertheless, teams put about twice as much weight on last year’s performance as on a player’s performance from 2 and 3 years ago. The data thus reject the hypothesis that teams correctly use players’ past performance histories to determine their salary offers.
Table 7 Comparing Across Age Groups
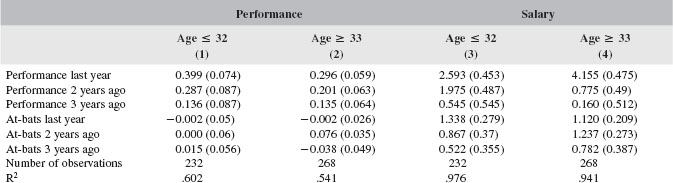
Source: Journal of Sports Economics. Used with permission.
Successful and Unsuccessful Teams
… I plot average wins against a team’s average payroll relative to the other major league baseball teams from 1985 to 2004. To calculate relative payroll in a season, I divide each team’s total payroll in a season by the mean payroll for all teams. Then, I take the mean relative payroll for each team across seasons…. In the discussion below, I refer to the teams that have achieved more wins than their payrolls would predict as successful teams. I refer to the teams that have achieved fewer wins than their payrolls would predict as unsuccessful teams.
By the standard of getting the most wins out of the salaries it has paid, Oakland has been the most successful team in baseball. Oakland averaged 86 wins per season from 1985 to 2004, even though its average payroll during that time predicts only 79 wins. On the other end, Tampa Bay was the least successful team, averaging only 65 wins from 1998 to 2004, 10 fewer wins than the 75 wins that its average payroll predicts.8 …
This classification makes it possible to test for differences in how successful teams use past performance information compared with how unsuccessful teams use that information….
… [S]uccessful teams do a better job of making their salary offers match up with how past performance data predict players’ present performances.9 This result comes from two different sources. (See Table 8.) First, compared with unsuccessful teams, successful teams put higher relative weight on performances from 2 and 3 years ago when determining their salary offers. Second, successful teams sign players whose current performance is better predicted by last year’s performance. In other words, successful teams base their salary offers more on earlier performances than unsuccessful teams and, to the extent that successful teams sign players who performed well in the most recent year, those teams pick players for whom that recent success actually does foretell future success.
… One possible explanation for these differences in the types of players that successful and unsuccessful teams sign is that unsuccessful teams are more susceptible to over-paying players who have good statistics in the most recent season because of luck. To illustrate this idea, consider the example of Adrian Beltre, the player who signed a lucrative contract after one anomalous excellent season and then did not perform as well in the following season. If unsuccessful teams are particularly prone to signing players after one anomalous good season, then the players that these teams sign will have their performances better predicted by earlier years than players signed by successful teams.
… [O]nly the unsuccessful teams show significant memory-based biases in their salary offers. The successful teams treat past performance data similar to how they optimally would….
In contrast, the unsuccessful teams use past performance data to determine salaries in a significantly different way than that information predicts future performance…. Relative to last year’s performance, a player’s earlier performances from 2 and 3 years ago predict current performance almost 4 times more effectively than it predicts that player’s salary. No such difference is present for the successful teams.
CONCLUSION
To best use the dollars that they spend on salaries, organizations need to predict how well players will perform in the future. The data show that organizations make systematic mistakes in how they make these predictions. Teams infer too much from players’ performances in the most recent season relative to performances from earlier years. The organizations that make these mistakes are the same ones that generally fail to spend their resources well. Organizations that are otherwise more successful also use past performance data more effectively. The sizeable mistakes that unsuccessful teams make could arise from two different hypotheses about player behavior in the final year of a contract. First, it may be the case that players are rewarded for good luck in the last season of their contract, as previous research has demonstrated that CEOs are rewarded for luck (Bertrand & Mullainathan, 2001). In support of this hypothesis, Albert and Bennett (2001) show that a player’s performance in any given year reflects a great deal of luck. On the other hand, there may be certain players who exert greater effort in the final years of their contracts and certain teams repeatedly fail to recognize this behavior. The tendency shown in this article for teams to excessively reward performance at the end of a contract would amplify a player’s incentive to try harder in his contract year. Future research could attempt to determine whether teams are rewarding players for luck in the final years of their contracts or for extra effort that they exerted in their contract years.
….
Table 8 Last Year’s Effect Compared with Earlier Years
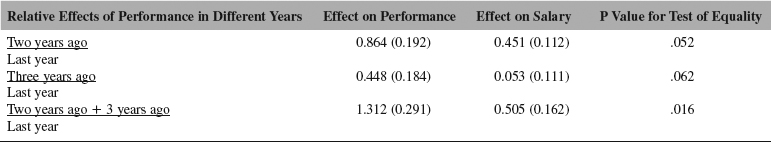
Source: Journal of Sports Economics. Used with permission.
1. Statisticians often use on-base plus slugging percentage (OPS) to measure a hitter’s performance (Albert & Bennett, 2001). From 1999 to 2003, Beltre averaged a 0.756 OPS with a highest value of 0.835 in 2000. Then in 2004, his OPS jumped to 1.017. In the two seasons since, Beltre had a 0.716 and 0.793 OPS, respectively.
2. A related phenomenon, the “hot hand,’’ can also be understood by invoking the availability heuristic as it applies to memory. Camerer (1989), for example, found that bettors incorrectly believe that a basketball team that has had recent success will also have future success. Likewise, Gray and Gray (1997) found that odds for football games are skewed toward teams that have had recent success. They find that bettors’ behavior “is consistent with the idea that the market overreacts to recent form, discounting the performance of the team over the season as a whole.’’
3. Baseball players gained the right to free agency in 1976. Even though owners of baseball teams have been found guilty of colluding to keep players’ salaries down as recently as the early 1990s, there is sufficient competition in the market for baseball players that experienced players have been receiving approximately marginal product wages going back to at least 1986 (MacDonald & Reynolds, 1994).
4. Using other at-bat thresholds, such as 150 or 300 at-bats has no effect on the general results.
5. I thank Sean Lahman of The Baseball Archive (2006) for help in accessing these data.
….
8. Tampa Bay entered major league baseball as an expansion team in 1998.
9. In addition, the R2 for the salary regressions is larger for the successful teams than for the unsuccessful teams, indicating that there is less unexplained variation in the salary offers made by successful teams.
References
Albert, J., & Bennett, J. (2001). Curve ball: Baseball, statistics and the role of chance in the game. New York: Springer.
Bertrand, M., & Mullainathan, S. (2001). Are CEOs rewarded for luck? The ones without principals are. Quarterly Journal of Economics, 116, 901–932.
Camerer, C. (1989). Does the basketball market believe in the “hot hand’’? American Economic Review, 79, 1257–1261.
Gray, P., & Gray, S. (1997). Testing market efficiency: Evidence from the NFL sports betting market. Journal of Finance, 52, 1725–1737.
Kahn, L. (1993). Free agency, long-term contracts and compensation in major league baseball: Estimates from panel data. Review of Economics and Statistics, 75, 157–164.
Kahneman, D. (2003). Maps of bounded rationality: Psychology for behavioral economics. American Economic Review, 93, 1449–1475.
Kahneman, D., & Tversky, A. (1973). Availability: A heuristic for judging frequency and probability. Cognitive Psychology, 4, 207–232.
Lahman, S. (2006). The baseball archive. Retrieved August 20, 2006, from http://www.baseball1.co.
MacDonald, D. N., & Reynolds, M. O. (1994). Are baseball players paid their marginal products? Managerial and Decision Economics, 15, 443–457.
Mullainathan, S. (2002). A memory-based model of bounded rationality. Quarterly Journal of Economics, 117, 735–774.
Quirk, J., & Fort, R. (1992). Pay dirt: The business of professional team sports. Princeton, NJ: Princeton University Press.
Retrosheet (2006). Transactions. Retrieved August 20, 2006, from http://www.retrosheet.or.
Scully, G. (1974). Pay and performance in major league baseball. American Economic Review, 64, 915–930.
Simon, H. A. (1957). A behavioral model of rational choice. In Models of man: Social and rational; mathematical essays on rational human behavior in a social setting. New York: Wiley.
Sommers, P., & Quinton, N. (1982). Pay and performance in major league baseball: The case of the first family of free agents. Journal of Human Resources, 17, 426–436.
Thompson, W.C., Reyes, R. M., & Bower, G. H. (1979). Delayed effects of availability on judgment. Unpublished manuscript, Stanford University.
Tversky, A., & Kahneman, D. (1974). Judgment under uncertainty: Heuristics and biases. Science, 185, 1124–1131.
THE NATIONAL HOCKEY LEAGUE AND SALARY ARBITRATION: TIME FOR A LINE CHANGE
Stephen M. Yoost
I. INTRODUCTION
… On February 16, 2005 the National Hockey League (NHL or League) became the first professional sports league in North America to ever cancel an entire season on account of a labor dispute.3 Three-hundred and one icy days of bitter conflict-the longest labor dispute in North American professional sports history-finally ended on July 13, 2005 with a new collective bargaining agreement (CBA) between NHL players and owners.4 Much of the excitement surrounding the end of the lockout focused on the League’s new rules of play, which the owners hope will promote scoring, speed, and excitement in the game.5 In an effort to put the 2004–05 lockout firmly in the League’s past, the NHL also unveiled a new logo.6
While an offense-friendly rulebook and a fresh look will help bring back some excitement to a League that has lost its luster, low-scoring games and a logo reminiscent of the 1970s did not cause the NHL’s labor lockout or its financial woes.7 Although the NHL has traditionally enjoyed its status as one of North America’s four major professional sports leagues,8 the NHL has recently been in serious danger of losing its prominence among sports fanatics throughout the United States and even in Canada.9 With player salaries soaring10 and big-time television contracts falling,* the NHL has turned off much of its fan base.12 The League’s operating costs have reached an all-time high,13 and fan interest has sunk to an unprecedented low.14 The business model of the NHL’s old collective bargaining agreement led to this financial disarray and the labor lockout of 2004–05.15 In an effort to ameliorate the League’s fiscal crisis and prevent another labor dispute, the League’s new CBA includes some necessary changes to its plan of business.16
Salary arbitration was a key element of the NHL’s old collective bargaining agreement with its players, and it remains the cornerstone of the League’s settlement of salary disputes under the new CBA.
….
II. THE FINANCIAL DECLINE OF THE NATIONAL HOCKEY LEAGUE
The NHL hopes the new CBA will stop the League’s serious financial decline that occurred over the life of the last collective bargaining agreement.30 Following the 2002–03 season, nineteen of the NHL’s thirty teams reported an operating loss.31 Those nineteen teams lost a combined $342.4 million in that one season alone.† Four teams lost over $30 million, only one team lost less than $5 million, and the remaining fourteen clubs lost between $5 million and $30 million.33 The average loss of these nineteen franchises was $18 million.34 In addition, four teams have gone bankrupt.35
The few profitable teams do not sufficiently counter the failing teams: of the eleven teams that reported a net profit for the 2002–03 season, only two clubs produced over $10 million.36 The average profit of these eleven clubs was a meager $6.4 million, and their combined profit was just under $70 million.37 As a result of these figures, the NHL as a whole lost around $273 million during the 2002–03 season.38 The NHL’s dire financial situation has prompted the League’s commissioner to admit that “we lose less money by not playing.”39
These figures beg the following question: why did the NHL lose so much money? Several factors, including an overall decreasing fan interest40 and rapid expansion to relatively uninterested markets, contributed to the problem.41 In the decisive Game Seven of the Stanley Cup Finals in June 2004,42 ABC registered a 5.4 viewer rating, which was 0.4 lower than the previous season’s Game Seven rating.43 Earlier games in the 2004 Stanley Cup finals attracted the lowest ratings in twenty years.44 The 2004 World Series of Poker attracted higher ratings on ESPN, a national cable network, than the first two games of the Stanley Cup Finals on ABC, a national network with a greater potential audience than ESPN.45 Reflecting the reality that hardly anybody watches the NHL on television anymore, NBC paid the NHL no money upfront in the League’s latest TV deal.46 The NHL hopes that the newly unveiled rules of play for the 2005–06 season will help spark fan interest and reverse these recent trends.47
Between 1991 and 2001, the NHL added nine new franchises.48 In addition, the League placed some of these teams in warm places where one would not expect to see ice hockey.49 At the same time, traditional hockey towns like Winnipeg and Quebec, Canada lost their teams to less-interested American markets.50 This expansion to weak markets, coupled with a decreasing fan base, helped to create the NHL’s financial difficulties.
While the NHL’s poor business decisions helped run the League into the ground, out-of-control player salaries have played the largest part in creating the NHL’s money problems.51 The NHL’s 2002–03 audit revealed that the League spent only thirty-nine percent, or roughly $775 million, of its total operating costs on expenses other than players’ salaries.52 The NHL spent about seventy-five percent, or roughly $1.5 billion, of its revenues on players’ salaries in that same season.53 By comparison, players’ costs accounted for only about fifty-seven percent of the NHL’s revenues in 1994.54
The NHL has spent, proportionally, much more on paying its players than the other three major professional leagues.55 To amplify this financial strain, the NHL is consistently fourth in total annual revenue as well, earning about $1.1 billion less than its next closest counterpart, the National Basketball Association (NBA).56 The NHL has the dubious distinction of being the only league to have any of its franchises file for bankruptcy.57
While the NHL’s popularity has been in steady decline, players’ salaries have increased at a staggering rate. In 1994, the average NHL salary was $560,000.58 In 2004, the average salary was about $1.8 million, well over three times the average salary just ten years before.59 The League’s highest-paid players, Peter Forsberg and Jaromir Jagr, earned $11 million in 2004.60 As recently as 1996, the NHL’s highest-paid player earned half that—$5.5 million.61 These statistics readily show that, over the life of the latest collective bargaining agreement, players’ salaries have exploded and destroyed the viability of the NHL.
III. PROFESSIONAL SPORTS AND SALARY ARBITRATION
A. The Business Model of the NHL and Arbitration in General62
Disputes over labor are common, and there is no indication that this prevalence will decrease.63 There will always be disagreements in labor regarding compensation, because management and labor of any given company will disagree over how to distribute that company’s profits.64 Professional hockey is no exception to this phenomenon,65 and indeed, as long as there is big money at stake and there are even larger egos involved, professional hockey’s salary disputes will represent some of the most heated disputes in the entire field of labor.66
The National Hockey League operates like a large company with local franchises.67 The NHL is essentially a large multinational company consisting of many subparts.68 Each of the thirty teams within the NHL operates as a franchise, which means that the overall system of labor is the same throughout the League, even though different entities own each team.69 The thirty team owners collectively act as the NHL,70 agreeing to all sorts of collective business decisions.71 As franchise owners, however, the owners make team decisions for their individual franchises like local franchise owners of McDonald’s restaurants do.72 Owners decide, within the general rules of the NHL, what players to sign, how much to pay them, who coaches and manages their teams, and other important business decisions.73 This is the ownership side of the NHL’s labor system.
The players’ side of the NHL is slightly less complicated. Players negotiate and sign contracts with the teams for whom they want to play.74 Collectively, however, the players of the NHL act as the National Hockey League Players’ Association (NHLPA).75 The NHLPA is the players’ union.76 As the NHLPA, the players negotiate with the League and agree upon77 a method to govern the general labor system of professional hockey. The result of these negotiations is the collective bargaining agreement (CBA), which covers details from player eligibility to baseline compensation to training camps to salary arbitration and free agency.78 As with agreements between large companies and their labor unions, the NHL CBA periodically runs out and must be renewed by both sides for the League to continue operating.79
In the NHL, players occasionally become free agents—that is, their contracts either expire or contain provisions allowing the players to renegotiate their contracts or to offer their talents to other teams.80 Additionally, the CBA provides for salary arbitration, which gives players who meet certain criteria the opportunity to settle salary disagreements with their teams by submitting their cases to third-party arbitrators.81
Arbitration is traditionally defined as “a method of dispute resolution involving one or more neutral third parties who are usually agreed to by the disputing parties and whose decision is binding.”82 The NHL has utilized its own version of arbitration, defining those procedures in Article 12 of the old CBA.83 One of the main differences between traditionally defined arbitration and the old CBA’s version is the unique and limited “walk-away” provision, wherein one party can refuse to bind itself to the arbitrator’s decision.84
B. The Emergence of Salary Arbitration in Professional Sports
….
Salary arbitration’s roots in professional sports traces back to 1970, when the NHL first used the process to settle compensation disputes between players and teams.91 Not long after, the MLB followed the NHL’s lead by including an arbitration procedure in its 1973 CBA.92 Both leagues continue to employ salary arbitration in their respective collective bargaining agreements93 and remain the only two (of the four major professional sports) leagues to use salary arbitration.94
C. Major League Baseball’s “Final-Offer” Salary Arbitration System
Major League Baseball’s salary arbitration system is known as “final-offer” arbitration.95 When an MLB arbitration case proceeds, the player and the team’s ownership each propose a salary figure.96 Within one day of the arbitration hearing, a panel of three baseball “arbitrators must select either the player’s demand or the club’s offer.97 There can be no compromise, no explanation, and no delay.”98 Furthermore, neither the players nor the team may appeal the arbitrators’ decisions, and players may not hold out for better deals.99 The final-offer system is simple enough: for example, if the ballplayer asks for $750,000 and the owner offers $500,000, the arbitrator must choose either $750,000 or $500,000, one or the other.
The final-offer feature is designed to stimulate negotiations and to discourage arbitration.100 The final-offer system “encourages each side to put forward more realistic figures.”101 The higher chance that the arbitrator will choose the opposing side’s offer leads to this anticipated effect. In other words, if the arbitrator must choose either the player’s high demand or the club’s low offer, the parties will compromise between the two extremes rather than risk having the arbitrator rule in favor of one or the other party.102 “If either side gets too far out of line, the other’s position will be adopted by the arbitrator.”103 The desire to win the arbitration equals an incentive to be as realistic as possible, and the less extreme demand or offer typically becomes the winning position.
1. The Advantages of MLB’s Final-Offer Arbitration
There are several advantages to the MLB’s final-offer system. The final-offer approach facilitates negotiation.104 While the main advantage of settling before going to final-offer arbitration is obtaining a more favorable outcome, there are other benefits to settling salary disputes rather than going to trial or arbitration. First, arbitration hearings, like court proceedings, are adversarial and can strain the relationship between players and management.105 Second, the parties must finance their arbitrations,106 including paying the panel of arbitrators and funding their side’s costs of discovery, which yields the evidence that they submit at the hearings.107 Some elements of discovery, especially depositions, can be incredibly expensive.108 Third, when parties settle, they can devise creative multi-year deals or compensation packages that involve bonuses or no-trade clauses,109 whereas baseball’s system allows arbitrators to award only single-year contracts for specified salaries.110 Finally, settlement creates an atmosphere of cooperation, rather than of contention.111 Settlement can “build the parties’ relationship rather than rupture it”112 by allowing the players and owners to reach a mutually acceptable common ground. On the other hand, the arbitrators’ decision in an MLB salary dispute is exactly what one of the parties wanted and exactly what the other party did not want. In other words, “there is always one winner and one loser.”113 Settlement, therefore, can be superior to arbitration in many ways.
If the purpose of baseball’s final-offer arbitration system is to encourage the clubs and players to resolve their disputes without resorting to arbitration, then the MLB’s salary arbitration system operates properly when parties settle. Evidence shows that in the area of public employment labor disputes, the final-offer element encourages negotiations and settlement.114 In the Major Leagues, however, players continually resort to salary arbitration rather than settle their disputes with management, leading to speculation regarding the cause of this phenomenon.115 Disputes end up in arbitration for any of the following reasons: (1) players have “distinctly mixed profiles,” (2) one party “fails to correctly gauge the market value of a player’s services,” (3) a club may not have “the financial resources to pay” what the player demands, (4) the club may want to avoid the spiraling effects that increased compensation has on other players’ salaries, and (5) the “personalities and egos of the participants” may preclude settlement.116
When baseball players have resorted to arbitration, the owners have been more successful, at least in the relative number of times that arbitrators have picked owners’ offers.117 … While owners have won most arbitrations, the players have benefited from the MLB’s arbitration system.
2. MLB’s Salary Arbitration System’s Effect on Players’ Salaries
The salary arbitration system has led to sky-rocketing salaries in Major League Baseball.121 Even when players lose their arbitrations, their salaries tend to rise nonetheless.122 Increasing salaries result from arbitration because a player always wins his arbitration hearing, even if the arbitrators pick the owner’s offer.123 There are three ways players win salary arbitrations. First, players win arbitration by filing for arbitration in the first place.124 Simply by filing for arbitration, players consistently double their salaries.125 “Even if they never have to go through an arbitration hearing, players receive higher salaries than they otherwise would have received if they were not eligible for arbitration.”126 The reasons for this phenomenon are elusive. At least in theory, the threat of going to arbitration “tends to move both parties to negotiate in good faith.”127 Since the final-offer system encourages players and owners to settle before arbitration, perhaps the system itself, without actually using arbitration, leads to increased salaries. Additionally, owners know that arbitrators will compare their players to high-priced talent from other teams, and rather than risk losing the arbitration, owners tend to settle for a premium.128 Whatever the case, simply filing for arbitration tends to handsomely increase players’ salaries.
Second, players win arbitration by going through arbitration and losing their case.129 Like those who file and then settle before arbitration, players who lose their cases still have the market potential that comes with being a player who is eligible for salary arbitration. A player wins by losing his arbitration case, because his club must offer a reasonable market value in arbitration, and this number is always higher than what the player had previously earned.130 If this were not the case, the player would not have filed for arbitration in the first place. For example, a player who earns $500,000 the previous season demands $1.5 million dollars for next season from his team. The club offers $1 million dollars instead. If the case proceeds to arbitration, the arbitrator will award the player either $1.5 or $1 million. Either way, the player will make at least twice as much as he did the previous year.131 Studies have shown that players who “lose” their arbitrations still make an average of 150 percent their previous season’s salary.132
Third and finally, players win arbitrations by getting arbitrators to decide in their favor.133 In the previous hypothetical, if the player wins his arbitration, he earns three times what he earned during the previous season. This is a likely phenomenon, because players’ salaries have increased at an alarming rate since the MLB started using salary arbitration.134
….
While salary arbitration pushes baseball players’ salaries up and up,140 MLB management has blamed two aspects of the arbitration system for this phenomenon. For one, because arbitrators compare the player in dispute with the performances and salaries of other players in the same relative position, salary arbitration “makes one team pay for another team’s extravagance.”141 Secondly, the system does not allow arbitrators to consider teams’ market sizes, so arbitrators award players of small market teams the same salaries as their large market counterparts.142
In reality, both of these complaints revolve around baseball’s existence in large and small markets alike. Those teams that have the capacity to pay their players “extravagantly” are the same teams that operate in a “big market.”143 In the 2004 baseball season, the teams with the three highest payrolls were the New York Yankees (with a record $180 million-plus payroll), the Boston Red Sox, and the Anaheim Angels.144 New York and Anaheim have the two largest potential markets in baseball, with the New York and Los Angeles metropolitan areas topping out as the only two markets with more than ten million people.145 Along with the Big Apple and Southern California, Boston ranks among the nine markets containing five million or more people.146
No doubt these teams can afford to pay such ridiculously high salaries because they benefit from lucrative media contracts.147 … The smaller markets simply cannot match the salaries that the bigger teams lay out.152
Baseball’s salary arbitration scheme fails to take this into account.153 Arbitration relies on the salaries and statistics of all players regardless of where they play.154 The big market/small market dynamic leads to increasing player salaries across the league, at least in part due to the MLB’s salary arbitration system.
3. MLB’s Final-Offer System: Does It Work?
The crucial question about final-offer arbitration is this: does it work? That is, does the final-offer system really encourage parties to settle and to avoid actual arbitration? … Between 1990 and 2004, players filed 1469 arbitration cases and only 182 went to arbitration.157 In other words, baseball players and owners settle about ninety percent of all arbitration cases. Additionally, not all arbitration-eligible players file for arbitration,158 suggesting that the mere possibility of going to arbitration leads clubs (and players, if in their interest) to settle.159 These statistics reflect that baseball’s final-offer system decreases the number of disputes resolved by arbitration.
While the final-offer system encourages players and owners to settle instead of arbitrate, the result—increased player salaries—is the same either way. In 1974, when the MLB first relied on arbitration to settle salary disputes, the average salary in baseball was $40,839.160 Today, the average MLB salary is well over $2 million.161 While the advent of free agency no doubt played a large role in this astronomical rise,162 free agency’s coexistence with arbitration pushes baseball’s salaries up even more.163 Unrestricted free agents can seek higher salaries from other teams, and restricted free agents who qualify for salary arbitration employ the arbitration system to obtain impressive pay raises.164 As a result, Major League Baseball’s use of salary arbitration has led to a profound increase in player salaries across the league. [See Table 9 for the history of the number of cases that have proceeded to a salary arbitration hearing.]
D. The National Hockey League’s Salary Arbitration System Under the Old CBA (1995–2004)
1. The Mechanics of the NHL’s Salary Arbitration System
The MLB and the NHL are the only two of the major four professional sports leagues to have salary arbitration.165 Due to baseball’s tremendous popularity advantage over hockey166 and the MLB’s unique “final-offer” system of arbitration,167 professional baseball’s handling of salary arbitration is the benchmark from which practitioners and fans judge the NHL’s version of arbitration.168
While baseball’s arbitration system typically receives more attention than its NHL counterpart,169 the NHL was the first professional sports league to use salary arbitration when the League and the players’ union included the process in its collective bargaining agreement for the 1970 season.170 NHL salary arbitration has been renewed with each new collective bargaining agreement, including the seventh and most recent CBA.171
Article 12 of the old NHL CBA governed hockey’s use of salary arbitration until the 2004–05 season.172 Only restricted free agents—i.e., players who still “belonged” to a particular team but who could not renegotiate their contracts with that team—qualified for salary arbitration.173 Although the arbitrators’ decisions were “final and binding on the parties,” owners retained limited “walk-away rights.”174 Since the hockey season typically begins mid-October of each year,175 all arbitration hearings occurred in the first two weeks of August and concluded before August 15.176
Under the last CBA, only the players were able to file for arbitration.177 The team ownership, on the other hand, decided “whether the arbitration award shall be for a one or two year contract.”178 The default term was one year if the club failed to delineate this detail.179 This provision favored the players because the ruling locked in the players for only one year rather than holding them to a two-year contract.180 After just one more year, the players could then renegotiate their contracts181 or enter into unrestricted free agency.182 On the other hand, a default term of two years favored club owners by limiting their players’ ability to match the yearly increase of salaries of other players from around the League.183
Table 9 Salary Arbitration Results and Data, MLB Arbitration (Year-by-Year)
| Year | Players | Owners |
2010 | 3 | 5 |
2009 | 2 | 1 |
2008 | 2 | 6 |
2007 | 3 | 4 |
2006 | 2 | 4 |
2005 | 1 | 2 |
2004 | 3 | 4 |
2003 | 2 | 5 |
2002 | 1 | 4 |
2001 | 6 | 8 |
2000 | 4 | 6 |
1999 | 2 | 9 |
1998 | 3 | 5 |
1997 | 1 | 4 |
1996 | 7 | 3 |
1995 | 2 | 6 |
1994 | 6 | 10 |
1993 | 6 | 12 |
1992 | 9 | 11 |
1991 | 6 | 11 |
1990 | 14 | 10 |
1989 | 7 | 5 |
1988 | 7 | 11 |
1987 | 10 | 16 |
1986 | 15 | 20 |
1985 | 6 | 7 |
1984 | 4 | 6 |
1983 | 13 | 7 |
1982 | 8 | 14 |
1981 | 11 | 10 |
1980 | 15 | 11 |
1979 | 8 | 5 |
1978 | 2 | 7 |
1977 | No arbitration | |
1976 | No arbitration | |
1975 | 6 | 10 |
1974 | 13 | 16 |
Total | 209 | 281 |
Source: The Associated Press; additional data on file from editors.
As with their baseball counterparts, NHL arbitrators were required to take into account various statistics and factors to guide them in making a final decision, including “the Compensation of any player(s) who is alleged to be comparable to the party Player.”184 The reliance on relative compensation created an undeniable upward spiral effect on players’ salaries throughout the NHL. Arbitrators had to have some figure regarding the market value of comparable players in order to determine the market value of the player who was party to the arbitration.185 Such a figure was necessary because NHL arbitrators were free to award any salary figure, unlike in Major League Baseball.186 Since NHL arbitrators had unlimited options, they relied more heavily on comparable players’ salaries to decide the arbitrations rather than on the players’ demands or the clubs’ offers.187
The result of this heavy reliance on comparable players’ salaries was an increase in salaries across the NHL. If one player had a successful year and he negotiated a new contract with a higher salary, comparable players demanded the same higher compensation. One player’s increased salary created a boon for comparable players.188 In NHL arbitration under the old CBA, the key for the player was to prove that he was comparable to another, more highly paid player.189 The pivotal role that comparable players’ salaries played in salary arbitration led to a relative increase in overall salaries.
NHL arbitrators had to decide their cases within forty-eight hours of the end of the arbitration hearings.190 Moreover, NHL arbitrations required only one arbitrator, while three person panels of arbitrators decide MLB hearings.191 In addition, NHL arbitrators’ decisions had to include both the “salary to be paid to the Player by the Club” and “a brief statement of the reasons for the decision, including identification of any comparable(s) relied on.”192 This differed from professional baseball’s arbitration rules, which do not provide for any explanation of the arbitrators’ decisions.193 In baseball, the final-offer element begs little need for such details since MLB arbitrators simply choose between two figures.
2. The Decisionmakers: How the NHL Chose Arbitrators Under the Old CBA
A potential distinction between the arbitration systems of hockey and baseball was the selection of arbitrators.194 Under the old NHL CBA, the League and the NHLPA jointly appointed eight arbitrators who were members of the National Academy of Arbitrators, and only one arbitrator decided each case.195 Likewise in the MLB, the owners and players’ association “annually select the arbitrators.”196 But MLB arbitrations are “assigned to three-arbitrator panels.”197
In a system of arbitration, a potential issue can be the procedure for selecting the arbitrators and the concern over the “repeat-player phenomenon.”198 For three reasons, the arbitrator-selection processes in both the MLB and the NHL (under the old CBA) avoided these potential problems. First, in both leagues, the opposing sides - the owners and the players - equally shared the ability to choose arbitrators.199 Second, the two sides in each league split the costs of the arbitrations, including paying the arbitrators.200 Finally, NHL and MLB arbitrations involved repeat-players on both sides of the hearing, so neither side had an advantage.201 Therefore, by the terms of their respective collective bargaining agreements, both the MLB and the NHL (under the old CBA) avoided potential problems in the selection of arbitrators.
3. The NHL’s Unique “Walk-Away” Provision
The last distinction of the NHL’s old salary arbitration system was that NHL arbitrations were not always final; the CBA provided owners limited “walk-away rights.”202 The walk-away right meant that arbitrations could have been appealed in certain circumstances,203 which differed from the absolute finality of the MLB’s salary arbitrations.204 The old CBA dealt with one and two-year arbitration decisions differently in regards to walk-away rights.205 If a team’s ownership chose to arbitrate a player’s salary on a one-year contract, the ownership had the option of walking away from the arbitration within seventy-two hours after the arbitrator announced his or her decision.206 Once the club did so, the player automatically became an unrestricted free agent, except in two circumstances.207 First, if the player accepted from another team an offer that was less than eighty percent of the award from the arbitration with the original club, the original club could elect to match the offer of the other team.208 Second, under certain circumstances and after the club had walked away from the arbitration, the player could have elected to accept the original club’s “qualifying offer” for one year and become a free agent at the end of that term.209
If a team’s ownership chose to arbitrate for a two-year contract, the ownership could again walk away from the arbitration decision within seventy-two hours of the announcement of the arbitration result.210 The difference, however, was the result of the team’s walking away. If a club walked away from a two-year arbitration decision, the player and the team had to enter into the one-year contract under the terms of the arbitration, and the player became an unrestricted free agent at the end of that one year.211
Thus, walking away from an arbitration decision on a two-year contract, as opposed to a one-year contract, created different results. Clubs could not fully walk away from arbitration on two-year contracts. They were stuck with the arbitration for a full year. This system yielded various incentives, including the incentive for a club unsure of losing the arbitration hearing to elect to arbitrate a one-year contract.212 In choosing to arbitrate a one-year deal, the club preserved full walk-away rights.
The final important aspect of the NHL’s walk-away right was the limit on the total number of times a club could exercise the right.213 Teams could walk away from arbitration decisions no more than three times in any two consecutive NHL years and no more than two times in a single arbitration season.214 The cap on walk-away rights encouraged teams to exercise the option sparingly. Since there was no limit to the number of restricted free agents on each team who could elect arbitration, the walk-away cap could have played a significant role in clubs’ arbitration strategy.215
4. The Latest Round of NHL Salary Arbitrations: Demonstrating How the Old CBA’s Arbitration System Malfunctioned
Although the 2004 NHL season did not commence as originally scheduled, off-season salary disputes during the summer of 2004 continued as usual.216 From August 1 to 15, 2004, arbitrators heard all of the League’s arbitration cases in Toronto.217 Arbitrators heard and decided nineteen disputes.218 Sixty-six players filed for arbitration, and the remaining forty-seven cases settled before going to arbitration.219
These numbers immediately reflect that, at least in theory, the NHL’s system operated as it should. The MLB’s “final-offer” system, by its very structure, encourages players and owners to settle before going to arbitration. Since the NHL did not use the final-offer system, players and owners should have resorted to arbitration more frequently than their baseball counterparts. Since 1990, 1469 baseball players have filed for arbitration, and only 182 went before arbitrators.220 Roughly ninety percent of the cases settled before arbitration.221 Of the 108 potential MLB arbitrations in 2004, only seven actually went to hearing.222 On the other hand, about twenty-eight percent of NHL cases typically end in arbitration.223
Baseball’s high settle rate was the subject of much interest on the part of the NHL owners during the 2004–05 lockout.224 Owners felt that players and agents held too much influence over the arbitration procedures of the old CBA225 and complained that the NHLPA won the majority of arbitration cases.226 As a result, NHL owners pushed for a final-offer system to replace the traditional arbitration procedures that the NHL used for decades.227 The results of the latest round of arbitrations undoubtedly encouraged owners to change the system. In 2004, the nineteen arbitrations yielded an average award of $3.12 million.228 Less than ten years ago the highest paid NHL player earned $5.5 million.229
While NHL owners at least recognized that there was something seriously wrong with the League’s salary arbitration system, baseball’s final-offer model would not slow the growth of the NHL players’ salaries. Although the NHL and MLB have used somewhat different arbitration systems over the years, the result has been the same in both leagues: skyrocketing salaries.230 The NHL need only look to the rising average and highest salaries in professional baseball to see that the MLB’s arbitration works no better than the NHL’s in keeping player salaries in check. Baseball players’ salaries have multiplied along with those in the NHL.231 The MLB system may encourage more settling and less arbitrating, but the product of the two leagues’ systems is the same. Moving to a final-offer system is a myopic suggestion that would fail to ameliorate the NHL’s systemic problem.
E. The National Hockey League’s Salary Arbitration System Under the New CBA (2005)232
1. The Mechanics of the NHL’s Salary Arbitration System Under the New CBA
Salary arbitration remains unchanged under the new CBA, except in two regards.233 First, players are eligible for salary arbitration after four years in the League instead of three.234 This provision favors the owners and signals their intent to decrease the prevalence of arbitration and its effects on players’ salaries.
The other change that the new CBA makes to arbitration relates to who can elect arbitration. For the first time in the history of NHL salary arbitration, teams also have the right to elect salary arbitration.235 For players who earn more than $1.5 million in their prior year, teams have the right to elect arbitration in lieu of making a “qualifying offer.”236 Teams also have the right to elect salary arbitration with respect to other certain restricted free agents who choose not to take the team to arbitration.237
The new CBA’s qualifying offer system should increase players’ salaries at a modest rate, while keeping players from resorting to arbitration. Players earning $660,000 or less are entitled to qualifying offers (“QOs”) at one-hundred and ten percent of their prior year’s salary.238 Players earning more than $660,000 and up to $1 million are entitled to QOs at 105 percent of their prior year’s salary.239 Finally, players earning more than $1 million are entitled to QOs at 100 percent of their prior year’s salary.240
These amendments to the old CBA’s salary arbitration system should help make the process more equal between owners and players. Since teams can elect arbitration in some circumstances, they will have the potential of lowering highly-paid players’ salaries when those players are not performing to their potential.241 Besides these minimal alterations, the new CBA leaves salary arbitration untouched.242 However, as the following analysis shows, other provisions of the new CBA render further changes to salary arbitration rules unnecessary.
2. Other Provisions of the New CBA and How They Relate to Salary Arbitration
As with the old CBA, the NHL’s new system of salary arbitration exists within the broader context of the entire collective bargaining agreement. The pertinent parts include: (1) players’ League revenue share, (2) team salary caps and floors, (3) maximum and minimum individual player salaries, (4) team revenue sharing, and (5) free agency.243
The first major step that the NHL took with the new CBA involves guaranteeing a player’s share of League revenues from each year.244 The player’s share will be fifty-four percent to the extent League revenues in any year are below $2.2 billion; fifty-five percent when League revenues are between $2.2 billion and $2.4 billion; fifty-six percent when League revenues are between $2.4 billion and $2.7 billion; and fifty-seven percent when League revenues in any year exceed $2.7 billion.245
These guarantees seem to favor the players at first glance. However, during the 2002–03 season, the NHL spent seventy-five percent of League revenues on players’ salaries.246 The NHL has not spent fifty-seven percent of its revenues on player costs since 1994.247 The players’ share appears to represent a significant step backwards. The NHL is attempting to use this provision to curb player costs that spiraled out of control during the life of the last CBA.
….
The CBA’s limitation of the players’ share of League revenues relates to salary arbitration because salary arbitration has played a pivotal role in pushing players’ salaries up.250 Arbitration under the old CBA inflated players’ salaries without a real limit.251 However, under the new CBA, the limitation on the players’ share of League revenues creates somewhat of a cap on the augmenting effect that arbitration can have on players’ salaries.252
This limitation on salary growth is displayed no more prominently than in the new CBA’s imposition of a team salary floor and cap.253 Under the new CBA, the payroll range for each franchise in season one (2005–06) is $21.5 million to $39 million.254 [Ed. Note: The payroll range in 2010–11 was $43.4 million to $59.4 million.] The salary range should help create more parity among the League’s teams, but more importantly, the hard salary cap will effectively restrain players’ salaries.255 The pitfall of the NHL’s salary arbitration scheme under the old CBA was that player-friendly arbitration artificially inflated salaries across the League without any real restraint.256 The new CBA’s hard salary cap will effectively eliminate this problem.
Similarly, the new CBA’s cap on individual player salaries will curtail the inflationary effects of salary arbitration.257 Under the old CBA, one aspect of salary arbitration that tended to increase players’ salaries League-wide was the relative nature of arbitrators’ decisions combined with the lack of a cap on individual salary awards.258 The new CBA ameliorates this problem by regulating the maximum amount that any one player may make on each team.259
….
Notes
….
3. Bob Foltman, Hockey May Rise from Grave, CHI. TRIB., Feb. 19, 2005, § 3, at 1.
4. Rev Up the Zamboni, TORONTO STAR, July 14, 2005, at A20. The end of the lockout was a long-time coming, as players and owners expressed their desire to simply get the game back on the ice. Id. “To be totally honest, I really don’t care what the deal is anymore,” Philadelphia Flyers player Jeremy Roenick said. “All I care about is getting the game back on the ice.” Id.
5. Helene Elliott, New Game for the NHL, L.A. TIMES, July 23, 2005, at D1. Some highlights of the new rules include: no more ties (shootouts will be played until there is a winner), a larger offensive zone (goals will be closer to the boards and the neutral zone will be reduced), a bigger shooting area in the goal (goaltenders’ pads, gloves, and other equipment will be reduced in size), and fewer slowdowns (officials will show “zero tolerance” to interference, hooking, and holding obstruction by defenders). Id. at D9.
6. Id. The new logo has the same shield used in the previous NHL logo, but it is now silver and white. Id.
7. It is difficult to distinguish between the League’s desire to update the game’s rules and its fervent pleading with fans to return. See Tim Tucker, Image, Scoring Require a Boost: The New NHL; League Outlines Plans to Increase Offense and Accessibility in Hopes of Coaxing Fans to Return after Costly, Unprecedented Lockout, ATLANTA J.-CONST., July 24, 2005, at 1E. Fans’ support of the NHL no doubt supplies cash to the League for it to operate and pay its players. However, disagreement over how the League divides that money between its owners and players caused the 2004–05 labor dispute.
8. Of all of the professional sports leagues in North America, the National Football League (NFL), the Major League Baseball (MLB), the National Basketball Association (NBA), and the NHL gross the highest revenue. See Ted Kulfan, Comparing the Leagues’ Financial Arrangements, DETROIT NEWS, Oct. 13, 2004, at 6G. The above list is in order of estimated annual revenue, with the NFL grossing the greatest amount and the NHL hanging on at the bottom of the list. Although the NBA and the NHL include “national” in their proper names, these two leagues have franchises in both the United States and Canada. NBA.com, Teams, http://www.nba.com (place cursor on the “Teams” hyperlink at the top of the page for a drop-down menu) (last visited Dec. 17, 2005); NHL.com, Teams, http://www.nhl.com/teams/index.html (last visited Dec. 17, 2005). Although presently both leagues consist of fewer Canadian Franchises than previously, the NBA still includes the Toronto Raptors, and the NHL has six Canadian teams. Migration of Franchises: Teams on the Move, SPORTS ILLUSTRATED, Dec. 27, 2004, at 110, 110-12. The NBA’s only other Canadian team, the Vancouver Grizzlies, moved to Memphis, Tennessee in 2001, after existing just six years in British Columbia. Id. at 112. The NHL started with two of its “original six” teams playing home games on Canadian ice (Montreal and Toronto). Id. There have been as many as eight Canadian hockey franchises in the NHL at one point, but as of 2005 there were only six (Montreal, Toronto, Ottawa, Edmonton, Calgary, and Vancouver). Id. The NFL has never had a Canadian franchise, due partly to the presence of the Canadian Football League. See generally The Official Site of the Canadian Football League, http://www.cfl.ca (last visited Dec. 17, 2005). Major League Baseball had two Canadian teams (Montreal and Toronto) from 1977 to 2004, but the Montreal Expos moved to America’s capital and became the Washington Nationals in 2005. Migration of Franchises: Teams on the Move, supra, at 111. Before relocating the Expos to Washington, D.C., the MLB considered several other more southerly locations, including Monterrey, Mexico. Ed Waldman, Also-ran Cities Set to Pinch Hit if D.C. Drops Out of Race, BALT. SUN, Dec. 16, 2004, at 5C. The four major leagues have never actually had a franchise in Mexico. Id. For a comprehensive look at the past and future of professional sports franchises in Canada see Heather Manweiller & Bryan Schwartz, Time Out: Canadian Professional Sports Team Franchise-Is the Game Really Over?, 1 ASPER REV. INT’L BUS. & TRADE L. 199, 199-210 (2001).
9. Americans follow other sports much more intensely than hockey, as shown by the revenue differences in the four largest leagues. Kulfan, supra note 8, at 6G. The NHL, for instance, generates gross revenues that are less than half of what the NFL makes. Id. According to a December 2004 Gallup poll, over three-fourths of the people surveyed did not consider themselves fans of hockey. Gallup Poll Social Series: Lifestyles (Dec. 5, 2004—Dec. 8, 2004), http://institution.gallup.com/documents/question.aspx?question=151494&Advanced=0&SearchConType=1&SearchTypeAll=hockey (last visited Dec. 17, 2005). Less than twenty percent of responders considered themselves fans of hockey. Id. Another Gallup poll found that only twenty-three percent of Americans described themselves as hockey fans. Go Figure, SPORTS ILLUSTRATED, Dec. 27, 2004, at 36. In that same poll, respondents ranked hockey tenth among the eleven sports listed in the survey, with hockey coming in behind figure skating. Id. These numbers demonstrate that a further decline in hockey’s popularity among Americans would be no shock; however, hockey is a part of the history and national pride of Canada. Soriano, Rangers Avoid Arbitration, ORLANDO SENTINEL (FLA.), Jan. 18, 2005, at C3. Historians believe that the first modern hockey league started in Kingston, Ontario in 1885. NHL.com Hockey History, http://nhl.com/hockeyu/history/evolution.html (last visited Dec. 17, 2005). The champion of professional hockey has won the Stanley Cup—one of the most recognizable trophies in the world—since 1893. NHL.com Stanley Cup History, http://nhl.com/hockeyu/history/cup/cup.html (last visited Dec. 17, 2005). Over a century ago, Lord Stanley, the late Earl of Preston and Governor General of Canada, purchased the first Cup for the “champion hockey team in the Dominion (of Canada).” Id. Canada continues to support a strong Olympic hockey program, with the Canadian team winning the 2002 Olympic Gold Medal. Stand on Guard for Thee: Canada Captures First Hockey Gold Medal in 50 Years, CNNSI.com, Feb. 24, 2002, http://sportsillustrated.cnn.com/olympics/2002/icehockey/news/2002/02/24/usacanadaap/ (calling hockey Canada’s “national sport”). The NHL is to Canada what the NFL is to the United States. Soriano, Rangers Avoid Arbitration, supra, at C3. During the cancelled season of 2004–05, a bored and disappointed NHL fan from Winnipeg, Manitoba wrote to the Kansas City Star: “Now we just sit around in our basements and drink antifreeze.” Id.
10. Pierre Lebrun, Blame it On ‘97–’98, EDMONTON SUN (ALTA., CAN.), Sept. 21, 2004, at SP2.
….
12. Michael Rosenberg, Bettman Created this Mess, THE RECORD (Bergen County, N.J.), Oct. 24, 2004, at S6. As with any spectator sport, the NHL’s fan base is integral to its success as a financially viable and socially important entity. NHL CBA, CBA FAQ: NHL Announces Cancellation of 2004–05 Season, http://www.nhl.com/nhlhq/cba/index.html (last visited Dec. 17, 2005). When NHL Commissioner Gary Bettman officially cancelled the 2004–05 season, he apologized to the fans, saying he “[was] truly sorry.” Id. “Every professional sports league owes its very existence to its fans,” he added. Id.
13. See Michael Steinberger, Cap Row May Stop the Puck Here, FIN. TIMES (LONDON), Sept. 14, 2004, at 18.
14. Kulfan, supra note 8, at 6G; Larry Brooks, Paying for Lockout Tix off Fans, N.Y. POST, Oct. 3, 2004, at 60; Doug Robinson, NHL’s on Strike and Nobody Even Noticed, DESERET MORNING NEWS (SALT LAKE CITY), Nov. 1, 2004.
15. Helene Elliott, The NHL Lockout: A “Bleak Day,” L.A. TIMES, Sept. 16, 2004, at D1.
16. Elliott, supra note 5, at D1. The new CBA imposes a salary cap and floor ($39 million and $21.5 million, respectively for the 2005–06 season) on each team. Id. Additionally, the new CBA guarantees players will receive between 54% and 57% of League revenues each year, depending on the level of League revenues for those years. Id. The new CBA also imposes restrictions on individual salaries. Id.
….
27. NHL.com, 2002–03 League-Wide URO Results, http://www.nhl.com/nhlhq/cba/archive/bythenumbers/uroresults.htm l (last visited Dec. 17, 2005) [hereinafter 2002-03 URO]. These numbers indicate that the NHL operated at a $273 million deficit for the 2002–03 season alone. Id.
….
30. See Tucker, supra note 7, at 1E. In 2004, the Former Chairman of the Securities and Exchange Commission (SEC), Arthur Levitt, called professional hockey a “dumb investment” after heading a year-long assessment of the NHL’s financial situation. Scott Van Voorhis, On Thin Ice: Report: Most NHL Teams Lose Millions, BOSTON HERALD, Feb. 13, 2004, at 39. Levitt’s study produced the Unified Report of Operations (URO), which revealed that the NHL lost about $300 million during the 2002–03 season. Id. The study, however, has been a source of continued controversy, as the NHLPA and the NHL quarrel over just how bad is the NHL financial situation. Id. (quoting the NHLPA referring to Levitt and his associates as a “team of hired gun accountants,” who the NHL paid “in the $500,000 range” to produce a “sobering” survey to convince the NHLPA and fans that drastic changes to the League’s salary system must follow). The Levitt Report revealed, not surprisingly, that the greatest source of income for the NHL is the money fans pay to see games. Id. Gate receipts totaled $997 million of the League’s combined $1.494 billion revenue in 2002–03. Id. Broadcasting-media brought in less than half of the total from gate receipts, or $449 million. Id. The NHLPA continued to challenge the accuracy of these numbers as the labor lockout of 2004–05 continued. Dave Hannigan, Ice Hockey: Impasse in Labour Dispute Means Big Freeze for Whole NHL Season: Greed Blamed for Shut-down, THE GUARDIAN (LONDON), Feb. 17, 2005, at 29 (noting that “[a]fter 38 meetings over two years, their [owners’ and players’] evaluations of the sport’s [NHL’s] financial condition still differed too greatly [to reach a labor agreement]”).
31. 2002–03 URO, supra note 27; see also http://www.nhl.com/nhlhq/cba/archive/bythenumbers/historicalresults.html (last visited Dec. 17, 2005).
….
33. Id.
34. Id.
35. Chris Snow, You Say Tomato, I say …; Here are the Key Issues the League and the National Hockey League Players’ Association Dispute, STAR TRIB. (MINNEAPOLIS), Sept. 15, 2004, at 3C. The Pittsburgh Penguins filed for bankruptcy in 1974 and 1998, while the Los Angeles Kings went bankrupt in 1995. Kevin Allen, Senators File for Bankruptcy, but Will Keep Skating, USA TODAY, Jan. 9, 2003, available at http://www.usatoday.com/sports/hockey/nhl/senators/2003-01-09-bankruptcyx.htm. The Ottawa Senators filed for bankruptcy in January 2003. Id. A week later, the Buffalo Sabres followed suit. Sports FYI: Solich Names Assistants, TULSA WORLD (OKLA.), Jan. 14, 2003, at B2. These are the only four existing major professional sports franchises to go bankrupt. Id.
36. 2002–03 URO, supra note 27.
37. Id.
38. Id.
39. Elliott, supra note 15, at D9; Commish Claims Locked-out Union in Denial, ESPN.com, Nov. 2, 2004, http://sports.espn.go.com/espn/print?id=1914328&type=story.
40. A January 2005 USA Today/Gallup Poll discovered that fifty percent of sports fans would “not be disappointed at all” if the NHL/NHLPA labor disputes cancelled the 2004–05 NHL season. Mike Brehm, Poll: No NHL Would be No Biggie for Sports Fans, USA TODAY, Jan. 11, 2005, at 3C. ESPN Analyst and Former NHL Goaltender Darren Pang believed that “even the casual sports fans last year, going into Game 7 of [the] Tampa Bay-Calgary (Stanley Cup Finals), were somewhat excited about our sport.” Id. However, fan interest has considerably declined, as another recent Gallup Poll conducted in December 2004 found that only 23 percent of Americans considered themselves hockey fans. Go Figure, supra note 9, at 36.
41. Rosenberg, supra note 12, at S6.
42. The Stanley Cup Finals are the championships of the NHL. See NHL.com, Stanley Cup, http://nhl.com/hockeyu/history/cup/index.html (last visited Dec. 17, 2005). The Stanley Cup finals are a best-of-seven format, which means that the first team to win four games wins the NHL championship. Id. The seventh game of the series, then, is the “decisive” game, since the winner of Game Seven also wins the championship. Therefore, given the relative importance and decisiveness of the final game in the series, Game Seven of the 2004 Stanley Cup Finals should have attracted a large audience.
43. Vlessing, supra note 11, at Up Front. A TV rating is “the estimate of the size of a television audience relative to the total universe, expressed as a percentage.” Top Ten Primetime Broadcast TV Programs for Week of 2/07/05–2/13/05, Nielsen Media, http://www.nielsenmedia.com/index.html (last visited Sept. 19, 2005). “As of September 20, 2004, there [were] an estimated 109.6 million television households in the U.S. A single national household ratings point represents 1%, or 1,096,000 households.” Id. Therefore, the 5.4 rating from the final game of the 2004 Stanley Cup Playoffs translated to about 5,918,400 viewers. Comparatively, on February 6, 2005, Super Bowl XXXIX—the NFL’s championship equivalent of Game Seven of the Stanley Cup Playoffs—attracted a 41.1 rating, or about 45,045,600 viewers. David Barron, Hamilton Eagerly Eyes His Milestone Season, HOUSTON CHRON., Feb. 11, 2005, Sports, at 2.
44. Vlessing, supra note 11, at Up Front.
45. Rick Reilly, TV Poker’s a Joker, SPORTS ILLUSTRATED, Oct. 25, 2004, at 156; see generally Larry Brooks, Eve of Destruction; Owners Are Out to Ruin NHL, N.Y. POST, Sept. 12, 2004, at 62. ABC is a basic channel that has a potential of reaching 109.6 million television households in the United States alone. Top Ten Primetime Broadcast TV Programs for Week of 2/21/05-2/27/05, Nielsen Media Research, available at http://www.nielsenmedia.com/index.html (last visited Sept. 20, 2005). Fewer television households subscribe to a cable service, so cable networks, like ESPN, have fewer potential viewers. Id.
46. Vlessing, supra note 11, at Up Front. Before 2005, the NHL had a five year, $600 million contract with ABC and ESPN. Joe LaPointe, ABC and ESPN Script Grabs More Eyeballs, N.Y. TIMES, June 6, 2003, at D5. The NHL has traditionally had smaller television contracts than the NBA, NFL, and MLB. Id. Other professional sports leagues consistently sign television contracts that dwarf the NHL’s largest TV deal ever: five-years, $600 million (from 1999–2004). Todd Jones, NHL Reached for the Sky, But It Really Needed Firm Foundation, COLUMBUS DISPATCH, Feb. 18, 2005, at B3. The 2005 network television deals of other pro sports leagues included $17.6 billion for the NFL, $4.7 billion for the NBA, and $3.35 billion for the MLB. Id. Even professional racecar driving demanded a larger TV deal than professional hockey, with NASCAR holding on to a $2.8 billion deal from network TV during 2005. Id.
47. Elliott, supra note 5, at D1. Speaking on the need for these rule changes, Commissioner Gary Bettman emphasized the need to “drop the puck on a fresh start for the NHL.” Id. The NHL unveiled its new rules in an effort to divorce fans’ feelings about “the long, dark days of the lockout” and cancelled season of 2004–05 with the NHL and professional hockey in general. Id.
48. Migration of Franchises, supra note 8, at 112. Those nine expansion teams and the years the NHL introduced them are: San Jose Sharks (1991), Ottawa Senators (1992), Tampa Bay Lightning (1992), Florida Panthers (1993), Anaheim Mighty Ducks (1993), Nashville Predators (1998), Atlanta Thrashers (1999), Columbus Blue Jackets (2000), and Minnesota Wild (2000). Id.
49. Elliott, supra note 15, at D1. Examples of recently created or relocated southerly NHL franchises include the Phoenix Coyotes (formerly the Winnipeg Jets until 1996), Nashville Predators (expansion team of 1998), and Carolina Hurricanes (formerly the Hartford Whalers until 1997, when they relocated to Raleigh, North Carolina). Migration of Franchises, supra note 8, at 112.
50. See Chris Snow, The Lost Season?: Lockout Begins Tonight; The Puck Stops Here; NHL, Players Remain Miles Apart as Lockout Appears Certain, STAR TRIB. (MINNEAPOLIS), Sept. 15, 2004, at 1C.
51. In 2004, players’ salaries ate up seventy-five percent of the NHL’s revenues. Dave Joseph, NHL Season Put on Ice: Life Goes On, SUN-SENTINEL (FT. LAUDERDALE, FLA.), Feb. 17, 2005, at 1A.
52. 2002–03 URO, supra note 27.
53. Id.
54. Mike Loftus, NHL Update; Little Movement in Negotiations; Owners, Players Still Heading Toward Lockout, THE PATRIOT LEDGER (QUINCY, MASS.), Sept. 4, 2004, at 47. The NHL’s losses continued to mount, as the 2004–05 non-season prevented even the possibility that the NHL could generate a profit. J.P. Giglio, RBC, Canes Made Provisions, THE NEWS & OBSERVER (RALEIGH, N.C.), Feb. 19, 2005, at C3. While the owners amassed a $300 million reserve fund to survive the cancelled season, the teams cannot produce revenues without conducting any games. Id.
55. Kulfan, supra note 8, at 6G. Major League Baseball (MLB) dedicates 63% of its revenue to players’ salaries, while the NBA and the NFL spend 58% and 64%, respectively, of their revenues on their players. Id.
56. Id. The MLB earns about $4.1 billion per year, while the most successful league, the NFL, grosses about $5 billion. Id.
57. The first franchise to file for bankruptcy was the Pittsburgh Penguins. Jenny Wiggins, US Sports Tackle TV Cash Issue: Credit Analysts are Watching for Moves off the Screen, FINANCIAL TIMES (LONDON), Nov. 14, 2003, at 45. Three other teams—Los Angeles, Ottawa, and Buffalo—have since done the same. See Allen, supra note 35; Sports FYI: Solich Names Assistants, supra note 35, at B2.
58. Loftus, supra note 54, at 47.
59. Id.
60. Kulfan, supra note 8, at 6G.
61. See Tim Sassone, Looks Like a Lockout as Deadline Looms: All Signs Pointing to Long Labor Dispute for NHL, CHI. DAILY HERALD, Sept. 14, 2004, at Sports 1.
62. This subsection gives the reader a basic understanding of the general business structure of the NHL and of the traditional procedural elements of arbitration as one of the basic forms of alternative dispute resolution. For a more detailed look at the franchise system of professional sports see Kenneth L. Shropshire, THE SPORTS FRANCHISE GAME (1995).
63. The American Arbitration Association (AAA), the largest alternative dispute resolution institution in the world, has handled over two million cases, with many in the field of labor. See American Arbitration Association Dispute Resolution Services Worldwide, Fast Facts, http://www.adr.org/FastFacts (last visited Dec. 17, 2005). In 2002 when commercial disputes declined, the AAA handled an increased number of labor cases. American Arbitration Association Dispute Resolution Services Worldwide, 2003 President’s Letter and Financial Statements 4, available at http://www.adr.org/si.asp?id=1543, at 4 (last visited Dec. 17, 2005).
64. See Michael Arace, NHL’s Lost Season: Nuclear Winter, COLUMBUS DISPATCH, Feb. 17, 2005, at E1. “The reason” for the 2004–05 NHL lockout and eventual season cancellation was that “the NHL and its players’ association couldn’t resolve how to split revenues from the $2.1 billion industry.” Id.
65. Thirty-four players resorted to salary arbitration in the 2003 off-season alone. SI.com, 2003 NHL Salary Arbitration List, http://sportsillustrated.cnn.com/hockey/news/2003/07/16/arbitrationlist/ (last visited Dec. 17, 2005).
66. During the labor lockout of 2004–05, the NHL and the NHLPA hurled insults at one another, while fans from across North America grew impatient with the lack of a hockey season. See Andrew Gross, The Puck Stops Here, J. NEWS (N.Y.), Feb. 17, 2005, at 1C. At the news conference during which Commissioner Bettman cancelled the 2004–05 season, Bettman jabbed at NHLPA Executive Director Bob Goodenow for not being an honest negotiating partner during the lockout. Id. Goodenow responded by placing the blame for the cancelled season on the shoulders of the owners. Id. This war of words continued throughout the entirety of the lockout. Tom Jones, Agreement, Optimism Far Away, ST. PETERSBURG TIMES (FLA.), Sept. 5, 2004, at 1C (noting that both the NHL and NHLPA appeared “more concerned with lobbing insults and questioning whether the other side is even interested in a settlement” than with coming to an agreement).
67. Compare NHL CBA Preamble, http://web.archive.org/web/20040428065307/http://www.nhlcbanews.com/cba/preamble.html (last visited Dec. 17, 2005), with McDonald’s Corporation, Franchising Home, http://www.mcdonalds.com/content/corp/franchise/franchisinghome.html (last visited Dec. 17, 2005) (noting that McDonald’s has “always been a franchising company”).
68. NHL Rulebook, http://nhl.com/rules/index.html (last visited Dec. 17, 2005).
69. Id.
70. NHL CBA Preamble, supra note 67.
71. See, e.g., NHL Collective Bargaining Agreement expired on September 15, 2004, http://www.nhl.com/nhlhq/cba/archive/cba/index.html (last visited Dec. 17, 2005). The CBA is the most visible example of any NHL/NHLPA agreement.
72. See McDonald’s Franchising, supra note 67.
73. National Hockey League, National Hockey League Players’ Association Collective Bargaining Agreement, (July 22, 2005), art. 5, http://web.archive.org/web/20041012101809/www.nhlcbanews.com/cba/index.html (last visited Dec. 17, 2005) [hereinafter NHL CBA] (noting that “[e]ach club … shall … have the right at any time and from time to time to determine when, where, how and under what circumstances it wishes to operate, suspend, discontinue, sell or move and to determine the manner and the rules by which its team shall play hockey”).
74. NHL CBA, supra note 73, at art. 6, § 2. Under the rules of the old CBA, players relied on the Union’s representation, or operated on their own. Id. “No Club shall enter into a Player Contract with any player and the NHL shall not register or approve any Player Contract unless such player: (i) was represented in the negotiations by a Certified Agent as designated by the NHLPA under Section 6.1; or (ii) if Player has no Certified Agent, acts on his own behalf in negotiating such Player Contract.” Id.
75. Id.
76. Id.
77. Ideally the players’ union and owners agree on a collective bargaining agreement. The events of 2004–05, however, demonstrated that such cooperation cannot be taken for granted. See Wes Goldstein, Players Lose It All After Union Chief Hedges Bet, CBS Sportsline. com, Feb. 16, 2005, http://www.sportsline.com/nhl/story/8201334.
78. NHL CBA, supra note 73, http://www.nhl.com/nhlhq/cba/index.html.
79. NHL CBA, supra note 73, at art. 3, § 1(a). The last CBA lasted from September 16, 1993 to September 15, 2004. Id. The new CBA is six years in duration (through the 2010–11 season) with the NHLPA having the option to re-open the agreement after the fourth year (the 2008–09 season). See also CBA FAQs, supra note 29. The NHLPA also has the option of extending the CBA for an additional year at the end of the 2010–11 season. Id.
80. Players exercise these options in an attempt to increase their salaries. NHL CBA, supra note 73, at art. 10.
81. NHL CBA, supra note 73, at art. 12.
82. BLACK’S LAW DICTIONARY 41 (2d pocket ed. 2001). Typically, an arbitrator’s decision is binding. Id.
83. NHL CBA, supra note 73, at art. 12. Article 12 of the old CBA did not have an explicit definition for “salary arbitration.” Id. Instead, the entire article defined how the NHL uses arbitration by outlining the specific guidelines for League’s use of the procedure. Id. Mediation, another form of alternative dispute resolution, is less formal than arbitration. BLACK’S LAW DICTIONARY 444 (2d pocket ed. 2001). In addition, parties typically resolve their own disputes in mediation, while arbitrators, as agreed-upon third parties, decide cases in arbitration. Id. Moreover, mediation may produce a settlement agreement, whereas a settlement agreement may avoid the need for arbitration. Id.
84. NHL CBA, supra note 73, at art. 12, § 6. Thus, with a walk-away right, the arbitrator’s decision may not have been binding after all. This limited right, which was retained by only the clubs and not the players, is explored in detail, infra Part III(D)(2).
….
91. Roger I. Abrams, THE MONEY PITCH: BASEBALL FREE AGENCY AND SALARY ARBITRATION 146 (2000). In 1969, a group called the Task Force on Sports in Canada produced a report that criticized the NHL’s owner-friendly labor structure. See Robert C. Berry et al., LABOR RELATIONS IN PROFESSIONAL SPORTS 209 (1986). Using this report as leverage, the NHLPA convinced the owners to consent to salary arbitration for the 1970 season. Id. At that time, however, the NHL still used the “reserve clause” in the standard player contract, meaning that free agency did not exist in professional hockey. Id. at 211. The owners agreed to salary arbitration while keeping the reserve system intact. Id. Much like the emergence of free agency in the MLB, the NHL did not allow free agency until 1972. Id.
92. Paul D. Staudohar, THE SPORTS INDUSTRY AND COLLECTIVE BARGAINING 41-42 (2d ed. 1989). Following the NHL’s lead, the MLB finally succumbed to a free agency system in December of 1975. Id. at 34.
93. Id. at 41, 150. The NHL’s new CBA also includes provisions for salary arbitration. CBA FAQs, supra note 29.
94. Kulfan, supra note 8, at 6G. The NHL and the MLB have salary arbitration, while the NFL and NBA do not. Id.
95. See Abrams, supra note 91, at 146-47. Berry et al., supra note 91, at 58.
96. See Andrew Zimbalist, BASEBALL AND BILLIONS: A PROBING LOOK INSIDE THE BIG BUSINESS OF OUR NATIONAL PASTIME 82 (1992).
97. Abrams, supra note 91, at 146-47.
98. Id.
99. Id. at 147.
100. See Staudohar, supra note 92, at 43.
101. Zimbalist, supra note 96, at 82.
102. See Staudohar, supra note 92, at 44.
103. Id.
104. Elissa M. Meth, Final Offer Arbitration: A Model for Dispute Resolution in Domestic and International Disputes, 10 AM. REV. INT’L ARB. 383, 384-85 (1999).
105. Abrams, supra note 91, at 149; NHL: Kiprusoff Arbitration Gets Nasty, EDMONTON SUN (ALTA. CAN.), Aug. 22, 2004, at SP14; Chris Snow, Wild Wraps Up Two More; Brunette, Mitchell Deals will Avoid Arbitration, STAR TRIB. (MINNEAPOLIS), Aug. 13, 2004, at 2C (noting that the salary arbitration process can be “degrading” and “potentially risky”).
106. Abrams, supra note 91, at 149.
107. 2003–2006 Basic Agreement between the MLB and MLBPA, art. VI(F)(11), http://us.i1.yimg.com/us.yimg.com/i/spo/mlbpa/mlbpacba.pdf (last visited Dec. 17, 2005). “The Player and Club shall divide equally the costs of the hearing, and each shall be responsible for his own expenses and those of his counsel or other representatives.” Id. at 17.
108. See Stephen C. Yeazell, CIVIL PROCEDURE 419 (6th ed. 2004). “In a full-blown deposition both sides have their lawyers there; if the witness is not one of the parties he or she may also be represented by a lawyer. In addition, the deposing party must arrange for some form of recording or transcription of the deposition…. [E]ach hour of deposition time may amount to thousands of dollars in legal fees and costs.” Id.
109. See Abrams, supra note 91, at 149. Settling allowed Johan Santana and the Minnesota Twins to sign a four-year, $40 million contract in 2005. Twins Agree to Four-Year, $40M Deal with Santana, CBS Sportsline.com, Feb. 14, 2005, http://www.sportsline.com/mlb/story/819457. If the two sides would have relied on arbitration, the arbitrator could have picked a one-year deal worth either $5 million (the club’s expected offer) or $6.8 million (Santana’s expected salary demand). Id.
110. See Abrams, supra note 91, at 149.
111. Id.
112. Id.
113. Id.
114. See Dale Yoder & Paul D. Staudohar, PERSONNEL MANAGEMENT AND INDUSTRIAL RELATIONS 488-89 (7th ed. 1982).
115. See Abrams, supra note 91, at 150-51.
116. Id.
….
121. Some followers of baseball refer to the time of the year for MLB arbitrations as baseball’s “get-rich season.” Who’s Hot, Who’s Not, SPORTS ILLUSTRATED, Feb. 21, 2005, at 31. The first MLB arbitration of 2005 yielded a classic example of the arbitration system’s effect on salaries. Kyle Lohse, a right-handed pitcher for the Minnesota Twins who went 9-13 and had a 5.34 ERA (earned run average) in 2004, won that arbitration hearing with a $2.4 million award. Id. In 2004, he grossed $395,000, but he will earn over six times that in 2005, thanks to this favorable arbitration. Id.
122. Zimbalist, supra note 96, at 83.
123. See James B. Dworkin, Final Offer Salary Arbitration (FOSA)—a.k.a Franchise Owners’ Self Annihilation, in STEE-RIKE FOUR!: WHAT’S WRONG WITH THE BUSINESS OF BASEBALL? 73, 79 (Daniel R. Marburger ed., 1997).
124. Id.
125. Id.
126. Id.
127. Id.
128. Id.
129. Id. Dworkin, supra note 123, at 79.
130. A few factors lead to this phenomenon. First, only players can file for arbitration. Id. As a result, owners cannot utilize arbitration on a player who had a bad season. Therefore, owners cannot reverse the upward trend of players’ salaries that the system tends to create. Players will not file for arbitration if they are coming off of bad seasons. Id. Arbitration, then, is a strategic means for players to jockey for more money after a good year. Second, the interlocking nature of free agency and arbitration, combined with arbitration’s reliance on comparative players’ statistics and salaries, causes an increase in players’ salaries each year across the board. The arbitrators rely on these figures when deciding between the players’ demands and the owners’ offers. Id. Finally, natural market forces, such as inflation, cause salaries to rise. The American inflation rate in 2004 was 3.3%, which represents $33,000 on a $1 million salary. Jonathan Riskind, Bush’s 2006 Budget Full of Cuts, COLUMBUS DISPATCH, Feb. 8, 2005, at A1. The first factor—the players’ strategic edge—likely explains the increasing arbitration figures the most.
131. To use a real-life example, Johan Santana of the Minnesota Twins earned $335,000 in 2003. Dennis Brackin, Signing of the Times, STAR TRIB. (MINNEAPOLIS), January 9, 2005, at 1C. He filed for arbitration and asked for $2.45 million, while the Twins offered $1.6 million. Id. Since the arbitrators found for the team, technically Santana lost his arbitration. Even so, in 2004 he still made over four times more than he did the previous season. KFFL.com, Free Agents 2004: 2004 MLB Arbitration Results, http://kffl.com/article.php/4234/227 (last visited Dec. 17, 2005). Santana was arbitration-eligible in 2005 as well, and the system, once again, helped to increase his salary handsomely. Twins Agree to Four-Year, $40M Deal with Santana, supra note 109. Santana and the Twins were scheduled for arbitration on February 15, but the two sides settled the day before. Id. Even though “[b]oth sides were more than happy to avoid arbitration,” the team will be paying Santana a vastly increased salary for the next four years. Id. Santana made $1.6 million in 2004, and his new salary—the product of arbitration—avoidance settlement—will average out to $10 million per year for the next four years. Id. Santana intended to ask for $6.8 million in arbitration, as opposed to the $5 million the Twins expected to offer him. Id. However, the Twins agreed to double their offer in exchange for a longer term commitment from the pitcher. Id. Since salary arbitration produces a one-year compromised deal, avoiding arbitration allowed the Twins to lock Santana in for four years. Id. Assuming no settlement, Santana would have made more than three times his previous year’s salary had the two sides proceeded to arbitration and had Santana “lost” that arbitration. He would have had a one-year, $5 million contract. Id. Instead, he will be making approximately $10 million in 2005. Id. His 2005 salary—$10 million—is thirty times his salary from 2003—$335,000. Compare Free Agents 2004: 2004 MLB Arbitration Results, supra, with Twins Agree to Four-Year, $40M Deal with Santana, supra note 109.
132. James B. Dworkin, Collective Bargaining in Baseball: Key Current-Issues, LABOR L.J. 480, 480-86 (1988).
133. Dworkin, supra note 123, at 80.
134. Rich Fletcher, Show Everybody the Money, PLAIN DEALER (CLEVE-LAND, OHIO), Nov. 14, 2004, at C15.
….
140. Zimbalist, supra note 96, at 83.
141. Id.
142. Id. at 83-84.
143. According to Nielsen Media Research, the top ten American television markets of 2004–05 were (from largest to smallest): (1) New York, (2) Los Angeles, (3) Chicago, (4) Philadelphia, (5) Boston, (6) San Francisco-Oakland-San Jose, (7) Dallas-Ft. Worth, (8) Washington, D.C., (9) Atlanta, and (10) Detroit. The 56 NSI Metered Markets (U.S.), Nielsen Media Research, http://www.nielsenmedia.com/ (last visited Oct. 11, 2005). In 2004, the ten highest team salaries in the Major Leagues were (from highest to lowest): (1) New York (Yankees), (2) Boston, (3) Anaheim, (4) New York (Mets), (5) Philadelphia, (6) Chicago (Cubs), (7) Los Angeles, (8) Atlanta, (9) San Francisco, and (10) St. Louis. ESPN.com, Cleveland Indians 2004 Salaries, http://sports.espn.go.com/mlb/teams/salaries?team=cle (last visited Dec. 17, 2005). Detroit was the only metropolitan area with a baseball team that was among the top ten largest television markets but not among the top ten highest teams’ salaries of 2004. Id. The Detroit Tigers team salary was twenty-first among the thirty MLB teams that year. Id.
144. John Donavan, The Year that Was: Yankees, Cardinals, Tantrums, Milestones Highlighted Regular Season, SI.com, Oct. 1, 2004, http://sportsillustrated.cnn.com/2004/writers/johndonovan/09/30/season.review/.
145. Al Streit, Baseball Markets, Baseball Almanac, http://www.baseball-almanac.com/articles/baseballmarkets.shtml (last visited Dec. 17, 2005).
146. Id.
147. Richard Sandomir, Steinbrenner Has Got It, and He Loves to Flaunt It, N.Y. TIMES, Feb. 17, 2004, at D1.
….
152. The disparity between baseball’s rich and poor teams is staggering. “The combined 2005 salaries of the five projected [New York] Yankee start[ing pitchers] will total $67 million, which is more than the 2004 payrolls of 18 of the other 29 teams.” Phil O’Neill, Payroll Budgets Spiraling Out of Control, SUNDAY TELEGRAM (WORCESTER, MASS.), Jan. 16, 2005, at D6. The payroll of the entire Cleveland Indians team was $34 million in 2004. Scott Priestle, Indians, Shapiro Agree on 2-Year Contract Extension, COLUMBUS DISPATCH, Dec. 23, 2004, at B5. In that same year, the New York Yankees doled out over $180 million, while the Boston Red Sox disbursed about $130 million in players’ salaries. Id. Cleveland’s paltry $34 million was the MLB’s fourth-lowest team payroll. Id.; see also Jones, supra note 66, at 1C (pointing out the “haves and have nots” of the MLB, where “only a handful of teams reasonably expect to vie for a title each season”).
153. A potential counterargument is that arbitrators should not take the size of the team’s market into account, because the value of the player in question is a matter of how the entire MLB values him, not just that particular team. In other words, it would be unfair for an arbitrator to “undervalue” a player from the Cleveland Indians, when the New York Yankees, with higher revenues and spending power than the Indians, would pay that player a higher salary. But the problem with that argument is that it fails to take into account the effect such a system has on the entire MLB. It would be absurd to require a law firm in Cleveland to pay its attorneys the same salary a law firm in New York City pays its similarly situated attorneys, yet both firms are part of the national legal community. In the attorney market, a lawyer from Cleveland could leave his or her job and take a new, higher paying position in New York, and the result would have very little effect on the salaries of lawyers across America. The same does not happen in Major League Baseball. The player who leaves the Indians for a higher salary with the Yankees creates a new baseline to which arbitrators look as a factor in deciding what a player with similar talents should be paid.
154. Parties in baseball arbitrations offer salary numbers for comparable players, regardless of those players’ current teams. 2003–2006 Basic Agreement between the MLB and MLBPA, supra note 107, at art. VI(F)(12)(a). The MLB CBA requires arbitrators to use “comparative baseball salaries” from across the League as a part of the criteria for deciding arbitrations. Id. See also Mike Klis, Twins Lose Koskie to Jays: Third Baseman Gets $17 Million, DENVER POST, Dec. 13, 2004, at 9C. In the 2004 off-season, the Minnesota Twins, who are notorious for being a small market team, lost several members of their starting line-up to teams in larger markets. Id.
155. Dennis Brackin, Twins, Santana are Far Apart; Lefthander is Asking for $6.8 million, STAR TRIB. (MINNEAPOLIS), Jan. 19, 2005, at 4C. By comparison, sixty-five players filed for arbitration in 2004. Gagne, Halladay Among 65 Players to File for Arbitration, The Sports Network, Jan. 15, 2004, http://www.sportsnetwork.com/default.asp?c=sportsnetwork&page-lb/news/aan3004555.htm.
156. Brackin, supra note 155, at 4C.
157. Carrie Muskat, Free Agency Facts, MLB.com, Nov. 2, 2004, http://mlb.mlb.com/NASApp/mlb/mlb/news/mlbnews.jsp?ymd=20041102&contentid=908940&vkey=newsmlb&fext=.jsp.
158. Following the 2004 baseball season, many arbitration-eligible players opted not to file for arbitration. Thirty-nine arbitration-eligible players inked new contracts without actually going to arbitration. Brackin, supra note 155, at 4C; see also Gordon Edes, Varitek Gives a Signal: He Passes on Sox’ Arbitration Offer, BOSTON GLOBE, Dec. 20, 2004, at E2 (noting that two of the arbitration-eligible players from Boston declined arbitration and signed with other teams). Other arbitration-eligible players reached agreements with their teams before filing for arbitration. Juan C. Rodriguez, Beckett Avoids Arbitration; Pitcher Signs; Marlins Talk to Delgado’s Agent, SUN-SENTINEL (FT. LAUDERDALE, FLA.), Jan. 19, 2005, at 9C (noting that Josh Beckett re-signed with the Marlins before going to arbitration).
159. One factor that could induce settlement is the cost of arbitrations. The cost of MLB arbitrations is typically greater than NHL arbitrations, because professional baseball requires three arbitrators per hearing, while the NHL has used a single-arbitrator system. The AAA supplies arbitrators for most MLB salary arbitrations. American Arbitration Association, Sports Arbitration including Olympic Athlete Disputes, http://www.adr.org/sp.asp?id=22022 (last visited Dec. 17, 2005). “Arbitration costs through the AAA can be astronomical.” Robert J. Miletsky, How to Make Sure Your Arbitration Clauses Do Exactly What You Want Them to Do, CONTRACTOR’S BUS. MGMT. REP., February 2005, at 10. Usually, each side pays for their own portion of the arbitration costs. Under the most recent NHL CBA, participants in salary arbitrations are responsible for their “own expense of participation in the arbitration.” NHL CBA, supra note 73, at art. 12, § 5(n) (noting that “[t]he cost of the arbitration proceedings, including the Arbitrator’s fees and expenses, shall be shared equally among the parties”). Since baseball’s final-offer system creates results that are much more predictable than hockey’s version, these known procedural costs of arbitration make actually proceeding to arbitration that much more illogical. For example, if a player demands a $1 million salary and his club offers $500,000, baseball arbitrators will rule for either one or the other salary figure. With the known economic costs of arbitration (i.e., paying for the arbitrators, discovery, and travel costs to and from the arbitration), both parties’ incentives favor settlement. On the other hand, in an NHL arbitration without the final-offer system, the outcome of arbitration is much less predictable, so the parties may be more willing to invest greater amounts of money in obtaining a potentially favorable arbitration result. In addition, the cost of NHL arbitrations, which utilize only one arbitrator, should be lower than the expense of MLB arbitrations, which require a three-arbitrator panel. However, NHL arbitrations require full opinions and justifiable awards, so arbitrators who handle NHL cases typically demand higher remuneration per arbitration. Symposium, Sports Law and Alternative Dispute Resolution, 3 CARDOZO J. CONFLICT RESOL. 1 (2001), http://www.cardozojcr.com/vol3no1/symposia.html (relating that hockey arbitrations result in higher pay for the arbitrator/symposium participant than do baseball arbitrations). Another reason for settling before going to arbitration is a “desire to avoid a public exchange of numbers.” Brackin, supra note 155, at 4C. Up to a certain deadline, the two sides can negotiate in private. Id. Once that deadline passes, the offers of the clubs and the demands of the players become public. Id. As with any negotiation with potentially high media and public interest, privacy can play a large role in these pre-arbitration negotiations. Id.
160. Lindsay, supra note 137, at SPORTS.
161. Tom Verducci et al., The 20 Great Tipping Points; Many of the Most Important Events in Sports over the Past 50 Years Happened Far from any Field or Arena. Let the Countdown begin …, SPORTS ILLUSTRATED, Sept. 27, 2004, at 114, 119.
162. Id. Sports Illustrated ranked the birth of free agency in professional sports as one of the most important events in all of sports from 1954 to 2004. Id. The history of free agency in baseball traces its roots back to Curt Flood, a baseball player who made $90,000 in 1970 for playing for the St. Louis Cardinals. Id. In 1970, baseball’s reserve clause tied players to teams, and players had no power to choose for whom they played or how much money they made. Id. The Cardinals attempted to trade Flood to Philadelphia, and Flood challenged the trade and the reserve clause on anti-trust grounds. Id. The case went all the way to the Supreme Court, which ruled against Flood and preserved the reserve clause’s exemption from anti-trust laws. Flood v. Kuhn, 407 U.S. 258 (1972). A few years later, in 1975, free agency was born through the Messersmith-McNally Arbitration. Nick Acocella, Flood of Free Agency, ESPN Classic, http://espn.go.com/classic/biography/s/FloodCurt.html (last visited Dec. 17, 2005). Dave McNally, a four-time twenty-game-winning pitcher from the Baltimore Orioles, earned $100,000 in 1974 before being traded to the Montreal Expos. Abu Abraham, Deaths of Note, CHARLESTON DAILY MAIL (W. VA.), Dec. 3, 2002, at P3C. The Expos offered him $125,000 in 1975, but McNally thought he was worth more. Id. He refused to sign with the Expos and instead filed a grievance with Andy Messersmith of the L.A. Dodgers and the Major League Baseball Players Association. Id. The arbitrator in the grievance, Peter Seitz, ruled in favor of the players, thereby killing the reserve clause and ushering in the era of free agency on December 23, 1975. Id. In 1998, Congress passed the “Curt Flood Act,” which partly removed baseball’s exemption from federal antitrust law. See J. Philip Calabrese, Recent Legislation: Antitrust and Baseball, 36 HARV. J. ON LEGIS. 531, 540 (1999). Unrestricted free agency began in the NHL in 1994. Damien Cox, Top 5 Things NHL, Union Should Say (But Won’t), TORONTO STAR, Sept. 25, 2004, at E2. The NFL instituted free agency for the first time in 1993. Cornerbacks Pick Off Biggest Pay Increases of Any Position, BUFFALO NEWS, Feb. 15, 2004, at C8.
163. Free agency has given players the power to bargain for higher salaries by removing the reserve clause’s barrier to the free market. Jones, supra note 66, at 1C (noting that unrestricted free agency constitutes “a free-market system … where owners could outbid one another for players,” causing salaries to go “through the roof”). But see Dave Sheinin, This Winter, Free Agents See Less Green, WASH. POST, Jan. 31, 2004, at D1 (claiming that “the size and length of player contracts have fallen for a second straight offseason”). Due to an apparent decrease in free agency market power, the MLBPA began investigating the owners’ “negotiating practices” to see whether they are illegally conspiring to “keep salaries low.” Id. In the 1980s, MLB owners were actually found guilty of such conspiracy and ordered to pay a $280 million penalty. Id. When free agency started in the NFL in 1993, 132 unrestricted free agents signed fresh contracts worth an average of $1.227 million, which represented a 231% increase from the year before. Kimberly Jones & Steve Politi, Cap I$ King: Patriots, Eagles Master NFL Salary System, NEWHOUSE NEWS SERVICE (WASH. D.C.), Jan. 31, 2005, at SPORTS, available at LEXIS News Library, NHSNWS File. In that one season, the average NFL salary rose $104,000 to $600,000. Id. “The highest [team] payroll in 1992 was $31 million. Two years later, that was the minimum payroll.” Id.
164. In 2005, Adam Dunn of the Cincinnati Reds received the MLB’s highest pay raise from arbitration, as he netted a 934% increase to $4.6 million from $445,000. Sports Shorts—Red Sox to Issue 500 Series Rings, THE PROVIDENCE J. (R.I.), Feb. 20, 2005, at C12. The eighty-nine baseball players who went to arbitration in 2005 averaged a pay increase of 123% from those hearings. Id.
165. Kulfan, supra note 8, at 6G. On the other hand, the NBA and the NFL both have salary caps. Id. As of 2005, the NBA had a “soft cap,” which meant that the cap is calculated “as a percentage of league income,” and there are “various free-agent exemptions.” Id. In 2003–04, the NBA cap figured out to $43.9 million, but the exemptions made the average expenditure $59 million. Id. This means that each NBA team could not spend more than $43.9 million on players’ salaries in 2003–04, but the “softness” of the cap caused the average team to spend $59 million on salaries that year. Id. In 2004, the NFL had a hard cap set at 64.8% of “defined gross league revenues.” Id. In that year, the maximum each team could spend on salaries was $80.6 million. Id. That year, the NFL also had a salary floor, which was $67.3 million. Id.
166. Both total yearly attendance and total annual revenues of the MLB and NHL reveal the disparity between the popularity of the two leagues. The MLB attracted a record-high 73,022,969 fans to see games in 2004. Collene Kane, The Spector of Steroids, CINCINNATI ENQUIRER, Jan. 16, 2005, at 14B. The NHL’s total attendance for 2004 was about 20 million. Kevin Paul DuPont, This Union Could Use a Few More ‘Yes’ Men, BOSTON GLOBE, Feb. 20, 2005, at C11 (quoting interviews with NHL Commissioner Gary Bettman in which he “referred to the total attendance [of the 2004 NHL season]” as being “some 20 million”). Although there are 162 baseball games in a regular season compared to hockey’s eighty-two, the total attendance for the two leagues is not even close. Compare MLB Team-by-Team Schedule 2005, http://mlb.mlb.com/NASApp/mlb/mlb/schedule/teambyteam.jsp (last visited Dec. 17, 2005) (showing that each team plays 162 games during baseball’s regular season), with NHL.com, Teams, http://nhl.com/lineups/team/index.html (last visited Dec. 17, 2005) (including team schedules with eighty-two regular season matches). Baseball was also the most popular spectator sport among North Americans in 2004, with over 120 million observers attending MLB, minor league, and college baseball games. Paul Grimaldi, Still Hot, PROVIDENCE JOURNAL (R.I.), Jan. 1, 2005, at B1. Just under 60 million people attended NHL, minor league, and college hockey games in that same year. Id.
168. As such, the rest of this Note will build on the discussion of the MLB’s final-offer system and focus almost exclusively on the NHL.
169. Even among NHL players and owners, their focus typically has been on baseball’s style of arbitration. Larry Brooks, Union, NHL Set to Talk, N.Y. POST, Dec. 9, 2004, at 104. In the final stages of negotiations between the players’ union and the owners before the cancellation of the 2004–05 season, the NHLPA offered to change the NHL’s arbitration system to mirror the “final offer (either/or) system” of the MLB. Id.
170. Abrams, supra note 91, at 146.
171. Adrian Dater, Changes Needed to Save NHL, DENVER POST, Feb. 15, 2005, at D1 (highlighting the history of the NHL and its labor system); CBA FAQs, supra note 29.
172. NHL CBA, supra note 73, at art. 12.
173. Id. at art. 12, § 1(c).
174. Id. at art. 12, §§ 2(b), 6. After the arbitration concluded and the parties knew the arbitration award, the club could, according to the strict guidelines of CBA Article 12.6, refuse to accept the arbitration and allow the player to approach other teams as a free agent. Id.
175. See NHL Schedules, http://nhl.com/onthefly/schedules/index.html (last visited Dec. 17, 2005) (listing NHL games for the 2005–06 season from October to June).
176. NHL CBA, supra note 73, at art. 12, § 3.
177. Id. at art. 12 § 1(a) (stating that only “a player is eligible to elect salary arbitration”). This has been a major point of contention between the owners and the union. Alan Hahn, NHL Lockout; Last Minute to Play …; Today is Likely Final Shot for League, Union to Save NHL Season, NEWSDAY (N.Y.), Feb. 13, 2005, at B13. In its final CBA offer to the NHLPA before canceling the 2004-05 season, the NHL proposed a “two-way [arbitration] system in which a restricted free agent can file for arbitration or a team can take a restricted free agent to arbitration.” Id.
178. Id. at art. 12, § 5(b).
179. Id.
180. Id.
181. Id.
182. Id.
183. NHL CBA, supra note 73, at art. 12, § 5(b).
184. Id. at art. 12, § 5(f), These pieces of evidence also include the following: (1) “the overall performance … of the Player in the previous season or seasons,” (2) “the number of games played by the Player” and “his injuries or illnesses during the preceding seasons,” (3) “the length of service of the Player in the League and/or with the Club,” (4) “the overall contribution of the Player to the competitive success or failure of his Club,” (5) “any special qualities of leadership or public appeal,” (6) “the overall performance in the previous season or seasons of any player(s) who is alleged to be comparable to the party Player,” and (7) “the Compensation of any player(s) who is alleged to be comparable to the party Player.” Id.
185. Id.
186. Abrams, supra note 91, at 146. Theoretically, NHL arbitrators were bound to the final-offer system of the MLB, the market value of comparable players could play a less important role. In reality, MLB and NHL players are motivated to initiate arbitration based on the performances and salaries of comparable players. Both MLB and NHL arbitrators rely heavily on data regarding comparable players. See NHL CBA, supra note 73, at art. 12,§ 5(m)(2)(e) (detailing that the arbitrator’s decision must include “identification of any comparable(s) relied on”); see also 2003–2006 Basic Agreement between the MLB and MLBPA, supra note 107 (holding that “the criteria [for deciding an arbitration] will be … comparative baseball salaries”).
187. In an MLB arbitration, the decision of the arbitrator is relatively easy. The arbitrator picks one or the other number, and has no obligation to explain his or her decision. Under the old NHL CBA, the arbitrator was not bound by the either/or element of the MLB’s final-offer system, so he or she could have settled on any salary figure. NHL CBA, supra note 73, at art. 12, § 5(m). That the arbitrator had to explain his or her decision in a formal opinion was the limiting factor. Id. at art. 12, § 5(m)(ii)(e).
188. NHL analyst and retired coach Pierre McGuire described arbitration’s affect on players’ salaries in the following way: “[e]verything just became a big apples to apples thing—and I don’t blame the players at all for doing it—they went to their GMs [general managers] and said, ‘Hey, that guy got so and so; I’m as good as he is, I want that.’” Dater, supra note 171, at D1. McGuire added: “A lot of owners said to themselves, ‘Hey, I’ve got seats to fill and games to win, I have to give him the money.’ It all just became a self-fulfilling prophecy that wouldn’t stop.” Id. Once a player receives a higher salary, all comparable players then demand to be paid the same as him, and salaries across the League increase accordingly. Id. Then, one of those players has an outstanding year and demands a pay increase. Id. That player receives his raise, and the cycle starts all over again, continuously ratcheting up the League’s salaries. Id.
189. Comparable players’ salaries make up just one of many pieces of evidence submitted in an NHL arbitration under the old CBA. NHL CBA, supra note 73, at art. 12, § 5(f)(ii) (addressing admissible evidence). However, all of these pieces of evidence are meaningless without a reference point, and comparable players’ statistics, including salaries, provided that reference point. For example, arbitrators had to have some vantage point to assess the value of “the overall performance” of a player. Id. Without comparable players’ salaries and performances, NHL arbitrators would have had no framework with which to craft their decisions.
190. Id. at art. 12, § 5(m).
191. Compare id. at art. 12, § 5, (referring to “the Arbitrator” and “the decision of the Arbitrator”), with 2003–2006 Basic Agreement between the MLB and MLBPA, supra note 107, at art. 6(F)(7) (providing that “[a]ll cases shall be assigned to three-arbitrator panels”).
192. NHL CBA, supra note 73, at art. 12, § 5(m)(i). While those comparables may come from players in smaller markets, the overwhelming incentive of the players was to present evidence of a large market player who made more money than, but who performed roughly on par with, the player whose salary was in dispute. NHL arbitrators did not pick what the evidence at the hearing would be; rather, the parties presented all of the evidence upon which the arbitrators had to rely to make their decisions. Id. § 5. This was another reason for the often large disparity between the clubs’ offers and the players’ demands.
193. Abrams, supra note 91, at 146-47.
194. Michael H. LeRoy & Peter Feuille, Judicial Enforcement of Predispute Arbitration Agreements: Back to the Future, 18 OHIO ST. J. ON DISP. RESOL. 249, 265 (2003) (noting that “the method of an arbitrator’s appointment caused courts to vacate awards” and that “[e]ven if such selection did not bias the arbitrator, courts viewed it as an inherent conflict of interest”).
195. NHL CBA, supra note 73, at art. 12, § 2(e)(ix).
196. 2003–2006 Basic Agreement between the MLB and MLBPA, supra note 107, at art. VI(F)(7). “In the event they are unable to agree by January 1 in any year, they jointly shall request that the American Arbitration Association furnish them lists of prominent, professional arbitrators.” Id. Once the parties had that list, they alternated in “striking names” from the list until a mutually agreeable group remained. Id.
197. Id.
198. Sarah Rudolph Cole, A Funny Thing Happened on the Way to the (Alternative) Forum: Reexamining Alexander v. Gardner-Denver in the Wake of Gilmer v. Interstate/Johnson Lane Corp., 1997 BYU L. REV. 591, 619-24 (1997) (relating repeat-players’ advantages in negotiating contracts); Mark Galanter, Why the “Haves” Come out Ahead: Speculations on the Limits of Legal Change, 9 LAW & SOC’Y REV. 95, 110-12 (1974). See generally Lisa B. Bingham, On Repeat Players, Adhesion Contracts, and the Use of Statistics on Judicial Review of Employment Arbitration Awards, 29 MCGEORGE L. REV. 223, 258-59 (1998). The concern is, if one party always picks the arbitrator(s), the arbitrator(s) will tend to favor that party. Additionally, a repeat-player has an institutional knowledge advantage over the arbitration neophyte.
199. NHL CBA, supra note 73, at art. 12, § 2(e)(ix); 2003–2006 Basic Agreement between the MLB and MLBPA, supra note 107, at art. VI(F)(7).
200. NHL CBA, supra note 73, at art. 12, § 5(n). “The cost of the arbitration proceedings, including the Arbitrator’s fees and expenses, shall be shared equally among the parties.” Id.; 2003–2006 Basic Agreement between the MLB and MLBPA, supra note 107, at art. VI(F)(11). “The Player and Club shall divide equally the costs of the hearing.” Id.
201. In a repeat-player problem, the advantage/bias arises when one party is constant (i.e., the “repeat-player”) and the other party arbitrates once or only a few times. Although the teams are individual parties to arbitrations in both the MLB and the NHL (under the old CBA), they are “repeat-players” who deal with arbitrations on a yearly basis. The players also file for arbitration as individuals, but they receive representation from the players’ union, which is also a “repeat-player.” NHL CBA, supra note 73, at art. 12, § 5(d) (stipulating that a “[p] layer shall be represented at the hearing by the NHLPA”); 2003–2006 Basic Agreement between the MLB and MLBPA, supra note 107, at art. VI(F)(3).
202. NHL CBA, supra note 73, at art. 12, § 6.
203. NHL arbitrations are binding unless the team walks away. Id.
204. See Dworkin, supra note 123, at 78.
205. NHL CBA, supra note 73, at art. 12, § 6.
206. Id. at art. 12, § 6(a).
207. Id.
208. Id. at art. 12, § 6(c)(i).
209. Id. at art. 12, § 6(c)(ii).
210. Id. at art. 12, § 6(b).
211. Id.
212. By choosing to arbitrate for a one-year contract, the franchise could still walk away from the arbitrator’s decision, if the club so chose. Id.
213. NHL CBA, supra note 73, at art. 12,§ 6(d).
214. Id.
215. In 2004, the Buffalo Sabres had the most players file for arbitration, eight. TSN.ca, 2004 Arbitration Cases, http://www.tsn.ca/nhl/feature.asp?fid=7545 (last visited Dec. 17, 2005). The cases of only two of those players, Martin Biron and Daniel Briere, ended in actual arbitration. Id. The six others settled before their hearings. Id. Given the low cap on a team’s ability to walk away from the arbitrators’ decisions, a team with eight potential arbitrations must exercise the walk-away right with the other arbitrations in mind.
216. Id.
217. Id.
218. Id.
219. Id.
220. Muskat, supra note 157.
221. See id.
222. MLB.com, 2004 Salary Arbitration Figures, http://mlb.mlb.com/NASApp/mlb/mlb/news/mlbnews.jsp?ymd=20040120&contentid=629358&vkey=newsmlbnd&fext=.jsp (last visited Dec. 17, 2005).
223. 2004 Arbitration Cases, supra note 215…
224. Brooks, supra note 169, at 104 (noting that the NHL owners tried to alter the CBA to implement a MLB-like final-offer system in the NHL).
225. CBC Sports, Arbitration, http://www.cbc.ca/sports/indepth/cba/issues/arbitration.html (last visited Dec. 17, 2005).
226. Id.
227. Id.
228. 2004 Arbitration Cases, supra note 215….
229. Sassone, supra note 61, at Sports 1.
230. Kulfan, supra note 8, at 6G. The highest paid player in baseball in 2004 was Manny Ramirez, who made $22.5 million, while his NHL counterparts were Peter Forsberg and Jaromir Jagr, who each earned $11 million. Id. In the 2005 baseball off-season, Roger Clemens, age forty-two, became the highest-paid pitcher in MLB history. Guy Curtright, Clemens Gets His Payday, ATLANTA J.-CONST., Jan. 22, 2005, at 3D. He filed for arbitration, asking for $22 million, while his team, the Houston Astros, offered a figure of $13.5. Id. The two sides settled, however, for a one-year, $18 million deal. Id. The breakdown of Clemens’s salary reveals the staggering state of players’ salaries in professional sports. Id. If Clemens matches his performance from 2004, he would make $1 million per win in 2005. Put differently, he would make $83,994 for every inning he pitches. Id. This story is a great example of how baseball’s salary arbitration system would fail to ameliorate the NHL’s woes. Clemens and the Astros settled, as the final-offer system encourages participants to do. However, the result was a record-breaking salary figure. Id.
231. Kulfan, supra note 8, at 6G.
232. As of December 18, 2005, the NHL had not released the text of the new CBA. See NHLPA.com, Collective Bargaining Agreement, http://www.nhlpa.com/CBA/index.asp (last visited Dec. 18, 2005) (noting that the “new collective bargaining agreement will be made available here in the near future”). Until the NHL released the full contents of the new CBA, it provided a website that highlights many of the CBA’s important provisions. See CBA FAQs, supra note 29. As a result, this section will refer to the answers the NHL provided on that website, rather than referring to specific portions of the CBA. The wording of the CBA may differ from the NHL’s CBA FAQs website, but the essential principles will likely be the same.
233. CBA FAQs, supra note 29.
234. Id.
235. Id. Since the beginning of salary arbitration, the NHL has had player-only election of salary arbitration. This right is somewhat limited; however, teams may elect to arbitrate the salaries of only two classes of players. Id.
236. Id.
237. Id.
238. CBA FAQs, supra note 29.
239. Id.
240. Id.
241. Id. The CBA limits teams’ ability to do this only with players who earn more than $1.5 million in the previous year or those restricted free agents who qualify. Id.
242. Id. There was some speculation that the NHL would emerge from the lockout with a baseball-style final-offer system, but these predictions proved incorrect. Brooks, supra note 169, at 104 (noting that the NHL owners tried to alter the CBA to implement a MLB-like final-offer system in the NHL).
243. CBA FAQs, supra note 29. The other parts of the new CBA will likely have a minimal effect on, or be minimally affected by, salary arbitration.
244. Id.
245. Id.
246. See 2002–03 URO, supra note 27.
247. Loftus, supra note 54, at 47.
248. CBA FAQs, supra note 29.
249. 2002–03 URO, supra note 27.
250. See supra Part III.D.
251. CBA FAQs, supra note 29.
252. Id.
253. Id.
254. Id. The franchise’s “payroll” includes all salaries, signing bonuses, and performance bonuses paid to players. Id. Except in the case of a bona fide long-term injury (injuries that sideline a player for a minimum of twenty-four days and ten games) to one or more of a team’s players, team payrolls will never be permitted to be below the minimum or in excess of the maximum. Id. Teams at or near the upper limit that have players who incur a bona fide long-term injury are entitled to replace up to the full value of the injured player’s NHL salary (even if such salary would result in the team’s salary exceeding the cap). Id. The “replacement salary” does not count against the team’s cap, but will count against the League-wide players’ share. Id. Upon return of the injured player, the team must come into immediate compliance with the requirements of the payroll range. Id.
255. The lack of a salary cap was certainly the main failure of the previous CBA. Players’ salaries exploded across the League from 1994–2004. Loftus, supra note 54, at 47. The League’s average salary in 1994 was $560,000 and grew to $1.8 million by 2004. Id.
256. See supra Part III.D.
257. CBA FAQs, supra note 29. Under the new CBA, no player is eligible to contract for or receive in excess of twenty percent of his team’s upper limit in total annual compensation (NHL salary plus signing, roster, reporting, and all performance bonuses). Id. Put in terms of the 2005–06 salary cap figures, the CBA prohibits players from contracting for total compensation in excess of $7.8 million in any year of his contract. Id. This represents a significant departure from the previous unlimited salary scheme of the old CBA. In 2004 alone, the two highest-paid NHLers, Peter Forsberg and Jaromir Jagr, earned $11 million each. Kulfan, supra note 8, at 6G. To bring these and other contracts in line with the new CBA, it eliminated all contracts signed for the 2004–05 season. CBA FAQs, supra note 29. The NHL essentially started the 2005–06 season with a clean slate.
258. See supra Part III.D.
259. CBA FAQs, supra note 29. The new CBA also sets the minimum League salary at $450,000 for the 2005–06 and 2006–07 seasons. Id. This provision will help to decrease the disparity between the highest-paid and lowest-paid players.
DEFLATIONARY SALARY MECHANISMS
THE NBA LUXURY TAX MODEL: A MISGUIDED REGULATORY REGIME
Richard A. Kaplan
INTRODUCTION
Professional team sports leagues have struggled for nearly half a century to develop effective economic regulatory mechanisms to govern their operations to the satisfaction of both team owners and players. Meeting that goal has proven quite difficult, as the division of league revenue raises issues between owners and players as well as among the members of each group individually.1 In addition, league regulatory architects must contend with the call for “competitive balance,” which posits that for a league to be financially successful, it must foster competitiveness among its member organizations.2
Revenue distribution was substantially less complicated during the early days of American professional team sports, as team owners essentially possessed unilateral power over the terms and conditions of the players’ employment. One result of this dominance was the owner-imposed “reserve clause,” which was used to depress players’ salaries by forbidding players from negotiating with teams other than the ones that reserved them.3 Economic regulation of this type became more contentious, however, with the advent of the players’ unions in the 1960s and 1970s. After the Major League Baseball Players Association (MLBPA) and National Football League Players Association (NFLPA) both weakened their respective league’s reserve clauses through arbitration and litigation in the mid-1970s,4 leagues sought alternative ways to control costs through player movement limitations.5 Even these models of restriction—such as requiring teams that sign a free agent to provide the player’s previous team with player or draft pick compensation—were constrained further as the strength of the players’ unions grew. New and innovative regulatory systems were eventually needed to assuage the growing economic concerns of players and owners alike.
One modern solution has been to adopt a “luxury tax.” Pioneered by Major League Baseball (MLB) in the mid-1990s and … adopted by the National Basketball Association (NBA), the luxury tax as it currently exists is a penalty imposed on teams that spend above a collectively bargained level.6 The luxury tax is an attractive regulatory device because, in theory, it addresses the concerns of all parties. For owners, depending on the level of taxation, the luxury tax can be viewed as a quasi-salary cap; it may serve as a roadblock to continued spending. For players, the tax represents freedom from a salary cap and still offers the promise of unlimited salary growth. And finally, competitive balance may be achieved through a luxury tax regime by punishing big-spending teams and perhaps even redistributing the money collected to less affluent teams.
This Note explores the implications of the NBA luxury tax model (NBA Model), which packs the sort of regulatory punch that potentially makes it an example for other leagues to follow. This robust model, a complicated combination of escrow, tax, and distribution components, encourages teams to spend less on player salaries with the goal of increasing the profitability of the league as a whole.7 This Note demonstrates how the NBA Model, although successful in discouraging some team player salary expenditures, creates perverse incentives that in fact lead to greater disparity in team spending and frustrate the objectives of other important aspects of the NBA’s current collective bargaining agreement. These problems combine to produce a perpetual cycle where free-spending owners reap the benefits of better and cheaper talent while avoiding tax assessments. This sequence is the result of a number of imperfections in the design of the NBA Model, including a wildly inconsistent marginal tax rate.
Part I of this Note traces the various attempts to regulate the economics of professional team sports prior to the arrival of the luxury tax. Part II explores the operation of the MLB and NBA luxury taxes, including an examination of their corresponding tax distribution systems….
I. THE HISTORICAL DEVELOPMENT OF ECONOMIC REGULATORY MECHANISMS WITHIN PROFESSIONAL SPORTS LEAGUES
The primary mechanisms employed to internally regulate professional team sports leagues can be parceled into three major categories of both direct and indirect salary regulation: (1) restricting free agency; (2) “capping” team and individual player salaries; and (3) taxing team and individual player salaries.8 A brief review of these first two devices provides an understanding not only of what regulatory models have been tested, but also highlights the problems they have wrought that the third mechanism, the luxury tax, is intended to address.
Part I.A traces the development of restrictions on free agency, the original form of player market regulation. Teams have restricted players’ free agency in a variety of ways over the last century and still do so in a mixture of forms in all four major professional sports.9 Beginning in the early 1980s, some leagues embarked upon a different approach, instituting limits on the amount each team could allocate toward player salaries. This concept was taken one step further in the 1990s, when leagues began restricting the levels at which individual players could be paid. These more modern forms of economic regulation are called “salary caps,” and are detailed more fully in Part I.B.
A. Restricting Free Agency
The oldest method of limiting player salary growth in American professional team sports is restricting market competition for players. In a pure market setting, players can freely offer their services to each team and create competition among those teams to achieve the highest possible compensation. By instituting restrictions on player movement in an attempt to regulate supply—e.g., permitting players to become unrestricted free agents10 only when certain conditions are met—teams can limit the ability of players to extract their pure market value, potentially driving down the overall growth of salaries.11 The market can also be regulated from the demand side by discouraging teams from participating in the market through mechanisms that require teams to provide some form of compensation when they sign a free agent from another team.
1. The Reserve Clause.—The first attempt to curb the market through free agency restriction was the reserve clause. The reserve clause was shaped by professional baseball in the late nineteenth century,12 as team owners were able to protect team rights to certain players permanently so that no other team could negotiate with them.13 Players therefore either played for the team that reserved them or were forbidden from playing in the league at all.
Given this significant advantage for team owners, it was not long before professional basketball, football, and hockey leagues employed varying forms of the reserve clause.14 Oddly enough, the reserve system had the support of the players, who were convinced by management that the reserving power was necessary to maintain the economic viability of the game.15 It was not until the rise of the players’ unions that the athletes’ naivete faded, and they realized how such systems worked against their earning power.16 Baseball’s reserve clause, for example, was eviscerated by arbitration and subsequent collective bargaining with the MLBPA in the mid-1970s.17
2. The Rozelle Rule and Its Offshoots.—The NFL encountered problems with its own reserve system ten years before baseball’s was dismantled.18 As a result, NFL Commissioner Pete Rozelle developed what widely became known as the “Rozelle Rule,” which was designed to restrain player salaries by empowering the Commissioner to award compensation to a team losing its own free agent by the team signing that free agent.19 The result was striking: Between 1963 and 1974, of the 176 players to play out their option years, a paltry thirty-four signed with other teams, and only in four of those cases was compensation necessary.20 After feeling the harsh effect of the Rozelle Rule, the NFLPA brought a series of legal actions against the NFL, weakening the Rule in one federal district court,21 considerably circumscribing it in another,22 and finally getting it struck down by the Eighth Circuit in 1976.23
The demise of the reserve system and Rozelle Rule led all four leagues to develop more limited forms of restricted free agency. These systems run the gamut in terms of the role they play within league regulatory systems overall. For example, the NFL… utilizes a mild form of restricted free agency that only affects a couple of players per team per season.24 On the other end of the spectrum is the National Hockey League (NHL), which employs a sophisticated restricted free agency compensation system as its chief mechanism for limiting player salaries.25 Not unlike the Rozelle Rule, the NHL requires compensation for many (but not all) of the free agents signed by another team—using the player’s age and playing experience to determine the compensation required on the part of the signing team.26
3. The Entry Draft.—In addition to the reserve clause and Rozelle Rule, leagues also have experimented with less explicitly severe—yet perhaps equally effective—means of limiting player salaries through other mechanisms for restricting player movement. The entry draft is one derivative of the reserve clause that still exists in every major professional team sport. Prior to the season, each league conducts a draft whereby teams select new players to join the league.27 The draft resembles the old reserve system by enabling teams to acquire exclusive rights to negotiate with players, thereby seriously constricting the players’ ability to seek compensation in a competitive market.28 To temper this restriction, however, each league designates a limit to the number of years this reservation is enforceable.29
B. Salary Caps
The most effective way to temper labor costs is simply to impose a cap on the amount of money teams can spend either for players individually or their roster as a whole.30 … Team Cap models are based on intricate revenue-sharing schemes where a specified percentage of league revenue is codified as a ceiling on aggregate player salaries for the following season. Individual salary caps (Individual Caps), on the other hand, are currently employed by the NBA and NHL to offer a more limited avenue to team owners for curtailing spending on individual players.
1. The Team Cap.—The NBA pioneered the Team Cap in its collective bargaining agreement with the National Basketball Players Association (NBPA) in the spring of 1983.32 In its original incarnation, the NBA Team Cap was set at the greater of either a predetermined fixed sum33 or 53% of the league’s gross revenue minus player benefits divided by the number of teams in the league.34 To this day, the main feature of the NBA Team Cap is that it is “soft” (Soft Cap), meaning that there are a number of “exceptions” teams may employ to spend beyond the Team Cap.35 These are potent exceptions…
Under the… NBA collective bargaining agreement (1999 NBA CBA), the NBA Team Cap is derived from a predetermined percentage of “Basketball Related Income” (BRI), which is a measure of the aggregate revenue produced by the league and its teams from sources such as ticket sales, corporate sponsorships, and broadcast revenue.37 The Team Cap is established by taking 48.04% [Ed. Note: The percentage is now 51% as per the most recent NBA CBA] of “Projected BRI,”38 deducting “Projected Benefits”39 for the coming season, and dividing that number by the number of teams in the league.40 …
In 1993, the NFL became the second league to institute a Team Cap after years of acrimonious dealings between the league and the NFLPA.42 [Ed. Note: The NFL salary cap expired prior to the 2010 season and future iterations depend on the results of the subsequent collective bargaining negotiation.] Although the NFL’s version of the Team Cap borrows the NBA’s revenue-sharing concept, it is a “hard” or “actual” cap (Hard Cap), meaning that teams cannot exceed the designated threshold by any amount at any time. In exchange for accepting this rigid salary restriction,43 NFL players receive a greater formal percentage of league revenue than their NBA counterparts.44
2. Individual Salary Caps.—For a league unable to compel its players to agree to a Hard Cap, a backdoor means of achieving some measure of salary control is to limit the amount of money that may be paid to individual players. The NBA and NHL both employ Individual Caps for rookies’ salaries (Rookie Cap),45 … [and] a generally prescribed maximum salary applicable to veterans (Veteran Cap).46 The Rookie Caps were instituted as a two-tiered attack on player salaries. First, such caps were specifically aimed at slowing the rate of escalating salaries for young players who had yet to prove their worth in the professional sports context. Second, when first-year players receive large payouts in a system without a Hard Cap, the overall market for player salaries is driven upward.
The Veteran Cap also has a two-prong effect. Much like the Rookie Cap, the Veteran Cap curtails spending on player salaries by limiting the amount a team spends on any one player’s salary.47 In addition, by creating a ceiling on the highest revenue-producing players, the market will readjust downward, and nonmaximum salary players will be measured against those whose salaries have been artificially limited by the collective bargaining agreement.48
These Individual Caps, along with the Team Caps and restrictions on player movement, have been designed to foster an acceptable economic and legal balance between owners and players. Only the NFL, however, notable for its relatively weak players’ union and exceptionally profitable product, has managed a modicum of labor peace under its economic regulatory system.49 The three other major professional sports leagues, on the other hand, are still struggling to achieve stable regulatory regimes. In searching for new ways to address these issues, MLB, [and the] the NBA … have turned to the idea of taxing high-spending teams in an effort to appease both owners and players.50
II. THE LUXURY TAX
The luxury tax, an idea that first materialized during the labor negotiations of both MLB and the NHL in 1994,51 was first realized in the 1997 MLB collective bargaining agreement (1997 MLB CBA).52 Today, differing forms of luxury taxes exist in both MLB and the NBA. While these two versions of the luxury tax have varying components, their conceptual frameworks share one major feature: The entity taxed is required to pay a specified percentage of the margin by which its spending exceeds a mandated threshold.53
There are a number of ways in which the luxury tax concept attempts to meet the challenges facing professional team sports’ economic regulatory systems. First, when owners are unable to secure a Hard Cap, the best substitute may be taxation’s near-certain drag on players’ salaries.54 In essence, if teams are forced to pay back to the league—perhaps even to other teams55—some percentage of what they pay their players, they will be encouraged to rework traditional formulas for assessing the marginal benefits of player signings.56 Second, players, along with the minority of owners who have the ability and willingness to outspend other owners, appreciate that the luxury tax is not an absolute ceiling on salaries. Third, leagues argue that league-wide revenue will rise under a luxury tax system because it promotes greater competitive balance.57
….
A. The Two Incarnations of MLB’s Luxury Tax
After highly contentious negotiations beginning in 1994 and lasting until 1996,58 MLB and the MLBPA finally came to an agreement59 over acceptable salary control mechanisms, including the first ever professional sports luxury tax.60 The tax operated based on an adjustable threshold level that determined which teams were deemed to be overspenders.61 The tax adjusted by permitting the minimum threshold to be raised such that a maximum of only five teams could exceed it in any given year.62 The tax was to be assessed for only three of the agreement’s five years, at a minimum total payroll of $51 million in 1997, $55 million in 1998, and $58.9 million in 1999.63 In terms of the level of taxation, there was a flat rate of 35% charged on each dollar a team spent above the threshold in 1997 and 1998 and 34% in 1999.64 The proceeds of the luxury tax payments were divided in several ways. The first $17 million was earmarked for the League revenue sharing plan,65 at least $3 million to the Industry Growth Fund (IGF),66 and up to $2.5 million to teams overcharged during previous luxury tax calculations.67
As one might expect, the taxes were rather “soft.”68 For example, the greatest tax imposed in 1998 was on the Baltimore Orioles, whose $79.5 million payroll earned them a meager $3.1 million tax, or 3.9% of their aggregate player salary expenditures.69 The adjustable mechanism kicked in because the midpoint between the fifth and sixth teams was approximately $70 million,70 and as a result, every player the Orioles signed over that mark cost the team 135% of his actual salary.
In the … 2002 MLB CBA, the two sides again agreed on a luxury tax, although this time it has a different name and structure. As opposed to being called a “luxury tax” as it was in the 1997 MLB CBA,71 the updated article XXIII is now called the “Competitive Balance Tax.”72 In addition, the adjustable threshold mechanism was eliminated. The tax threshold is now simply a flat number—$117 million in 2003, $120.5 million in 2004, $128 million in 2005, and $136.5 million in 2006.73 [Ed. Note: The thresholds were set at $148 million in 2007, $155 million in 2008, $162 million in 2009, $170 million in 2010, and $178 million in 2011.] In terms of the percentage that offenders are taxed, in 2003 the tax rate was a straight 17.5% for every dollar spent above the threshold.74 Beginning in 2004, however, different rates apply, depending on whether a team is a first-time, second-time, and/or consecutive-year offender.75 The tax distribution system also was altered, with the first $5 million of tax proceeds held in reserve for any tax refunds based on after-calculation adjustments,76 50% of the remaining proceeds used to fund active player benefits,77 25% designated for “projects and other efforts to develop baseball players in countries where organized high school baseball is not played,”78 and 25% once again dedicated to the IGF.79
The early returns on the 2002 version of the MLB tax demonstrate its utter ineffectiveness.80 The first year of the new taxation system, 2003, produced only one taxpayer, the New York Yankees.81 From this data it might appear that the taxation system was in fact effective because teams were forced to hold down their salary expenditures, leaving only the Yankees in violation. However, only three teams spent within 10% of the $117 million mark during the previous season,82 suggesting that most teams’ decisions to stay below the tax threshold in 2003 were based less on the impending imposition of the luxury tax than they were on preexisting economic considerations.
B. The History of the NBA Luxury Tax
The more intriguing of the two taxation systems is the NBA Model. While MLB’s luxury tax model is quite limited, the one currently employed by the NBA clearly has been designed and implemented to have a major impact on the league’s overall regulatory regime.
The current version of the NBA luxury tax was the product of two rounds of collective bargaining. The first round occurred in 1994–1995, after the previous collective bargaining agreement expired and the season was played under a “no strike/no lockout” agreement. These negotiations were extremely contentious, causing one union chief to resign83 and another almost to lose his constituency altogether.84 The main source of disagreement was over the league’s desire to implement a luxury tax. Given the players’ conviction on the issue, the two sides eventually reached an agreement that left the luxury tax behind.85
Luxury tax consideration was not dormant for long, as the NBA owners, who voted to reopen the collective bargaining agreement during the 1997–1998 season,86 locked out the players on July 1, 1998, with intentions of garnering greater cost-control mechanisms.87 The players’ share of BRI under the Soft Cap regime had risen to 57%.88 This led the owners to stand firm on their demands, resulting in the first work stoppage involving cancelled games in the NBA’s labor history.89 When a deal was finally reached in January 1999 (1999 NBA CBA), in addition to limiting individual player salaries90 and gaining longer-term commitments from rookies to the teams holding their rights,91 the NBA’s biggest achievement was its coveted luxury tax system.92
C. How the NBA Luxury Tax System Works
The NBA luxury tax operates as part of a larger regulatory scheme called the Escrow and Team Payment (or tax) system.93 To fully comprehend the NBA Escrow and tax system, it first is necessary to understand its conceptual foundations. Not only did the NBA set out to limit player salaries as a general matter, it chose to do so in a way that approximated its preferred regulatory mechanism: the Hard Cap….
With the owners’ desire to limit player salaries to a specified percentage of league revenues and the players’ steadfast rejection of a Hard Cap, the two sides developed a creative mechanism aimed at further limiting the players’ share of BRI while not quite using it as an absolute ceiling. From the league perspective, the Escrow and tax system is designed to serve both as a form of “insurance” against player salaries rising above a specified percentage of league revenue and as a penalty against free-spending teams. To accomplish this, the Escrow component dictates that, during each season in which there is a “Projected Overage,” team owners withhold and put into escrow 10% [Ed. Note: 9% is now held in escrow] of all players’ salaries.94 At the conclusion of each season, if after calculating that season’s BRI, final team salaries, and player benefits, it is determined that player salaries and benefits have exceeded a designated percentage of league revenues … (Escrow Threshold),95 then the Escrow funds will be used to reimburse the owners to the point where the players’ total salaries are reduced to that percentage…. The remaining escrowed money would be returned to the players relative to their individual contributions.
The Escrow has a ceiling, however, of 10% of the players’ salaries and benefits.96 Should the … Escrow not cover the “Overage” (i.e., the amount by which the players’ share of BRI exceeds the designated percentage), the Escrow account would be exhausted and the luxury tax would be activated…. It is important to underscore that the tax is not assessed on teams merely exceeding the Team Cap figure … or even the Escrow Threshold number …; rather the Penalty Threshold only becomes effective when player salaries and benefits exceed the escrowed money … and is only applied to teams whose expenditures exceed that same threshold.
The 1999 NBA CBA also sets forth the level at which Penalty Threshold violators are taxed. During negotiations, the NBA pushed for as much as a 200% tax100 and settled for a 100% tax rate on any money spent by teams beyond the Penalty Threshold.101 Therefore, if a team was $5 million over the … Penalty Threshold …, it would be assessed $5 million in taxes.
….
Notes
1. For example, one major source of disagreement among team owners is whether to cap player salaries. While most teams advocate a “salary cap” system because it controls rising player salaries and helps equalize the commitment of resources to talent across a league’s teams, see infra Part I.B, owners with greater resources generally prefer a system more closely resembling a free market so they can use their substantial wealth to outbid others for premier talent.
2. Those who believe that enhanced competitive balance positively affects revenue argue that, if a league’s teams coordinate their economic behavior, they can maximize their revenue production by enabling even distribution of on-field, on-ice, or on-court success. Without such cooperation, however, “teams in certain markets will systematically outbid others for talented players,” allowing these teams to “systematically dominate league play,” resulting in a “competitive imbalance [that] will reduce the quality and attractiveness of the league’s product.” Stephen F. Ross, The Misunderstood Alliance Between Sports Fans, Players, and the Antitrust Laws, 1997 U. ILL. L. REV. 519, 560; see Joseph P. Bauer, Antitrust and Sports: Must Competition on the Field Displace Competition in the Marketplace?, 60 TENN. L. REV. 263, 274-75 (1993) (“While the individual teams… can be competitors in a number of respects, some measure of cooperation is essential for success of the entire enterprise.”).
It should be noted, however, that those who hold this view often assume that team spending regulation necessarily equalizes the level of each team’s talent. One argument supporting that assumption is that big-market teams have wellsprings of revenue, thereby allowing them—in an unregulated market—to expend more revenue to attract the best players at the expense of small-market teams. See James Quirk & Rodney Fort, HARD BALL: THE ABUSE OF POWER IN PRO TEAM SPORTS 56-57 (1999) [hereinafter, Quirk & Fort, HARD BALL] (stating that some argue “the… lack of ‘competitive balance’ … leads to a fall in gate receipts at small-market teams as their won–lost records decline[], and might even lead to bankruptcy and exit from the league for some small-market teams”); Kevin E. Martens, Fair or Foul? The Survival of Small-Market Teams in Major League Baseball, 4 MARQ. SPORTS L.J. 323, 362-63 (1994) (“In an environment where large-market teams have the financial resources to attract the greatest number of quality free agents, small-market clubs must… operate at a competitive disadvantage.”). At the very least, proponents of this theory argue that the ability of some teams to spend more on player salaries than others gives them “more margin for error” and therefore a better chance at success. Andrew Zimbalist, MAY THE BEST TEAM WIN 47 (2003) [hereinafter Zimbalist, MAY THE BEST TEAM WIN].
Others dispute these claims: “Empirical evidence rejects both the claim that a handful of rich teams systematically outbid their rivals for star players and the claim that dynasties result from an unrestrained labor market.” Ross, supra, at 560-61; see Christopher D. Cameron & Michael J. Echevarria, The Ploys of Summer: Antitrust, Industrial Distrust, and the Case Against a Salary Cap for Major League Baseball, 22 FLA. ST. U. L. REV. 827, 853 (1995) (“The main problem with competitive balance theory is the lack of empirical evidence supporting it…. Indeed, all the evidence points in precisely the opposite direction: baseball enjoys remarkable competitive balance without a salary cap.”); see, e.g., Larry Brooks, Owners’ Claims Are Hot Air, N.Y. POST, Jan. 4, 2004, at 81 (rebutting National Hockey League’s (NHL) calls for increased competitive balance when “eight different teams have filled the last eight conference slots[,] … and only four [were] out of playoff contention [at mid-season]”). See generally Michael Lewis, MONEYBALL: THE ART OF WINNING AN UNFAIR GAME (2003) (chronicling success of perennially frugal Oakland Athletics).
One may be distrustful of league-based calls for greater competitive balance because they often correspond to a request for further salary regulation. See Robert C. Berry et al., LABOR RELATIONS IN PROFESSIONAL SPORTS 6-7 (1986) (declaring that leagues use mechanisms to regulate salaries “in the name of competitive balance” while those mechanisms not-so-coincidentally “restrict[] competitive bidding for players’ services”). Regardless, this Note assumes that competitive balance is a goal of team owners in part because it is often the very aim for which they advocate. See, e.g., Pre-Hearing Brief of Nat’l Basketball Ass’n at 6, Nat’l Basketball Players Ass’n and Nat’l Basketball Ass’n (System Arbitrator 2002) (No. 02-01) (on file with the COLUMBIA LAW REVIEW) (calling competitive balance one of two of league’s “broad objectives”).
3. See infra notes 12-17 and accompanying text.
4. See Charles P. Korr, THE END OF BASEBALL AS WE KNEW IT: THE PLAYERS UNION, 1960-81, at 149-67 (2002) (detailing the “Messersmith Case,” an arbitration case between Major League Baseball and its union, which resulted in dismantling of reserve clause).
5. See infra Part I.A.3.
6. A tax can also be placed on the revenue teams earn. See, e.g., Basic Agreement Between the 30 Major League Clubs & Major League Baseball Players Association, Effective Sept. 30, 2002, art. XXIV, at 100 [hereinafter 2002 MLB CBA].
7. See Pre-Hearing Brief of Nat’l Basketball Ass’n at 6, Nat’l Basketball Players Ass’n (No. 02-01).
8. This list is not exhaustive—it only covers the most significant forms of regulation. For example, team revenue sharing, player-team salary arbitration, guaranteed versus non-guaranteed contracts, and limits on the number of total contract years available may influence the growth of player salaries. In the mid-1980s, MLB attempted to limit player salary growth through collusion, whereby owners jointly decided not to make bids for free agents. Quirk & Fort, HARD BALL, supra note 2, at 90-91; Gerald W. Scully, THE BUSINESS OF MAJOR LEAGUE BASEBALL 39-43 (1989) [hereinafter Scully, BUSINESS OF BASEBALL]; James B. Dworkin & Richard A. Posthuma, PROFESSIONAL SPORTS: COLLECTIVE BARGAINING IN THE SPOTLIGHT, IN COLLECTIVE BARGAINING IN THE PRIVATE SECTOR 217, 236-37 (Paul F. Clark et al. eds., 2002).
9. They are MLB, the NBA, the National Football League (NFL), and the NHL.
10. An “unrestricted” free agent is one for whom the original team has no matching rights and/or for whom no compensation is required. See, e.g., NFL Collective Bargaining Agreement, Jan. 8, 2002 (as amended), art. I, 2(ah), at 6 [hereinafter 2002 NFL CBA] (stating that an unrestricted free agent is a player “who completes performance of his Player Contract, and who is no longer subject to any exclusive negotiating rights”).
11. This is not to say that a “pure” market setting would yield net benefits for every player. For example, certain collectively bargained guarantees, such as a minimum allowable salary, enable some players to earn more than would otherwise be available if no regulation existed whatsoever.
12. The “reserve rule” was invented by Boston Braves owner Arthur Soden in 1879 but was not officially installed until 1883. Quirk & Fort, HARD BALL, supra note 2, at 55; Scully, BUSINESS OF BASEBALL, supra note 8, at 2-3. The National League, which was formed prior to the American League in 1876, instituted its reserve clause as a private agreement among the teams in which “exclusive property rights” were granted to five players for each team. Id. at 2. The system apparently worked, as player salaries fell in relation to revenues, and teams began to make profits for the first time. Id.
13. See Am. League Baseball Club of Chi. v. Chase, 149 N.Y.S. 6, 10 (Sup. Ct. 1914) (quoting section 3, article VI of the National Agreement [for the government of professional baseball]: “The right and title of a major league club to its players shall be absolute….”). For more on the history of the reserve clause, see Gerald W. Scully, THE MARKET STRUCTURE OF SPORTS 11-12 (1995); Jack F. Williams & Jack A. Chambless, Title VII and the Reserve Clause: A Statistical Analysis of Salary Discrimination in Major League Baseball, 52 U. MIAMI L. REV. 461, 472-73 (1998).
14. Quirk & Fort, Hard Ball, supra note 2, at 11-12, 18, 22.
15. Id. at 52, 58. Some players even testified before Congress in the 1950s in an effort to keep the reserve system intact. See Andrew Zimbalist, Baseball Economics and Antitrust Immunity, 4 SETON HALL J. SPORT L. 287, 290 (1994). Some of this thinking can be ascribed to the fact that, until the mid-1970s, most professional sports associations or unions were essentially “company unions.” Quirk & Fort, HARD BALL, supra note 2, at 51. Another major factor was the general societal sense that athletes were fortunate to be getting paid for playing essentially a “kids” game. Id.; Paul D. Staudohar, PLAYING FOR DOLLARS: LABOR RELATIONS AND THE SPORTS BUSINESS 3 (1996) [hereinafter Staudohar, PLAYING FOR DOLLARS] (“In the decades before unions and collective bargaining became ingrained in the sports industry, professional athletes were treated like privileged peons.”).
16. See Quirk & Fort, HARD BALL, supra note 2, at 51-52; Staudohar, PLAYING FOR DOLLARS, supra note 15, at 3-4. Professors James Quirk & Rodney Fort put the impact of the MLBPA on the reserve clause plainly: “Changes in the player reservation system that have taken place in baseball since the early 1970s are due almost exclusively to the action of the Major League Players Association….” James Quirk & Rodney D. Fort, PAY DIRT: THE BUSINESS OF PROFESSIONAL TEAM SPORTS 192-93 (1992) [hereinafter Quirk & Fort, PAY DIRT].
17. The MLB reserve clause was dealt its first major blow in late 1975, when arbitrator Peter Seitz ruled that pitchers Andy Messersmith and Dave McNally were “free agents” after each played the season without a contract (i.e., their “option” season) as a result of refusing their clubs’ offers following the previous season. Scully, BUSINESS OF BASEBALL, supra note 8, at 37; see Quirk & Fort, HARD BALL, supra note 2, at 61-62 (“Arbitration accomplished what one hundred years of baseball history had been unable to do, namely eliminating the reserve clause.”). Professor Scully claims that “prior to the Messer-smith decision players were paid just a small fraction of their actual contribution to team revenues” and with “the coming of free agency, clubs bid against each other for… talent, making rational decisions about the value of the player to the club relative to his market price.” Scully, BUSINESS OF BASEBALL, supra note 8, at 153. In basketball, the reserve clause was terminated through a court-approved settlement in Robertson v. National Basketball Association, 72 F.R.D. 64, 67 (S.D.N.Y. 1976) (approving settlement that “provided for the elimination of the reserve clause, a phaseout of reserve compensation, [and] a settlement fund for the class of $4.3 million”).
18. The NFL’s reserve structure, like that of baseball, operated as part of an option system. See supra note 17. While teams technically could sign players that played out their option years, there was a “gentleman’s agreement” among the owners not to do so. Quirk & Fort, PAY DIRT, supra note 16, at 190-91. When the Baltimore Colts’ owner violated this agreement in 1963, the NFL moved quickly to formalize its previous policy. Id.
19. The rule stated: [A] player, even after he has played out his contract under the option rule and has thereby become a free agent, is still restrained from pursuing his business to the extent that all league members with whom he might otherwise negotiate for new employment are prohibited from employing him unless upon consent of his former employer or, absent such consent, subject to the power of the NFL Commissioner to name and award one or more players to the former employer from the active reserve or selection list of the acquiring club—as the NFL Commissioner in his sole discretion deems fair and reasonable. Kapp v. Nat’l Football League, 390 F. Supp. 73, 82 (N.D. Cal. 1974) (emphasis added).
20. Mackey v. Nat’l Football League, 543 F.2d 606, 611 (8th Cir. 1976). Compare this with the most recent data, which shows that, prior to the 2004 NFL season, a whopping 515 free agents changed teams. M. J. Duberstein, NAT’L FOOTBALL LEAGUE PLAYERS ASS’N, NFL OFF-SEASON SALARY AVERAGES & SIGNING TRENDS 145 (2004).
21. Kapp, 390 F. Supp. at 82 (“We conclude that such a rule imposing restraint virtually unlimited in time and extent, goes far beyond any possible need for fair protection of the interests… or the purposes of the NFL and that it imposes upon the player-employees such undue hardship as to be an unreasonable restraint….”).
22. See Bryant v. NFL, No. CV 75-2543 HP, 1975 U.S. Dist. LEXIS 11224, at 3-6 (C.D. Cal. 1975) (granting restraining order temporarily preventing enforcement of Rozelle Rule).
23. Mackey, 543 F.2d at 615 (ruling that Rozelle Rule was mandatory subject of bargaining under National Labor Relations Act, and NFL’s failure to bargain over the issue was violation of law). In 1977, however, the NFLPA agreed to a right of first refusal compensation system in a new collective bargaining agreement. Matthew S. Collins, Note C: C as in Cash, Cough it Up, and Changes—NFL Players Score with Free Agency Following Freeman McNeil’s Big Gain, 71 WASH. U. L.Q. 1269, 1274–75 (1993).
24. The NFL’s current free agent system has two major components. First, any player with five or more “accrued” seasons of NFL playing service is automatically an “unrestricted” free agent. 2002 NFL CBA, supra note 10, art. XIX, 1(a), at 59. A player with at least three but fewer than five accrued seasons is authorized to seek offers from other clubs after his contract expires, but if the player receives an offer, his old club must choose between matching it and retaining him, or letting him go to the new club in return for draft choice compensation. Id. art. XIX, 2(a)–(b), at 60-61. Also, any player who has accrued fewer than three seasons and whose contract has expired is a restricted free agent—his free agent team is only required to offer a one-year contract at the minimum salary under the CBA. Id. art. XVIII, 2, at 57.
Second, free agency is subject to a relatively minor constraint under the “Franchise” and “Transition” player tags. A player subject to the Transition tag must be offered the average of the top ten salaries league-wide in the player’s position, and he is subject to a right of first refusal by his original club. Id. art. XX, 3-5, at 72–74. The Franchise tag, which can only be used once per season and not in conjunction with the Transition tag, requires teams to make an offer equal to the average of the top five salaries in the player’s position. Id. art. XX, 2(c)(ii), at 70. Included in salaries are “roster and reporting bonuses, pro-rata portions of signing bonuses, and other payments to players in compensation for the playing of professional football.” Id. art. XX, 2(e), at 71.
25. The system is a holdover from the 1970s and early 1980s, when the NHL originally operated based on a “modified” Rozelle Rule. McCourt v. Cal. Sports, Inc., 600 F.2d 1193, 1194 (6th Cir. 1979). The only major difference is that compensation designed to equalize the signing team and the former team would be awarded by an arbitrator instead of the commissioner. See Berry et al., supra note 2, at 211 (describing “equalization,” whereby if signing team and former team of free agent cannot agree on compensation, dispute is heard by arbitrator). Unlike the NFL model, the NHL’s regulatory regime withstood litigation despite having similarly stern consequences. Only three arbitration cases based on equalization were decided during that period. Id. at 212; Staudohar, PLAYING FOR DOLLARS, supra note 15, at 155.
26. See Collective Bargaining Agreement, NHLPA/NHL, Effective June 26, 1997 (as amended), art. 1, at 3, art. 10, at 23-37 [hereinafter 1997 NHL CBA]. At one time, NHL teams losing a free agent had the option of selecting an active player—as opposed to a draft pick—from the signing team’s roster, although compensation now is restricted solely to draft choice compensation. See id. art. 10, at 35-36. Under the 1982 NHL collective bargaining agreement, a team that signed another team’s free agent for $200,000 or more had to compensate the original team with two first-round draft choices or a first-round draft choice plus a player on the active roster. Berry et al., supra note 2, at 227.
27. To foster competitive balance, each league allows its teams to pick incoming players in the reverse order of the teams’ winning percentages at the conclusion of the regular season. What varies among leagues is who is eligible for the draft, how many players are drafted, and whether some form of lottery system is used whereby teams are assigned a percentage chance of being among the first teams to draft according to how poorly they did in the previous season.
28. See Smith v. Pro-Football, 420 F. Supp. 738, 746 (D.D.C. 1976) (describing NFL Draft as one that “leaves no room whatever for competition among the teams for the services of college players, and utterly strips them of any measure of control over the marketing of their talents”). In Robertson v. National Basketball Association, the court outlined what was at stake in the collegiate draft system: Whereas the reserve clause prevents teams from competing for veteran players, the draft prevents bidding for rookies. The net effect of the two mechanisms is to force a player to deal only with the NBA club which “owns” the rights to him. If the player refuses to go along with the system, he will not play ball in the NBA…. 389 F. Supp. 867, 892 (S.D.N.Y. 1975).
It should be noted, however, that another key function of the draft is to spread the league’s incoming talent “among the various teams … and help the weaker teams in the league improve.” Glenn M. Wong, ESSENTIALS OF SPORTS LAW 545 (3d ed. 2002).
29. See, e.g., NBA Collective Bargaining Agreement, Jan. 20, 1999, art. VIII, 1(c), at 137 [hereinafter 1999 NBA CBA] (indicating that teams have rights to players chosen in first round of draft for four years, including one “option” year); 2002 NFL CBA, supra note 10, art. XVI, 1-8, at 46–49.
30. While caps on salaries might appear to be anticompetitive restrictions on trade, they have been deemed permissible if imposed as part of a collective bargaining agreement. See Wood v. Nat’l Basketball Ass’n, 809 F.2d 954, 961-62 (2d Cir. 1987) (“Were a court to intervene and strike down the draft and salary cap, the entire agreement would unravel. This would force the NBA and [National Basketball Players Association] to search for other avenues of compromise … less satisfactory to them than the agreement struck down…. We decline to take that step.”).
….
32. Berry et al., supra note 2, at 183. While the NBA was the first league to employ the Team Cap, the concept of “free player movement with salary constraints” was first proposed by NFLPA Executive Director Ed Garvey in the NFL’s 1982 collective bargaining negotiations. See Paul C. Weiler & Gary R. Roberts, SPORTS AND THE LAW 315 (2nd ed. 1998).
33. Berry et al., supra note 2, at 184. The fixed sum was $3.6 million in the first year, $3.8 million in 1985–1986, and $4 million in 1986–1987. Id.
34. Player benefits are costs paid by the NBA and include, but are not limited to, pensions, life insurance, disability insurance, medical and dental insurance, the employer’s portion of payroll taxes, and a share of costs of the anti-drug program. 1999 NBA CBA, supra note 29, art. IV, 1, at 34-40. Subtracting benefits further limits the growth of the salary cap; since benefits are paid separately from salaries, this formula now incorporates—or gives credit to the owners for paying—benefits in the formula.
35. Examples of these are the $1 Million Exception, Mid-Level Salary Exception, and the “Larry Bird” Exceptions….
36. See Nat’l Basketball Players Ass’n, 2003–2004 NBA Preliminary Projected Calculation of Escrow and Tax To Be Distributed to Teams (June 2004) (on file with the COLUMBIA LAW REVIEW) [here-inafter 2003–2004 Escrow & Tax Payout]; Nat’l Basketball Players Ass’n, 2002–2003 NBA Preliminary Projected Calculation of Escrow and Tax To Be Distributed to Teams (June 2003) (on file with the COLUMBIA LAW REVIEW).
37. 1999 NBA CBA, supra note 29, art. VII, 1(a), at 52. BRI is: “The aggregate operating revenues [including the value of barter transactions] received or to be received on an accrual basis … by the NBA, NBA Properties, Inc., including any of its subsidiaries … any other entity which is controlled by, or in which the NBA, Properties … and/or a group of NBA Teams owns at least 50% of the issued and outstanding ownership interests … granted to ownership interests not owned by the NBA … from all sources, whether known or unknown, whether now in existence or created in the future, to the extent derived from, relating to or arising directly or indirectly out of the performance of Players in NBA basketball games or in NBA related activities.”
Id. The agreement also includes income derived from things such as “regular season gate receipts,” “all proceeds … from the broadcast or exhibition of, or the sale, license or other conveyance or exploitation of the right to broadcast or exhibit” NBA games, “all Exhibition game proceeds,” “playoff gate receipts,” “in-arena sales of novelties and concessions, sales of novelties in team-identified stores within a 75-mile radius of the area, NBA game parking and programs, Team sponsorships … Team promotions, temporary arena signage, arena club revenues, summer camps … mascot and dance team appearances,” “proceeds from premium seat licenses,” and “forty (40) percent of the gross proceeds from fixed arena signage” and “of the gross proceeds… from the sale, lease, or licensing of luxury suites.” Id. art. VII, 1(a)(1)(i)-(ix), at 53-57.
38. Projected BRI is the sum of (1) BRI from the previous year plus 8% and (2) “the rights fees or other non-contingent payments stated in [the NBA’s television contracts] with respect to the [upcoming season].” Id. art. VII, 1(c)(1)-(2), at 68-69.
39. Projected Benefits are “the projected amounts to be paid or accrued by the NBA or the Teams… for the upcoming Season with respect to the [players’] benefits to be provided for such Season.” Id. art. IV, 6, at 44.
40. There were twenty-nine teams in the NBA in 2003–2004, and there will be thirty in 2004–2005 with the addition of the Charlotte Bob-cats. Since the most reliable data available is based upon a twenty-nine-team league, this Note assumes in its calculations that there are twenty-nine teams in the NBA except where otherwise noted.
….
42. This period included a players’ strike, the use of replacement players, the voluntary decertification of the NFLPA, a precedent-setting lawsuit, and a class action lawsuit. See Paul C. Weiler, LEVELING THE PLAYING FIELD: HOW THE LAW CAN MAKE SPORTS BETTER FOR FANS 108-10 (2000); Dworkin & Posthuma, supra note 8, at 247-49.
43. Although, to be more precise, the NFLPA actually proposed the salary cap—first a loose version in 1982 and then a more definite one prior to the 1993 agreement. See Weiler, supra note 42, at 108 (“Ironically, in football [the team salary] cap had been won by the players….”); Dworkin & Posthuma, supra note 8, at 247 (“In 1982 the players demanded a fixed percentage of NFL gross revenues (55 percent) for their salaries.”).
44. The NFL salary cap percentage is 64.75%, 2002 NFL CBA, supra note 10, art. XXIV, 4(a), at 95, while the NBA salary cap is 48.04%, 1999 NBA CBA, supra note 29, art. VII, 2(a)(1), at 71….
There is one additional relevant difference between the two systems. In both leagues, when a player is released from the team, the residual amount owed to the player still counts against the team’s Team Cap number. Therefore, if Team P waives Player Q, and the team is still obligated to pay Player Q $1 million per year for the next three years even though Player Q is no longer with Team P, his salary still counts against the Team Cap. Most NBA contracts are guaranteed for what is termed “lack of skill.” Thus, when a team releases a player whose contract contains this guarantee, his salary remains on its Team Cap. 1999 NBA CBA, supra note 29, art. VII, 4(a)(1), at 86. By contrast, less than five percent of active NFL players between 1995 and 2002 had guaranteed base salaries, which significantly reduces the Team Cap implications of releasing a player. See Nat’l Football League Players Ass’n, A New Look at Guaranteed Contracts in the NFL 3, available at http://www.nflpa.org/PDFs/Shared/GuaranteedContracts.pdf (last visited Sept. 15, 2004) (on file with the COLUMBIA LAW REVIEW) (stating that “the average number of players with guaranteed base salary from 1995 through 2002 is 40 per season”). It must be noted, however, that a number of NFL contracts often include “signing bonuses,” which are prorated for Team Cap purposes across the life of the contract and therefore would still count against the Team Cap even if a player is waived. 2002 NFL CBA, supra note 10, art. XXIV, 7(b)(i), at 100.
45. The “Rookie Scale” in the NBA provides for a maximum salary for each first-round draft pick based on what number selection that player is in the draft. See 1999 NBA CBA, supra note 29, Exhibit B, at B-1 to B-7. The 1997 NHL CBA provided for a maximum dollar amount that limited the compensation teams could offer draft picks. 1997 NHL CBA, supra note 26, 9.3(a). Unlike the NBA agreement, the NHL agreement incorporated only one dollar amount that applies to all picks—there is no “slotting” based on where a player is drafted.
46. Players who made more than the prescribed maximums at the time of the signing of the 1999 NBA CBA were granted an exception to the new individual salary limits. Paul D. Staudohar, Labor Relations in Basketball: The Lockout of 1998-99, MONTHLY LAB. REV., Apr. 1999, at 3, 8.
47. In the NBA, the maximum prescribed salary depends on the number of years a player has played in the league. For any player who has completed fewer than seven years of service, the maximum salary of the first year of a new contract is the greater of 25% of the team salary cap, 105% of his previous year’s salary, or $9 million. 1999 NBA CBA, supra note 29, art. II, 7(a)(i), at 23. For any player with between seven and nine years of service, the maximum salary is the greater of 30% of the salary cap, 105% of his previous year’s salary, or $11 million. Id. art. II, 7(a)(ii), at 23. Any player who has completed ten or more years of service can receive in the first year of his new contract the greater of 35% of the salary cap, 105% of his previous season’s salary, or $14 million. Id. art. II, 7(a)(iii), at 23.
48. An argument can be made, however, that the maximum also becomes a number that is more “reachable” by certain players and therefore drives some salaries that would fall just below that level up to that level. For example, a ten-year veteran who may otherwise be worth $12 million annually may receive the maximum salary of $14 million as a measure of respect by the signing club.
49. See Daniel Kaplan & Liz Mullen, Upshaw to Announce Early Extension Talks, STREET & SMITH’S SPORTS BUSINESS J., Jan. 19, 2004, at 1 (stating that NFLPA and NFL will begin talks to extend their current agreement three years before its expiration, which would give NFL “the longest period of labor peace enjoyed by any of the Big Four team sports”).
50. In the 1999 NBA CBA, the tax is never given a formal name other than “Team Payments.” 1999 NBA CBA, supra note 29, art. VII, 12(g), at 135. In the 2002 MLB CBA, it is referred to as the “Competitive Balance Tax.” 2002 MLB CBA, supra note 6, art. XXIII, at 78. This represented an interesting change for baseball, which, under a somewhat similar taxation system in its prior agreement, termed the article XXIII tax the “Luxury Tax.” Basic Agreement between The American League of Professional Baseball Clubs and The National League of Professional Baseball Clubs and Major League Baseball Players Association, Effective Jan. 1, 1997, art. XXIII [hereinafter 1997 MLB CBA], reprinted in Jeffrey S. Moorad, Negotiating for the Professional Baseball Player appx. 5A at 5-39, in 1 LAW OF PROFESSIONAL & AMATEUR SPORTS 5-1, 5-104 (Gary A. Uberstine ed., 2002).
51. Weiler & Roberts, supra note 32, at 317; Taylor Buckley, Baseball Luxury Tax Will Land in the Lap of Spectating Public, USA TODAY, Nov. 17, 1994, at 10C. The first serious discussions regarding the use of a tax on team payrolls occurred between the NHL and the NHLPA during their 1993–1995 labor negotiations. The NHL negotiations resulted in a three-month shutdown of the 1994–1995 NHL season, and the NHL’s proposal that included a 200% tax on team salaries that exceeded the average team salary was not part of the resulting agreement. See Helene Elliott, Season Now in Jeopardy, L.A. TIMES, Oct. 6, 1994, at C1 (stating that NHL backed off its 200% tax proposal).
52. 1997 MLB CBA art. XXIII, reprinted in Moorad, supra note 50, at 5-104.
53. Baseball also has a process by which it taxes team revenue, under the heading of “revenue sharing.”
54. See Lisa Dillman, Players Submit New Plan, L.A. TIMES, Oct. 11, 1994, at C1 (quoting NHLPA boss Bob Goodenow as saying that “any tax is a drag on salaries”); Len Hochberg, Hockey Stays in Deep Freeze, WASH. POST, Oct. 29, 1994, at H1 (citing league officials as wanting a substantial tax to “slow” salary growth).
55. See infra notes 102-107 and accompanying text.
56. Indeed, if a player expected to produce $1 million in revenue actually cost his team $1 million plus a 50% tax on that salary, the total $1.5 million signing cost would no longer be efficient for that organization.
57. See supra note 2 and accompanying text.
58. This included what Professor Paul Staudohar called “the mother of all sports strikes.” Staudohar, PLAYING FOR DOLLARS, supra note 15, at 49. The strike to which he refers lasted 232 days and forced the cancellation of the 1994 World Series. Id. at 49-50.
59. This agreement, which was signed in December, 1996, followed the 1994–1995 strike. Dworkin & Posthuma, supra note 8, at 239.
60. Weiler, supra note 42, at 116; Dworkin & Posthuma, supra note 8, at 239.
61. 1997 MLB CBA art. XXIII, B(3), reprinted in Moorad, supra note 50, at 5-105.
62. Id. art. XXIII, B(3)(b), at 5-105 to 5-106. The CBA took the midpoint between the fifth and sixth teams at the threshold as long as it was above the minimum designated level.
63. Id. art. XXIII, B(2), at 5-105. This “minimum” was only necessary if the “arithmetic mean” of the fifth and sixth highest spending teams fell below those numbers. Id. art. XXIII, B(3)(a), at 5-105.
64. Id. art. XXIII, B(5), at 5-106.
65. Id. art. XXIII, H(1)-(2), at 5-119. Under this plan, only the bottom five American League clubs in net local revenue receive luxury tax distribution payments. “Each of the five (5) American League Clubs that rank[] the lowest in Net Local Revenue for 1996 shall be paid an additional $1.4 Million on February 1, 1998. Such payments shall be funded by Luxury Tax proceeds for the 1997 Contract Year pursuant to Article XXIII….” Id. art. XXV, C(1)(b), at 5-126 to 5-127.
66. Id. art. XXIII, H(3), at 5-119. “The objective of IGF is to promote the growth of baseball in the United States and Canada, as well as throughout the world.” Id. art. XXVI, A, at 5-136.
67. Id. art. XXIII, H(4), at 5-119 to 5-120. “Overcharging” may occur if a player does not receive an option buyout, id. art. XXIII, E(5)(b) (ii), at 5-112, if a club option year is not exercised, id. art. XXIII, E(5)(c)(ii)(C), at 5-113, or if a player nullifies an option year, id. art. XXIII, E(5)(d)(iii), at 5-114.
68. Weiler, supra note 42, at 116; see also Bryan Day, Labor Pains: Why Contraction Is Not the Solution to Major League Baseball’s Competitive Balance Problems, 12 FORDHAM INTELL. PROP. MEDIA & ENT. L.J. 521, 572 (2002) (“It is worth noting that in the three seasons in which the luxury tax was in effect the tax had no discernible impact on the growth of player salaries.”).
69. Mark Maske, Orioles to Pay Most in Luxury Tax, WASH. POST, Jan. 9, 1999, at D8.
70. See supra note 62 and accompanying text.
71. 1997 MLB CBA art. XXIII, reprinted in Moorad, supra note 50, at 5-104.
72. 2002 MLB CBA, supra note 6, art. XXIII, at 78.
73. Id. art. XXIII, B(2), at 80. According to Professor Andrew Zimbalist, the owners’ initial proposal was for a threshold beginning at $98 million taxed at a rate of 50%, while the players countered with a threshold of $137.5 million taxed at 15%. Zimbalist, MAY THE BEST TEAM WIN, supra note 2, at 111.
74. 2002 MLB CBA, supra note 6, art. XXIII, B(3)(a), at 80.
75. In 2004 and 2005, a first-time tax threshold violator will be assessed a 22.5% tax on its overage. Id. art. XXIII, B(3)(b), at 80. For second-time offenders, the tax rate will be 30%, while the rate for a third-or fourth-time offender is 40%. Id. art. XXIII, B(3)(c)-(d), at 80-81. To round out the system, a first-time offender in 2006 is not assessed any tax, while a team above the threshold in 2006 but not in 2005 also avoids any penalty. Id. art. XXIII, B(3)(b)-(c), at 80.
76. Id. art. XXIII, H(1), at 99. This section also allows for an additional $5 million to be dedicated for the same purpose should the parties to the agreement agree to this adjustment. Id.
77. Id. art. XXIII, H(2), at 99.
78. Id. art. XXIII, H(3), at 99.
79. Id. art. XXIII, H(4), at 100.
80. Murray Chass, Marlins Rebuild, but Uncertainly, N.Y. TIMES, Jan. 10, 1999, 8, at 8 (saying that “the tax hasn’t worked”); Tom Haudri-court, Tax Provides Little Luxury: Product of Labor Dispute Fails to Curb Spending, MILWAUKEE J. SENTINEL, Jan. 17, 1999, at Sports 15, available at 1999 WL 7652912 (“The tax… is a joke.”). Respected baseball writer Bob Verdi referred to the baseball luxury tax as “flimsy” and “annoying” at best. Bob Verdi, Falling in Love Again with the Old Pastime, CHI. TRIB., Oct. 26, 2003, 3, at 13.
81. Bill Shaikin, Rich Tradition: Yankees’ Uncanny Ability to Make Money and Spend on Talent Cuts into the Attempts at Parity, L.A. TIMES, Apr. 1, 2004, at D1.
82. Ross Newhan, Start Spreading the Payroll Blues, L.A. TIMES, Nov. 13, 2002, at D1.
83. See Richard Justice, Finally, NBA Reaches Its Own Labor Day, WASH. POST, Sept. 5, 1995, at C1 [hereinafter Justice, NBA Reaches]. Justice says sources told him that former NBPA chief Charles Grantham “was forced out because of alleged questions regarding his handling of his expense account [while o]ther sources said players didn’t like the slow pace of negotiations, they didn’t like the strike talk and they didn’t like the fact that no new agreement was in place.” Id.
84. Grantham was replaced by Simon Gourdine, a former NBA deputy commissioner who had joined the union in 1990. See John Helyar, Pro Basketball Loses Its ‘Feel Good’ Image in Nasty Labor Dispute, WALL ST. J., Aug. 7, 1995, at A1 (documenting summer of discontent between NBA and NBPA in 1995). Gourdine proceeded to negotiate a deal with the league that included a luxury tax. Richard Justice, NBA Owners Prepare for Lockout, WASH. POST, June 30, 1995, at B8. When the majority of players, largely left uninformed as to the specifics of Gourdine’s negotiations, were let in on the terms of the deal, they were outraged. See Mark Asher, Jordan, Ewing Join Class-Action Lawsuit, WASH. POST, June 29, 1995, at B6 (describing actions of several star players trying to overturn new collective bargaining agreement agreed to in principle by union); Jackie MacMullan, Players Suing NBA, BOSTON GLOBE, June 29, 1995, at 39 (quoting former New York Knick and NBPA President Patrick Ewing as saying, “The deal the union accepted was not a fair deal”). The agreement allowed teams to continue exceeding the Team Cap, but, beginning in the third year of the deal, a team exceeding the cap would be assessed a “luxury tax”—a 100% tax for every dollar of a free agent contract that was raised over the final year of the previous deal by more than 10%. Justice, NBA Reaches, supra note 83. For example, “if a team wanted to sign a player making $1 million to a new contract at $2 million, it would have to pay the league another $900,000.” Id.
In response toe deal Gourdine originally negotiated, some players began a movement to decertify the NBPA under the theory that labor law would no longer apply to the bargaining relationship if there were no union representing the players, thereby opening up the NBA to potential antitrust violations. See Marc J. Yoskowitz, Note, A Confluence of Labor and Antitrust Law: The Possibility of Union Decertification in the National Basketball Association to Avoid the Bounds of Labor Law and Move into the Realm of Antitrust, 1998 COLUM. BUS. L. REV. 579, 596-99, 611 (detailing unique factors of potential decertification within realm of professional sports). The pressure applied by these players resulted in Gourdine returning to the bargaining table, which in turn, led to the failure of the decertification movement. Id.; Justice, NBA Reaches, supra note 83.
85. Murray Chass, N.B.A. Owners Settled Rather than Risk More, N.Y. TIMES, Aug. 10, 1995, at B11; see Mark Asher, NBA, Union Beat Deadline with New Deal, WASH. POST, Aug. 9, 1995, at C1 (describing owners’ capitulation on luxury tax after players’ strong opposition to provision in summer’s first tentative deal); Anthony Bianco, David Stern: This Time, It’s Personal, BUS. WK., July 13, 1998, at 114, 116 (“In the end, it was [NBA Commissioner David] Stern who blinked, recommending that the owners accept a new contract that… scuttled the luxury tax.”).
86. The 1995 NBA collective bargaining agreement originally had a six-year term, although the NBA had the right to reopen negotiations if the players’ share of BRI exceeded 51.8%. NBA Collective Bargaining Agreement, Sept. 18, 1995, art. XXXVIII, 2(a), at 185.
87. Mark Asher, Lockout Issues Began Long Time Ago; Players Union, NBA Owners Have Not Met Face-to-Face in 23 Days, WASH. POST, July 15, 1998, at C6.
88. Weiler, supra note 42, at 107.
89. See Dworkin & Posthuma, supra note 8, at 244 (stating that 437 games were missed due to lockout).
90. See supra Part I.B.2.
91. Frank Swoboda, This Round May Go to Owners, WASH. POST, Jan. 8, 1999, at C5.
92. It should be noted that the players presented their own version of the luxury tax; had it been implemented, it would have had little or no effect on team spending. The NBPA proposed to tax individual salaries above $18 million, which would only affect a handful of players. See Mike Wise, N.B.A. Is Canceling Its First Two Weeks, N.Y. TIMES, Oct. 14, 1998, at A1.
93. This is the closest thing to an official name for the system, although there is no formal equivalent to MLB’s Competitive Balance Tax. The luxury tax—called “Team Payments” in the agreement—is tucked away under section 12(g) of article VII, which is entitled “Escrow Arrangement.” While most of section 12 deals with the Escrow piece of the regulatory system, there is no “escrow” component to the luxury tax other than that it kicks in when the escrow account has been depleted. See infra notes 96-99 and accompanying text.
94. 1999 NBA CBA, supra note 29, art. VII, 12(d)(1), at 128-29. A Projected Overage is the forecasted amount by which players’ salaries and benefits will exceed the Escrow Threshold. Id. art. VII, 12(b) (14), at 127.
95. The current NBA CBA calls for the designated compensation adjustment percentage to be 55% in years 2001–2002, 2002–2003, and 2003–2004, and 57% in 2004–2005. See id. art. VII, 12(c)(3), at 128. This Note will operate on the basis of the 2001–2004 figure.
96. Id. art. VII, 12(c)-(d), at 128-30. For example, after the 2001–2002 season, players’ salaries and benefits were approximately 59.8% of league revenues, which did not require the full 10% Escrow. Chris Sheridan, Arbitrator Rules in Favor of NBA, Associated Press Online, Sept. 25, 2002, available at http://global.factiva.com (on file with the COLUMBIA LAW REVIEW) (noting that, of $154 million collected, approximately $23 million was returned to players). Therefore, not only was the luxury tax portion of the Escrow arrangement dormant, but the players were eligible to receive back some of their escrowed salary money as well. In addition, for the “transition” season into the Escrow and tax arrangement, the NBPA negotiated for a payment to the players should BRI and benefits not increase over the prior year by at least $50 million. 1999 NBA CBA, supra note 29, art. VII, 2(d)(7), at 75.
….
100. Mark Asher, NBA Calls Off Meeting with the Players’ Union: Cancellation of Entire Season Looms Larger, WASH. POST, Nov. 26, 1998, at B1.
101. 1999 NBA CBA, supra note 29, art. VII, 12(g)(1), at 135.
102. Id. art. VII, 12(h)(1), at 135-36.
FOOTBALL MAY BE ILL, BUT DON’T BLAME BOSMAN
William Duffy
I. INTRODUCTION
… European football (soccer) has experienced a fundamental shift in the employment relationships between players and their clubs. Traditionally, the power of employment resided firmly with the national associations and private clubs, with the players having a relatively weak union and (with very few exceptions) little to say about their careers. That balance of power began to shift when Jean-Marc Bosman, a midfielder from the Belgium team RC Liege, attempted to transfer to the French team US Dunkerque in July of 1990. Although Bosman was no longer under contract, his Belgian employer demanded compensation (a so-called “transfer fee”) from the French club with which he wished to sign, and refused to allow Bosman to play until payment was received.
Bosman subsequently sued RC Liege, the Belgian Football Association (URBSFA), and the Union of European Football Associations (UEFA), alleging that the rules governing the transfer of players among clubs in the Union were unfairly restrictive…. The specific issue was whether the rules regarding the movement of players from between clubs and the rules governing the number of foreign players allowed to play for a team during a match were in violation of the European Community Treaty.
After a protracted and complex legal battle that effectively ended Bosman’s playing career, the E.C.J. [European Court of Justice] agreed with Bosman and found the transfer rules to be in violation of the European Treaty. The Court ordered the Federation Internationale de Football Associations (FIFA), UEFA, and the national football organizations of every member state to implement fundamental changes in the way they administer the movement of players between clubs within the European Union. As a result of Bosman’s lawsuit and the ruling that bears his name, football players in Europe today enjoy a great deal of professional freedom.
….
II. THE FACTS OF MR. BOSMAN’S CASE
A. The Structure of Football: Organization, Transfer of Players, Restrictions on Foreign Players
1. The Organization of Football
The structure of football clubs, leagues, and associations is basically the same world-wide. Organized amateur and professional football is played under a structure called an “association.” In order to participate in international competition, clubs and leagues, as well as the national associations that govern them, are required to conform to certain guidelines prescribed by regional international confederations (in the case of Europe, the UEFA). Each level of the structure is afforded a certain amount of responsibility for the administration of the game. At the base, each club is responsible for its players. In order to be eligible for a match played by his club, each professional player must be registered as a professional with his national association. As a registered professional, the player is considered an employee of the club which holds his registration.
National associations are comprised of clubs playing organized competitions within the nation’s borders. These associations organize league competitions and national knock-out cup competitions, and administer the national team. The associations also draft the regulations by which the game functions….
The regional confederations comprise the membership of the international organizational body known as FIFA. The regulations of the regional confederations are subject to the approval of FIFA….
2. The Transfer Rules: Belgium, UEFA, and FIFA
… The FIFA rules were important to Bosman, in that they expressly stated that the registration of players in national associations (which made the player eligible for competition) was dependent on the release and receipt of the player’s professional registration certificate. While the rules stated that the out-of-contract player could not play until his certificate was received, they did not state that the former club would be required to release the player’s certificate once a new contract had been reached between the player and the new club. Thus, the former club effectively retained control over the player’s career. This issue led Bosman to sue RC Liege.
3. Restrictions on Foreign Players
… The rules regarding participation in national competitions by foreign players were, until the Bosman ruling, deliberately restrictive. As stated in Advocate General Lenz’s opinion, “(f)rom the 1960s on, many—but not all—football associations introduced rules restricting the possibility of engaging players of foreign nationality.”31 … UEFA introduced a rule in 1991 that fixed the number of foreign players allowed to play in a UEFA sanctioned match. The rule, which became known as the “3 + 2 Rule,” required that teams limit the number of foreign players included on the team sheet for any one match to three, plus two additional foreign players who had played professionally in the host country for a period of five uninterrupted years, including three years in junior teams.
The abolition of the 3 + 2 rule by the European Court of Justice in the Bosman decision has impacted football at least as much as the abolition of transfer fees. Its impact is seen in the increased availability of movement for all players within UEFA. It is curious that the abolition of the foreign player restriction does not receive as much attention as the transfer fees rules.
….
III. THE OPINION OF THE ADVOCATE GENERAL AND THE RULING BY THE EUROPEAN COURT OF JUSTICE
A. The Opinion of the Advocate General
1. The Transfer Rules
In his advisory opinion to the European Court of Justice, Advocate General Lenz found the transfer rules to be “a direct restriction on access to the employment market.” The Advocate General stated, “the transfer rules are in breach of Article 48, and would be lawful only if they were justified by imperative reasons in the general interest and did not go beyond what is necessary for attaining those objectives (emphasis included in original text).”47 One such “imperative reason in the general interest” that was advanced during litigation, according to the Advocate General, was the protection of the financial and sporting equilibrium necessary to preserve the balance between competing clubs.48 It was argued that because clubs are compensated for players moving from club to club, money remains circulating within the game, and that it is more efficient for teams to exchange cash for players, rather than players for players (i.e., a barter system, as exists in the United States professional sports leagues). This compensation was alleged to be necessary for the survival of small clubs, who reap big rewards for selling their prized assets.
For the purpose of maintaining the financial and sporting equilibrium, the Advocate General found the transfer rules to be an inadequate measure, and therefore still unlawful under Article 48. The transfer rules, he said, often force small clubs to sell their best players to generate income for their survival as entities.51 While this certainly generates revenue for the club, it significantly weakens the club on the playing field. The movement of the best players was decidedly one way, as the small clubs were not in the financial position to lure players from the wealthiest clubs. Finally, since only the wealthiest clubs could afford the transfer fee to begin with, less wealthy clubs could seldom enjoy the benefit of the transfer fee arrangement. This further weakens the argument that it was necessary to maintain the sporting and financial equilibrium.
….
Besides maintaining the sporting equilibrium among clubs, Advocate General Lenz addressed (and refuted) the argument that transfer fees were necessary to compensate clubs for the cost of training players that are eventually sold to other clubs. The Advocate General found this argument invalid based on two main points: the fee is not calculated according to the club’s investment in the player, and applies to all players.59
The transfer fee’s calculation, by its nature, does not account for the amount invested by a club in training a player, but is instead tied to the player’s salary….
Second, the clubs demand a transfer fee when selling established professional players as well as new players….
2. The Restrictions on Foreign Players
In his opinion, the Advocate General stated,
No deep cogitation is required to reach the conclusion that the rules on foreign players are of a discriminatory nature. They represent an absolutely classic case of discrimination on the ground of nationality…. The rules on foreign players are therefore incompatible with the prohibition of discrimination under Article 48(2), in so far as they relate to nationals of other Member States.62
UEFA tried to argue that the rule was not actually in violation of the Article, however, because the restriction was only against the number of foreigners who could play in a match, and not against the number that could be employed by a particular club. The Advocate General was not persuaded by this argument, because the purpose of employing a football player is to actually play him in a match. He reasoned, therefore, that because a club would be limited in the number of foreign players it could use in any one match, the club would not hire more foreign players than it needed, thus restricting the opportunities for players to move freely about the European Union.
This is a rather important part of the decision, but it receives far less attention than the transfer rules, though it arguably has a similarly prominent place in the economics of the sport following the ruling. This part of the decision effectively deepened the pool of football talent available to clubs. In effect, the shopping market for all clubs became exponentially larger than it had been before Bosman. As such, the clubs with money to spend could buy foreign players that they may have previously refrained from buying because they did not have space in their starting eleven. As a result of the Court’s decision, the supply of players increased. Along with the increase in supply, should a decrease in the amount clubs are willing to pay for players be expected? Whether or not that is the expectation, it clearly has not happened. Although the supply of players increased, demand for their services also increased. From the player’s point of view, the number of potential employers also increased following the Bosman decision. For the best players, that means more suitors who might view them as attractive investments. As such, the clubs who can afford to pay out large sums of cash have driven the cost of the best players higher, taking them out of the reach of more modest clubs. At the same time the clubs increased the value of merely mediocre players. The effect of this has been to concentrate the quality of players at the top of the economic pyramid….
B. The Ruling by the European Court of Justice
1. The Transfer Rules
The ruling of the European Court of Justice, with regard to Article 48 and the transfer rules, states:
Article 48 EEC precludes the application of the rules laid down by sporting associations, under which a professional footballer who is a national of one Member State may not, on the expiry of his contract with a club, be employed by a club of another Member State unless the latter club has paid to the former club a transfer, training, or development fee.64
In its brief discussion, the court essentially agreed with the points made by the Advocate General, namely that no justification put forward by UEFA, URBSFA, or any national association would allow the existence of the restriction on the movement of football players within the European Union.
2. The Restrictions on Foreign Players
With regard to the restrictions on the number of foreign players allowed to play in any given match between clubs sanctioned by UEFA, the European Court of Justice ruled that those rules were also precluded by Article 48.65 As such, the restrictions on the limitations regarding foreign players were abolished.
IV. THE EFFECTS OF THE BOSMAN RULING
A. The Lawsuit Within the Economics of the Game
It would be inaccurate to describe the Bosman case as the only economic turning point in football since 1996. In reality, the Bosman ruling exists within a larger context. Football’s explosive growth began in the early 1990s, when some of the bigger leagues in Europe aggressively began to sell television rights as a commodity. The traditional source of revenue for clubs, gate receipts, was becoming marginalized even as early as the 1980s. Television rights, sponsorship deals, and savvy marketing were on their way to replacing gates as the main source of income…. The gap between rich clubs and poor clubs, part of the argument in favor of transfer fees, was demonstrated by the distribution of this income: three-quarters to the first division clubs, one-eighth to the third and fourth divisions combined…. Clearly, football was changing, whether Bosman brought his lawsuit or not.
B. Arguments Against the Lawsuit
In their 1998 article, The Impact of the Bosman Ruling,69 Gardiner and Welch addressed concerns that Bosman, fairly or unfairly, could become “a scapegoat, for all the perceived ills in the game, such as the problems that some club managers report in exerting discipline over star players who earn more than they do even when not being selected for first team football.”70 Although they acknowledge that Bosman may or may not have been the actual cause of “the big money circulating in the upper echelons of the game,”71 … they argue that Bosman’s lawsuit effectively attacks the co-dependent nature of the football leagues, and furthers the commercialization of the game. They further argue that the lawsuit broke down an invisible barrier between sport and society by needlessly introducing the societal instrument of law into what amounted to an internal disagreement between an employee and employer. In their own words:
There is a need for competition and although this may be keen on the field, the clubs are dependent on each other to a much greater extent than in other businesses. Therefore, until now, there have been collective interests between clubs not to allow free market principles to operate so that the top clubs buy all the best players. An issue of ongoing major concern for football clubs and supporters alike which has been facilitated, if not created, by Bosman is the way that the top clubs no longer appear to regard themselves bound by the collective interest as they look for ever greener pastures anew, such as the European Super League…. The attack on the transfer system in football can be seen as a classic battle concerning the legitimacy of intervention in particular sectors of industry and employment…. The partial removal of the transfer system that Bosman represents increases the view that football is no longer intrinsically and essentially a sport, but merely a product to be consumed…. As football has increasingly become subject to this process of commodification, so juridification has operated as a concomitant process. The intervention of the law into new areas of social life, and in this case, “sporting arenas” modifies what are intrinsically social relationships between humans within a “social field….” The football industry has been adept in the past in insulating itself from the impact of legal regulation. However, Bosman exemplifies this process: the system of transfer of players has historically primarily been seen as determined by the football authorities; now it is one primarily determined by law.72
There are two general points upon which I disagree. First, the commodification of the game, which the authors claim was exacerbated by Bosman’s lawsuit, was happening regardless of the lawsuit. This was evidenced by the influx of money into the game via television rights deals. Second, in linking the commodification and juridification of the game, the authors seem to suggest that Bosman was somehow wrong to go outside of the authorities of the game for relief from his employer, as if he should have considered the deleterious effects upon football that his personal relief would have brought.
These are the primary anecdotal arguments used against the Bosman ruling in general, and against Bosman himself, by his and the ruling’s detractors. The arguments suggest that Bosman is to blame for dragging football down to the same level as society and that his lawsuit helped entrench the sharp claws of capitalist and consumerist power into the game. The commodification argument is particularly ironic, since Bosman’s lawsuit was arguably the classic worker’s struggle against a repressive system of employment. The transfer system, after all, was designed by a cartel of employers living off the exploitation of the working class.
To place Bosman in the same category as television rights and kit sponsorships, and to call him equally responsible for the disproportionately large sums of money being traded between rich clubs and an elite mix of mercenary-like players places blame where it simply does not belong. There are serious issues of causation to consider: did Bosman start the trend, or was the trend towards commodifications well underway before he brought suit? Gardiner and Welch claim that Bosman was a reflection of the financial pressures of the game. They say that clubs were looking for legal ways to purchase the greatest number of the most highly skilled players available.73 They assert that players were seeking to increase their bargaining power before the Bosman decision. To include Bosman in this category of players is fundamentally wrong. Bosman was not trying to increase his bargaining power; he was trying to earn a living in his chosen profession. Bosman simply argued that he was being prevented from doing so by his former employer, in direct violation of European law.
C. Ramifications of the Lawsuit on the Game
Without the restrictions of transfer fees or limitations on the number of foreign players that a team may have, players are more free to move from club to club and league to league. Clubs are now more inclined to offer longer contracts, thus making it more likely that they will be able to secure a fee of some kind when it comes time to sell a player. As a result, players are in a much stronger bargaining position when negotiating their contracts with clubs. All players are free agents once their contracts have expired. However, a select few players are effectively free agents even while under contract, because their exceptional skills are in such demand.
Since the Bosman decision took effect, players have acquired the power to demand and extract transfers in a way that would have been unthinkable before the lawsuit. Players who are unhappy with a club’s management, who think that their club does not have a realistic chance of winning a title or trophy, or players who are simply bored or petulant, now have the leverage to demand to be transferred without fear of repercussion as long as they are skilled enough as players.
….
Not surprisingly, the national footballing organizations of Europe have come together to solve what they view as a problem that could undermine the game…. The organizations agreed in December 2001, to set up two transfer “windows” per year, one each in summer and winter, to limit when clubs may buy and sell players. The hope is that the windows will add some stability to a system that is perceived to be out of control. By making it impossible for all players to move outside of the windows, clubs hope to remove the incentive for players to demand transfers in the middle of a season. An obvious flaw in that reasoning, however, is that players who demand transfers may simply … sit out until the next window allows them to leave.
With regard to the second half of the Bosman ruling, an interesting result of the abolition of foreign players has been what I call the “cosmopolitization” of clubs. Before Bosman, eight (sometimes six because of the “3+2 Rule”) of the eleven players on the pitch were of the club’s nationality. So, for example, a German team would have eight Germans. The rules defining a “foreign player,” however, were set by the national associations. In England, for example, a player from any of the “Home Countries” counted as “domestic.” An English team could include any British citizen, as well as those of the Republic of Ireland. Today, however, clubs can, and do, field any combination of players, from all over Europe and the world. Some complain that the importation of foreign players into the highest leagues in their respective countries inhibits the development of youth talent to the detriment of their national team. They blame this on the limitation of first team action for citizens of the home country.
Whether this is true or not should be the subject of another study….
V. WHY BOSMAN IS NOT TO BLAME FOR THE POOR STATE OF THE GAME
The timing of Bosman’s case was particularly important, given the fact that football began an economic boom at about the time he initiated his litigation. Despite the apparent economic rebirth of the game, however, all is not well. There is legitimate criticism that only a very few of the hundreds of clubs in Europe have actually benefited from the explosive growth in the game, and that the money now flowing freely has caused the game to lose touch with its working class roots. Bosman is frequently faced with criticism that his personal greed resulted in the explosive growth in players’ salaries and that he has changed the game forever. Although Bosman makes an attractive target, especially for club owners and chairpersons, this attack on him is disingenuous in that it seeks to shift the blame for the current rot in the administration of the game.
….
While one exceptionally bad deal does not necessarily represent the entirety of the business, it does illustrate the point that Jean-Marc Bosman’s impact upon football in Europe must be examined in a larger context.
Bosman represents an opportunity for those in positions of authority to deflect criticism from where it really belongs—on them. Bosman never made a policy decision that had wide ranging implications for the game. Bosman never negotiated a television rights deal, a kit sponsorship deal, or even a player transfer (his own transfer was voided when RC Liege failed to release his player’s certificate). Bosman never offered an inflated contract to a young player (or a highly skilled player for that matter), nor did he refuse to field a skilled player under contract without explanation. Bosman never had the opportunity to exercise complete control over an entire group of young men’s careers. Bosman was not responsible for the decline in conditions at the football stadia, nor for any other reason that the supporters left the game in droves in the 1980s.
Notes
31. 1 CMLR 645, P 37, at 662.
47. Id. P 212, at 728.
48. Id. P 218, at 730.
51. Id. P 226, at 733.
59. Id. P 237, at 737.
62. Id. P 135, at 693.
64. Id. Ruling 1, at 778.
65. Id. Ruling 2, at 778.
69. 3 [1998] CIL, no. 4, 289–312.
70. Id. at 309.
71. Id.
72. Id. at 307–08.
73. Id. at 303.
Discussion Questions
1. Why does the public tend to support management over labor during sports work stoppages?
2. What are the inflators and deflators of player salaries?
3. Is it more appropriate to compare athletes’ compensation to popular entertainers or to CEOs and business leaders?
4. Are professional athletes overpaid? Explain.
5. Explain the relationship between ticket prices and player salaries.
6. Are there potential downsides for teams if athlete compensation shifted to an incentive-based model?
7. Does athlete performance have a direct or indirect impact on wins? Direct or indirect impact on profits? How do those answers affect decisions on incentive-based compensation, if at all?
8. What league has the most restrictive system of free agency? The least?
9. If the offers that a party makes during negotiations are an indication of its belief of the player’s value, why are they inadmissible as evidence during the salary arbitration hearing?
10. How are small-market clubs disadvantaged by salary arbitration?
11. Should a party be able to discuss its financial situation in a salary arbitration hearing? Why or why not?
12. When considering incentive-based player contracts, how can management ensure that it is incentivizing the kind of performance that will actually lead to team success?
13. What does your knowledge of the reserve system, salary arbitration, and the performance of free agents in MLB tell you about the optimal method of building a club?
14. Design an athlete compensation framework that best balances the interests of both owners and athletes.
15. Should teams create negative-compensation incentives for poor play (such as missed shots, strikeouts, etc.)?
16. What offers the fullest pictures of a player’s performance: statistical metrics or “eyeball” scouting?
17. If “box score statistics” are overvalued in sports, what kinds of performance are undervalued?
18. What is the next frontier of player evaluation (after scouting and statistical evaluation)?
19. Is there a way to more effectively predict injury risk in player evaluation and compensation decisions?
20. Where are the inefficiencies in player evaluation and compensation today? Apply this question to the four major sports.
21. Can statistical modeling accurately assess player performance in sports like soccer, basketball, etc. where individual performance is interdependent with the play of several teammates?
22. Do you agree with Gerrard that technology can effectively deal with the tracking, attribution and weighting problems when evaluating players in an interdependent sport?
23. Healy says, “Performance and pay are easily measured” in MLB. In light of the other readings in this chapter, do you agree?
24. How should teams properly assess a player’s most recent performance that is either significantly better or worse than how he has performed in the past?
25. Is past performance an accurate predictor of future performance? What other factors should teams consider when making evaluation and compensation decisions?
26. What was the primary problem with the NHL’s arbitration process—too few settlements between management and labor, or salaries escalating to unsustainable levels? Does the NHL’s new CBA solve these problems?
27. Should the NHL and MLB consider offering earlier free agency to their players in exchange for eliminating the arbitration process altogether?
28. Can a luxury tax system be effective if few (if any) teams pay the tax?
29. What are the advantages and potential disadvantages to the NBA’s luxury tax system, as compared to the MLB system or other leagues with different cost containment mechanisms?
*The higher NFL salary level may have represented the lingering effects of the bidding war between the National Football League and the American Football League earlier in the 1960s. The two leagues agreed to merge in 1966, a merger that required Congressional approval. This episode is not discussed here because NFL salary level information is not available before 1967. However, there is strong anecdotal evidence of a bidding war between the two leagues over college stars such as Joe Namath.
†Deceleration of the growth of NFL television revenues from nearly 30 percent per year from 1981 to 1985 to just 2.6 percent annual growth from 1985 to 1988 could also have explained the deceleration of salaries after 1985. However, it is also true that attendance in the NFL picked up from 1985 to 1988, rising 1.5 percent, in contrast to the 2 percent fall from 1981 to 1985. Quirk, James and Rodney D. Fort. 1997. Pay Dirt: The Business of Professional Team Sports. Princeton, NJ: Princeton University Press
*In the 1974 and 1975 seasons, many players were eligible for salary arbitration, but without free agency, arbitration alone seemed to have little impact on average salaries, because arbitrators are often entitled to compare players’ demands and team offers to the salary levels of free agents. Using fixed effects methods on panel data for individual players for the late 1980s, I found that, other things equal, being eligible for the salary arbitration increased players’ salary by about 30–45 percent. See Kahn, Lawrence M. “Free Agency, Long-Term Contracts and Compensation in Major League Baseball: Estimate from Panel Data.” The Review of Economics and Statistics. 75:1, pp. 157–64.
†The low relative levels of exploitation for the free agency eligible suggest that in the free agent market, teams may have been affected by the “winner’s curse.” ….
*As an extreme example of such effects not captured by the revenues of the player’s home team, Hausman and Leonard estimate Michael Jordan’s value to other NBA teams during the 1991–92 season to be roughly $53 million. This consisted of effects on attendance at away games, television ratings, and merchandise sales. Hausman, Jerry A. and Gregory K. Leonard. 1997. “Superstars in the National Basketball Association: Economic Value and Policy.” Journal of Labor Economics. 15:4, pp. 586–624.
†Labor supply effects also appear in men’s professional tennis. The Association of Tennis Professionals (the governing body of the men’s pro tour) decided several years ago to consider just a player’s results in the most recent 14 events in which [he has] competed in computing his ranking, which affects his seeding and therefore success probability in future tournaments. For example, in 1999, one player was ranked first in the world for part of the year, despite a string of first round tournament losses. These did not count in his ranking point total, and observers surmised that he would have entered fewer tournaments (and thus conserved his energy) if the costs of losing were higher. Because of these poor incentives, the Association of Tennis Professionals (the ruling body of men’s tennis) has instituted a new system which will count in a player’s ranking a core set of tournaments, whether the player plays in the tournament or not, and then some other tournaments as well. See the ATP’s Web site at (http://www.atptour.com).
*See Etan Vlessing, A Salary Cap: The NHL “Doesn’t Have a Choice,” AMUSEMENT BUS., July 31, 2004, at Up Front.
†2002–03 URO, supra note 27