
CHAPTER ELEVEN
INTRODUCTION
Whether for a prospective sale, a bankruptcy, or leveraging debt, at various times it is necessary to place an accurate value on a sports franchise. As this chapter reveals, valuation of professional sports franchises is no simple task. As evidenced by the numerous sales of both established and expansion teams in the four major North American sports leagues and clubs in many European soccer leagues for seemingly ever-increasing amounts of money, the market for professional sports franchises continues to be robust. Although the study of firm and asset valuation has been a common area of research in finance, there has been little application of these principles to professional sports franchises.
Valuation of professional sports franchises is much different than valuations of most other assets. This is likely because of the idiosyncratic nature of sports franchises, which are somewhat comparable to the valuation of art in that, ultimately, beauty is in the eye of the beholder. Thus, there is significant volatility in the marketplace. The total financial return to owners of professional sports franchises is determined by calculating a team’s profitability and capital appreciation. Although the franchise’s ability to earn a profit and its likelihood of increasing in value in the long term play important roles in determining a team’s present value, numerous other factors impact franchise value.
The nature and quality of a team’s facility arrangement is one factor. Given the increase in the number of new, revenue-generating facilities in the last 15 to 20 years, it is important to gauge the impact that these stadia and arenas have on franchise values. The building boom that has occurred since the late 1980s has resulted in new or renovated stadia for most of the teams in the four major North American sports leagues. Globally, European soccer clubs are still in the early stages of the stadium construction era. The presence of a playing facility with a lease arrangement that allows the team to generate and retain significant revenues from luxury boxes, club seats, signage, naming rights, concessions, parking, and outside events at a low cost (i.e., little rent) will drive franchise values upward. The absence of such an agreement will have the opposite effect.
In addition, a team’s media contracts impact its value. The size of the league-wide television contract provides guaranteed revenues to each team and indicates the nationwide popularity of the sport. However, the size of the local television contract secured by a club varies greatly. The local television contract provides a team with revenue that is largely unshared and is an indicator of a team’s popularity in its home market. Increased involvement of teams in the ownership of regional sports networks not only provides the opportunity for a team to dramatically increase revenues earned from local broadcasting, but it also provides the team owner with a valuable asset against which capital can be raised. Therefore, a team’s national and local television contracts are important factors in determining the team’s value. Global media contracts are a possibility for some of the biggest European soccer clubs, which provide them with a revenue stream that is unavailable to their North American counterparts due to the more restrictive league rules regarding global broadcasting found domestically.
The league in which a franchise plays impacts its value in several ways. As previously mentioned, the league’s national broadcasting contract guarantees revenue to the franchise. Second, the league’s revenue sharing agreement can either enhance or hinder the value of its franchises. A league with a high degree of revenue sharing can ensure the long-term viability of its franchises by guaranteeing them monies every year and protecting them against a shortfall in nonshared revenues in any particular year. However, this may harm the short-term value of franchises that generate significant amounts of revenue by redistributing their wealth to other franchises. The lack of a meaningful revenue sharing plan in European soccer leagues can either help or hinder the value of a club depending on its ability to generate revenues on its own.
A league’s collective bargaining agreement with its athletes can affect the value of its franchises. A settled labor situation with a mechanism for control over player compensation benefits owners by providing them with an assurance that their revenue-generating games will continue to be played. A mechanism for controlling player compensation is vital in that, similar to most businesses, a sports franchise’s ability to predict and control its costs is a very important aspect of its operations. The single greatest cost to professional sports franchises is player salaries; a salary cap provides a team with a degree of cost certainty by dictating the amount of money that it can spend on athlete compensation. Although loopholes and exceptions to these salary-containment systems have somewhat eroded their benefits, they still enhance team values. It follows then that the legal prohibition of cost containment mechanisms in European soccer leagues inhibits the value of most of the clubs.
The debt accumulated by a team also requires consideration. Team debt typically arises when an owner purchases a team and when the team must pay for part, or all, of the construction costs of a new facility; this obligation may be onerous and can ultimately cause the transfer of a team for a lower cost. It is for this reason that it is often better for a sports franchise to lease rather than own its playing facility, especially if the lease terms are advantageous. A team’s debt is often guaranteed by a revenue stream accruing from its facility. This negatively affects a team’s cash flow because the revenues that would otherwise be used for team operations must be utilized to service the debt. In an attempt to protect its members, each league has enacted rules that limit the amount of debt that can be accumulated by a team. However, these debt limitation rules have numerous exceptions and are rarely enforced. Again, the contrast with European soccer leagues is striking. A number of European clubs have amassed stifling amounts of debt due to the run up of franchise acquisition costs, facility-related costs, and player acquisition and salary costs.
Table 1 Forbes Franchise Values as of January 2010
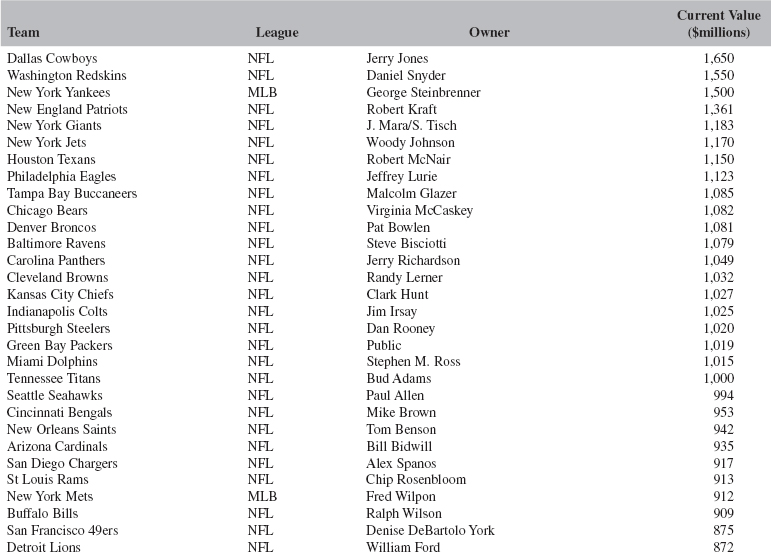
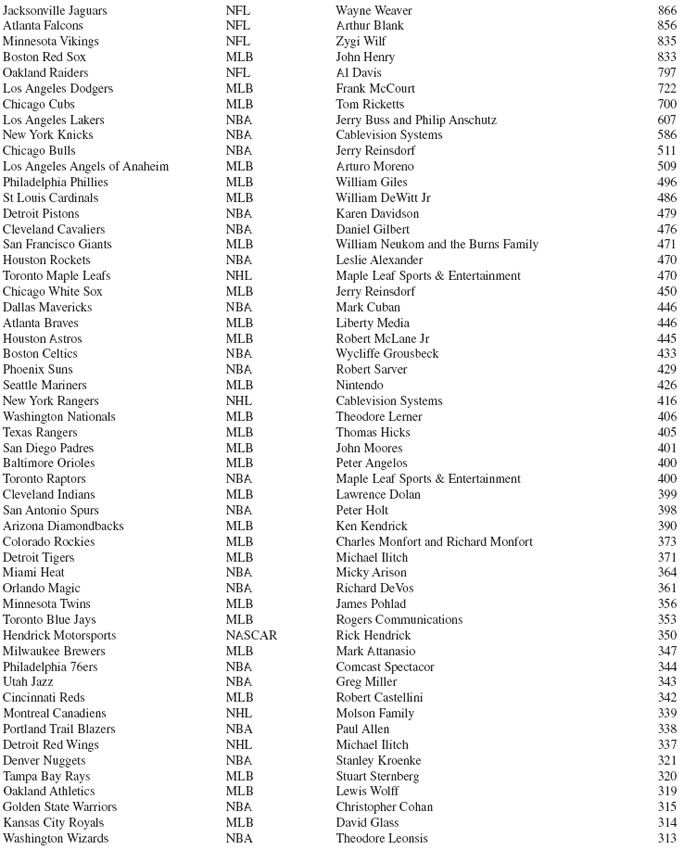
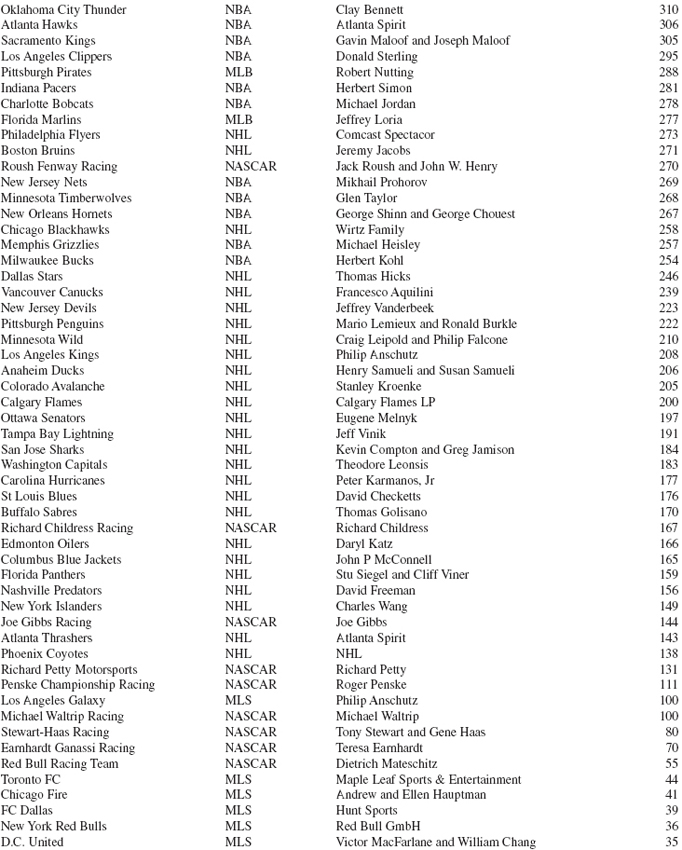
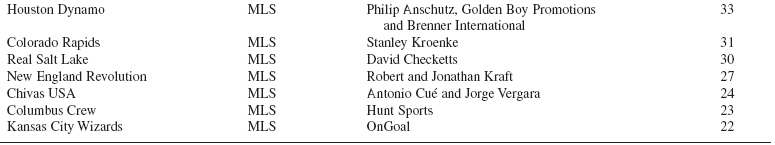
Source: Forbes.
The tax benefits associated with ownership of professional sports franchises have an impact on value, as well. (See Chapter 1 for further discussion of this topic.)
The real estate value of the sports franchise must also be considered. A real estate developer may purchase a sports franchise as part of a larger development scheme upon which profits can be realized, even if the team itself may suffer operating losses. This will increase the transfer price of the franchise. The nature of the seller will affect team value as well. A corporate owner typically must sell the franchise fairly quickly in order to appease analysts or shareholders, whereas an individual owner, realizing the significant consumption value associated with team ownership, must be compensated for the loss of the psychological premium that team ownership brings. Consequently, an individual owner is less likely to sell the team with any degree of urgency and can thus afford to “hold out” until obtaining the desired price. Thus, the purchase price of a team sold by a corporation may be lower than a comparable franchise sold by an individual.
The quality or reputation of a team as measured in terms of its win–loss record also may impact value, as may the value of its brand. Although seemingly irrational due to the cyclical nature of sports, a team’s recent performance record may factor into the valuation equation. A team’s brand may come into play and enhance the franchise’s value if the team is one of the handful of “trophy” teams in both the North American and European soccer leagues that resonate well beyond their home market.
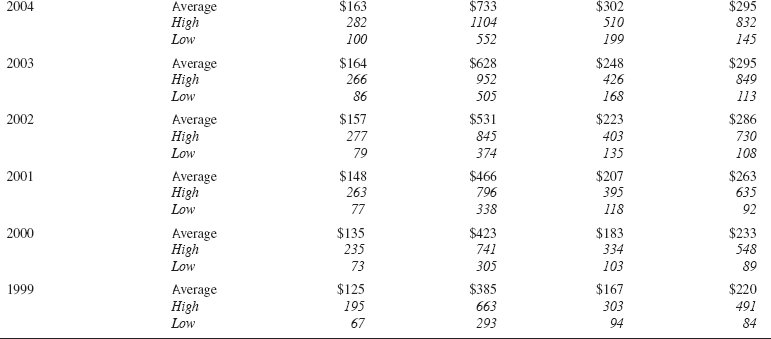
*Except for sales occurring in 2001, represents the percent change from last close in January in the year of the prior sale to the last close in December of the sale year.
**Expansion fee
***Sale includes other assets
Sources: Moag and Company Research; Pay Dirt; additional data on file from authors.
The market size of the city in which a team is located may be important because of its potential effect on the size of the team’s fan base, the local television contract, local sponsorship and advertising agreements, and the number of large corporations and wealthy individuals in the city with the ability to afford luxury seating. In addition, the degree to which the market is saturated by the presence of other professional sports franchises may impact a team’s value.
It is for all of these reasons that valuation of professional sports franchises is considered more of an art than a science. The selections used in this chapter shed additional light on the valuation process. In the first article, Ziets and Haber of sports advisory firm MZ Sports establish the background for the discussion that ensues in the remainder of the chapter. The chapter continues with a Fitch Ratings research publication that provides an overview of the rating process for sports-related transactions. In the third and fourth excerpts, Humphreys and Mondello and then Alexander and Kern offer in-depth scholarly analyses of the determinants of the valuation of a sports franchise. Phillips and Krasner take a peek into the future of sports franchise values in the final selection.
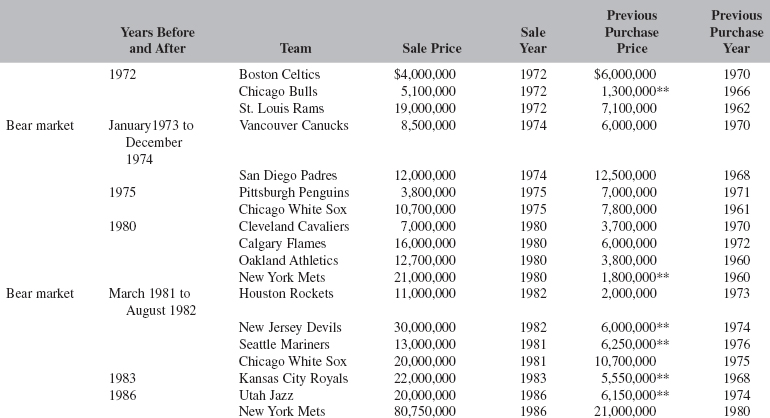
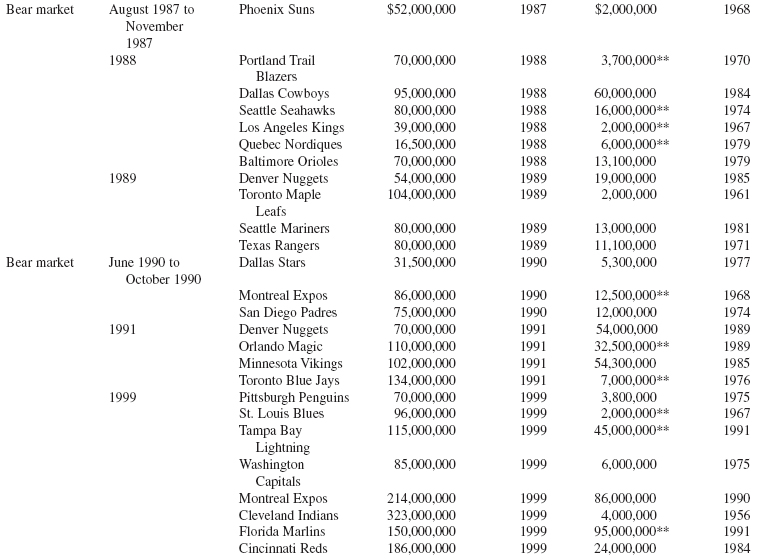
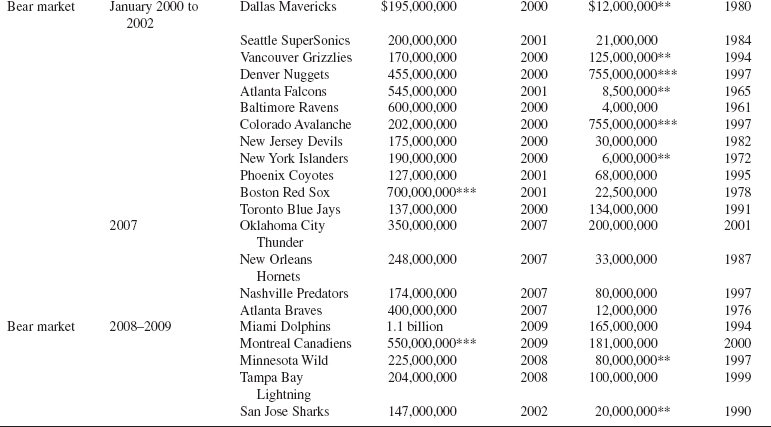
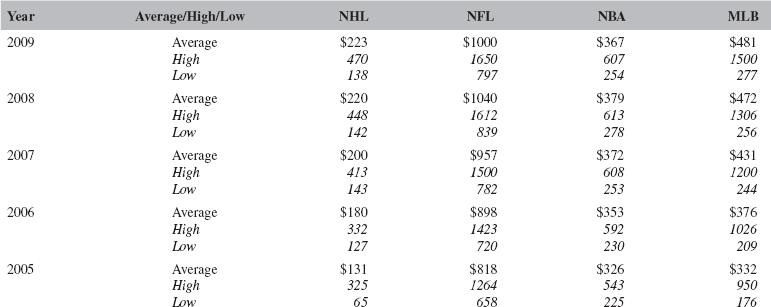
See Table 1 for a list of Forbes franchise valuations; Table 2 for a list of franchise sales before, during, and after bear markets; and Table 3 for a list of average league franchise valuations.
OVERVIEW
THE FINANCIAL VALUATION OF SPORTS FRANCHISES
Mitchell Ziets and David Haber

Figure 1 Franchise Valuations
Source: Rodney Fort, “Rodney Fort’s Sports Economics,” Sports Business Data page, 2005, http://www.rodneyfort.com/SportsData/BizFrame.htm, accessed January 2007. Reproduced with permission of ABC-CLIO, LLC.
Figure 2 Average Percent of Revenues Spent on Player Salaries by League
Source: MZ Sports LLC proprietary research. Reproduced with permission of ABC-CLIO, LLC.
Figure 3 CBA Term for Each League
Source: MZ Sports LLC proprietary research. Reproduced with permission of ABC-CLIO, LLC.
Figure 4 Per-Team National Media Revenues by League
Source: Street & Smith’s Sports Business Journal Research, “Sports Rights Fees,” Street and Smith’s Sports Business Daily, 2006, http://www.sportsbusinessdaily.com/index.cfm?fuseaction=tdi.main&departmentId=24#sportsrightsfees, accessed January 2007. Reproduced with permission of ABC-CLIO, LLC.
Figure 5 Average Nielsen Ratings
(1999–2007) by League
Source: Street & Smith’s Sports Business Journal Research, “Final Nielsen TV Ratings,” Street and Smith’s Sports Business Daily, 2006, http://www.sportsbusinessdaily.com/index.cfm?fuseaction=tdi.main&departmentId=24#finaltvratings, accessed January 2007. Reproduced with permission of ABC-CLIO, LLC.
Figure 6 Franchise Sale Prices vs. Market Size
Sources: MZ Sports LLC proprietary research; and AR&D Television Branding, “Nielsen Media Research Local Universe Estimates,” AR&D Television Branding website, www.ar-d.com/pdf/DMAListing_2005-2006.pdf, accessed January 2007. Reproduced with permission of ABC-CLIO, LLC.
Note: (1) Franchise was sold during the term of the 1994–2004 Collective Bargaining Agreement
(2) Franchise was sold during the term of the Collective Bargaining Agreement signed in 2008
Figure 7 Franchise-Owned Regional Sports Networks
Source: AR&D Television Branding, “Nielsen Media Research Local Universe Estimates.” Reproduced with permission of ABC-CLIO, LLC.
Figure 8 Historical Revenue Multiples
Source: MZ Sports LLC proprietary research. Reproduced with permission of ABC-CLIO, LLC.
CREDIT RATINGS
FITCH RATINGS—CRITERIA REPORT GLOBAL SPORTS RATING GUIDELINES, MAY 9, 2007
Chad Lewis, Jessica Soltz Rudd, Laurence Monnier, and Cherian George
SUMMARY
The continued evolution of professional sports from entertainment to big business has spurred billions of dollars of capital-market transactions in the past two decades at the league, franchise and facility level. Fitch’s core credit view of the underlying factors associated with sports-related transactions has not changed. Primary factors that Fitch analyzes to determine all sports ratings include the following:
• League economic model.
• National television contracts.
• Player salary structure.
• Revenue sharing among member clubs.
• Role of league in team financial matters.
• League debt limits and other financial policies on franchises.
• Relationship between league and players’ union.
• Locally generated revenues.
This report lays out Fitch’s view in more detail and guides readers through the analytical framework used in assessing the credit quality of a professional sports league, a professional sports franchise and various types of sports facilities based on the underlying financial viability and fundamentals, economic factors and legal analysis. The underlying economics of a professional sports league play the most critical role in assigning sports ratings. Professional sports’ economic models (consisting of players’ salary structures, media contracts and revenue-sharing policies, among other factors) have become more evident and highlight the leagues’ structural credit differences.
Fitch’s universe of sports ratings includes leaguewide credit facility ratings, franchise ratings, and stadium and arena ratings. Specifically, within the franchise ratings, Fitch has analyzed both corporate and asset-backed transactions. Fitch’s stadium and arena ratings universe includes transactions involving the four major U.S. sports leagues—the National Football League (NFL), Major League Baseball (MLB), the National Basketball Association (NBA) and the National Hockey League (NHL)—as well as European soccer leagues. The primary security structures in the stadium and arena ratings universe include a pledge of all facility-generated revenue, a pledge of selected facility-generated revenues, a pledge of various tax-generated revenues and asset-backed structures.
Fitch views sports ratings from a top-down perspective for team-related ratings, as well as project finance stadium and arena financings. From this perspective, team and sports facility ratings are analyzed within the operating and regulatory environment of their parent league, which provides analysis of that league’s economic model, financial policies and legal structure. Consequently, determining these ratings is in some ways analogous to the “sovereign ceiling” concept of the international bond markets when rating the debt instruments of nations and their subsovereigns or applicable corporate entities, such as provinces, states or corporates that are part of and operate within that respective nation’s laws and financial regulations. For example, Fitch maintains an ‘A+’ rating for the NFL’s senior unsecured notes, and it is unlikely that an individual franchise in the NFL would be rated on par or above the league. For sports facilities, the rating ceiling could be somewhat different, though this is generally unlikely, as stadiums and arenas may have strong economic characteristics stemming from multiple anchor tenants and the ability to host many other revenue-producing events.
The first two sections of this report specifically detail Fitch’s underlying analytical approach and the credit factors incorporated in rating the four U.S. professional sports and the franchises within those leagues. An appendix has been provided that specifically discusses credit fundamentals associated with European soccer transactions. Many of the facility-based credit factors are amendable to European soccer transactions, provided a thorough understanding of the league and franchise exist.
Construction and environmental risk factors and analyses are largely similar and applicable across countries. The legal framework in which a facility is developed is also generally similar across countries, with the stipulation that more or less stringent applicable laws may have a positive or negative rating effect, depending on legal impediments specific to an area that are more favorable or detrimental to a transaction.
PROFESSIONAL SPORTS LEAGUES
A professional sports league analysis is the backbone for all sports-related transactions. The fundamental makeup and economic model of a league is the most significant rating factor in assessing the credit quality for the league, as well as franchise and facility transactions. The primary source of revenues, national television contracts, provides a strong, stable revenue source. Additional shared revenues, such as pooled suite, club seat and ticket revenues, are viewed favorably as they provide revenue diversity. The framework set in place for the largest expense item, player salaries, is the second most important factor in assessing league credit. In addition to the financial and economic profile of a league and potential changes to the general economic framework, Fitch carefully monitors fan attendance levels, television ratings, average ticket prices, changes and trends in ownership, player and union relations and other factors that may have a material effect on the quality of the sports product.
A league structure incorporating strong national television contracts, appropriate salary structure, a strong diverse corporate sponsorship and advertising base, established strong debt policy, league-level support to assist distressed franchises, a solid history of limited work stoppages, and strong covenants and legal provisions is viewed most favorably by Fitch and would be a strong candidate for an investment-grade rating. Leagues that incorporate some of the key rating factors may also achieve investment-grade ratings.
League Revenues
Fitch views positively league policies that share national television revenues equally, as compared with a league that distributes national television revenues based on a team’s performance. From a ratings perspective, equal distribution provides, to some extent, additional parity among franchises by providing some level of revenue certainty per franchise, resulting in a more level playing field for franchises. While locally generated revenues may be dramatically different between small and large market teams, significant revenue sharing from a league level helps to mitigate significant disparities among franchises. Leagues that equally distribute revenues, rather than distribution based on a franchise’s on-field performance and winning record, provide greater revenue certainty and less potential for revenue disparity among franchises. The concept of distribution of revenues based on performance-based measures may be exacerbated if a franchise is unable to generate significant local revenues from ticket sales and other stadium-derived revenues. From Fitch’s standpoint, a league structure that bolsters financial parity among franchises has the potential to drive competition between franchises and grow and maintain spectator interest.
Salary Structure
The various salary structures across existing professional leagues around the world can have a substantial effect on the credit ratings of those leagues. Salary structures ranging from a “hard salary” cap to a “soft salary” cap to no salary cap exist in professional sports today. A hard salary cap establishes a maximum for player payroll. The player payroll may be adjusted upward or downward based on the index to which it is linked. For example, a hard salary cap may be linked to a percentage of the national television broadcast rights fees or a percentage of total league-generated revenues, including national television broadcast rights fees, shared suite and club seat and other nationally shared advertising and sponsorship agreements. Essentially, the player payroll and a team’s share of the national media contracts and other revenue agreements are adjusted in tandem. This is viewed as a credit strength because a franchise’s largest expense item, player salaries, are not able to exceed a certain percentage of defined revenues; thus, it is highly unlikely that expense growth would largely increase at a rate greatly exceeding total revenue growth. Additionally, given that franchises spend the same amount of money on player salaries, teams should have a similar talent level, which drives competition. In Fitch’s opinion, competition between franchises is a key underlying factor for the ability of a league to sustain strong spectator interest over the long term.
A soft salary cap may generally have the same structure as a hard salary, with exceptions for veteran or key franchise players. Exceeding the soft salary cap requires a franchise to pay a fixed amount of money, often equal to the amount above the threshold, into a league’s central fund for equal distribution to the other franchises in the league. The absence of a salary cap (i.e., an owner may choose to spend as much or as little on a franchise payroll) is viewed as a weakness to a league, because there is less expense certainty. Additionally, a significant disparity between franchise payrolls and the subsequent higher talent levels lured by larger payrolls has the ability to risk the long-term competitive nature of the league.
Fitch views the combination of equal distribution of revenues, coupled with a hard salary cap, as a strong foundation for a professional sports league. The current U.S. (NFL) economic model is an example of this. The NFL has a hard salary cap and adjusts player payroll according to the annual amount of national broadcast rights fees and other shared pooled revenues, which are distributed among all the franchises equally.
League Debt Policies
An established debt policy at the league level for franchise-level debt is viewed positively by Fitch. A debt policy that caps a franchise’s maximum debt to an established fixed asset value based on recent historical franchise sales is viewed more favorably than a debt policy that links maximum debt levels to a financial indicator, such as EBITDA. While an EBITDA debt test provides a solid financial indicator, Fitch generally views possible short- to medium-term fluctuations in EBITDA as more volatile than possible declines in franchise values. A franchise may decide to sign a “high profile” player in a year and cause financial margins to decline for that year or the next. Conversely, Fitch’s proactive monitoring of franchise sales across the leagues for the past 10 years supports this premise of greater stability in franchise values. Fitch would expect that, and views favorably, a debt policy linked to the franchise value would yield no more than a debt-to-franchise value of 25% and a debt policy linked to EBITDA would link maximum debt to no less than 10 times (×) EBITDA, which Fitch notes as being on the high end of the spectrum for EBITDA tests.
League Work Stoppage History
The relationship between the players’ associations and league and history of work stoppages is a key factor in rating leagues. Fitch assesses the historical labor environment and any material changes that have occurred to the current environment. A strong history with limited disputes from both sides is viewed positively. Historical disputes over key elements of labor agreements that have been changed and agreed upon, as well as an overall current peaceful labor environment, are viewed favorably.
SPORTS FRANCHISES
An understanding of league policy and procedures, as well as its underlying economic model, is a prerequisite for considering franchise fundamentals. It is the competitive nature and long-term stability of these associations that foster and preserve fan interest, which, in turn, attracts advertisers and broadcasters. Macro- and microinfluences, such as demographics, stadium and arena issues, as well as management ultimately differentiate the financial profiles at the team level. These influences help serve as key credit support measurements.
Fitch also notes, with the advent of various leaguewide borrowing programs in the United States, the majority of franchises seeking capital markets debt have elected to borrow from leaguewide programs as opposed to entering the capital markets. Arguably, the leaguewide programs in the United States give franchises a lower cost of borrowing, because the debt is secured by league revenues and debt service is paid prior to franchises receiving the revenues, which Fitch views more favorably.
Although general rules can be applied, rating debt at the franchise level remains a case-by-case analysis. In reviewing an individual team transaction, several key questions need to be asked, including the following:
• Can a team support both its operating cost and its debt obligations?
• Are there appropriate credit-protection measures in place to support debt service and asset valuations in a downside scenario?
• Does the league take an active role in ensuring the financial viability of its member teams, as well as the financial claims of creditors?
• What has been the track record of ownership in generating consistent financial results?
• Has the team forged a special relationship within a community that makes it an invaluable asset and source of pride?
A thorough understanding of the answers to these questions serves as the basis for Fitch’s sports ratings at the team level.
Because most debt at the team level is secured by a direct lien on the franchise, team debt can be considered a hybrid transaction, incorporating elements of both a traditional cash flow obligation, as well as elements of an asset-based transaction. As a result, Fitch’s approach gives appropriate consideration to both of these measures in establishing a senior secured rating. A more favorable rating will be considered where the team is the legal obligor (team-level debt), as opposed to holding company or partnership (holdco. or partnership) debt. The position of the borrower addresses such issues as structural subordination. Debt at the holdco. level is structurally subordinate to debt at the team level, similar to the concept of a holdco. in traditional corporate finance.
Establishing a senior secured rating is a two-step process. The first step involves establishing a timeliness of repayment rating or implied senior unsecured rating. The second step involves notching from the implied senior unsecured rating based on the collateral coverage provided by the value of the franchise.
IMPLIED SENIOR UNSECURED RATING IN SENIOR SECURED RATINGS
The implied senior unsecured rating effectively serves as the starting point for the secured rating. Key considerations for establishing an implied senior unsecured rating consider the overall quality of the team’s key revenue components. More specifically, Fitch differentiates contractual revenue streams from noncontractual revenue streams. Contractually obligated revenues (COR) primarily include national and local media contracts, local sponsorship agreements and luxury suite rentals. Sometimes revenues are referred to as “highly probable.” These revenues are not explicitly contractual but have a contractual component that may be represented as highly probable. Highly probable revenues are analyzed and reviewed to determine the likelihood that they will be realized. Fitch will only consider such sources if historical evidence suggests a high probability of realization. Season ticket sales, which have demonstrated consistent renewals over a long period of time, may be considered highly probable. The greater portion of revenues deemed contractual and/or highly probable, the higher the “quality” assigned to these revenue streams.
Another key analytical factor is a team’s COR as a percentage of player payroll. Because player payroll constitutes the largest cost component for a team, the extent to which player cost can be matched against contractual revenue streams helps to assess a team’s reliance on less certain revenue streams to support player payroll, operating expenses and debt service. COR representing more than 70% of total player expenditures will, on average, result in a higher implied senior unsecured rating. Conversely, teams with COR substantially less than 70% of player cost will likely receive lower implied senior unsecured ratings. Teams operating in leagues with weak restraints on player costs and loose debt limitations, as well as those in which the COR is less than 70%, would most likely have the lowest implied senior unsecured rating.
EBITDA may not be the most accurate proxy for a team’s cash flow, given that GAAP EBITDA does not take into account items such as cash bonuses, deferred compensation and other cash items that are not reflected in the income statement. Therefore, traditional cash flow based credit metrics, such as total debt/EBITDA and EBITDA/interest expense, have limitations when valuating team-level debt obligations. With this in mind, Fitch uses slightly altered credit measures in rating team debt.
Leverage
The ratio of debt (at the team level) to a team’s annual COR should not exceed 2.0x for investment-grade consideration.
Debt-Service Coverage
Depending on the league, as a general guideline, the Fitch base case and Fitch stress case have targeted minimum ratios of operating income (total revenues less total operating expenses and cash bonuses) to annual debt service to range between 2.25x and 1.75x and 1.75x and 1.40x, respectively, for investment-grade consideration.
As mentioned previously, the relative strength of a league’s economic model is also considered in establishing an implied senior unsecured rating. For example, the NFL’s economic model is extremely strong and helps to create a favorable credit environment for the league’s individual franchises. This is in part due to the NFL’s robust television contracts that roughly match a team’s largest expenditure: player payroll. For leagues in which revenues are not as equitably distributed, the effect is illustrated via a performance gap. Small-market franchises find it increasingly more difficult to compete with large-market teams, as they do not have comparable economic resources to procure top player talent. From a ratings perspective, a lower shared percentage requires greater scrutiny on a franchise’s local revenues. These include gate receipts, local broadcasting rights and stadium-related revenue. These revenues are more closely tied to market demographics and team performance.
Collateral Coverage in Senior Secured Ratings
The second step in rating franchise debt assesses the overall collateral coverage provided by a pledge of the franchise. Recent transaction prices serve as the most relevant valuation measure. From an asset coverage standpoint, most teams exhibit significant asset coverage over committed secured debt amounts. Additionally, leagues with actively enforced debt policies that limit an owner’s ability to leverage a team help to ensure sufficient overcollateralization. Fitch will notch above the implied senior unsecured rating by as many as three notches where ultimate recovery of principal is certain. In general, to receive a three-notch enhancement, loan to value (LTV) should be 50% or less. The 50% LTV guideline is a general rule and should be matched against the overall credit quality of the team.
ANATOMY OF A SPORTS FRANCHISE TRANSACTION
The primary credit risks in a sports franchise transaction involve renewal of the national media contracts (as well as local media contracts and other COR, where appropriate), the possibility of a work stoppage and a deterioration in franchise values. Fitch views favorably debt obligations that contain structural features that help to offset these risks.
National Media Contracts
Fitch considers renewal risk of national media contracts to be among the most important factors in assessing the credit-worthiness of sports franchises. Because broadcasting rights fees provide a substantial portion of a team’s revenues, any adverse change in these contracts would likely have a material effect on a team’s overall credit profile. Ideally, the tenor of the debt obligation should expire prior to the expiration of the national media contracts so as to avoid renewal risk. When the maturity of the rated debt obligation goes beyond the expiration of the national media contracts, Fitch considers the historical trends in renewals for sports programming and for the respective league. In cases where creditors are exposed to broadcast contract renewal risks, covenants that set minimum thresholds for national broadcasting renewals are helpful in providing remedies in the event leaguewide broadcasting contracts are lower than anticipated. Possible remedies may include mandatory ownership capital calls and cash lockups prior to the renewal of national broadcast contracts. Fitch views positively structural features, including covenants, that allow creditors to readjust credit risk in light of lower than anticipated league wide broadcasting renewals.
Labor Environment
Fitch views positively structural provisions that address potential work stoppages. This applies to instances where the collective bargaining agreement (CBA) expires prior to the maturity of the rated debt obligation. While the contractual terms of the national media contracts may provide for the continued receipt of broadcasting fees during a work stoppage, teams will not receive any game-related income (ticket sales) and may have to remit refunds to ticketholders and sponsors. A labor contingency reserve helps to offset this risk by protecting debt service in the event of a work stoppage. Typically, labor contingency reserves will fund one year of debt service. Similar structural protections are required for investment-grade sports facility ratings.
Collateral Coverage
Similar to an asset-based transaction, collateral valuations are a key measure of credit support. Fitch views favorably covenant triggers that set minimum team valuations. Periodic appraisals and/or recent purchase transactions may serve as the mechanisms for collateral monitoring. Fitch examines the rights of creditors to readjust credit risk if asset valuations decline. A mandatory debt repayment to reduce LTVs and asset coverage to prevailing rates is viewed most favorably as an offset to potentially declining franchise values.
Support Agreements/Guarantees
In some cases, a team’s underlying credit profile may be extremely weak and rated low on a stand-alone basis. In these instances, a credit may require some type of third-party support. This support usually takes the form of an operating support arrangement in which the owner or supporting entity agrees to fund operating losses unconditionally or up to a specified, agreed-upon amount. Fitch’s implied senior unsecured rating starts with the team’s creditworthiness on a stand-alone basis and is adjusted to reflect the level of support provided by the outside party. In considering the level of support, a review of the outside party’s financial ability to cover operating losses and debt repayment is considered. The financial strength of the support provider, as well as the level of support required by creditors, helps determine the level of enhancement given to the implied senior unsecured rating.
Lockbox Mechanisms/Accounts
Certain lockbox or debt-service account (DSA) structures may be established to provide debt service through contractual revenue streams. Franchise debt transactions may attempt to somewhat mitigate team financial risk by creating a lockbox structure that directs national broadcasting rights fees into a lockbox account. The lockbox account deducts amounts required for debt service and remits the remaining portion to the team. Furthermore, the transaction may require additional funds be held in the DSA as added debt-service protection. The DSA and lockbox arrangement somewhat insulate creditors from team-related risk. It should be noted that these structures only serve as a method of payment and do not necessarily protect creditors’ claims should the team file for bankruptcy. The automatic-stay provision within the bankruptcy code could freeze interest and principal payments owed to creditors.
FRANCHISE VALUES
One of the biggest unknowns in sports financing is the future of team valuations, which is a key component in a sports franchise rating analysis. Rather than trying to predict the future of team valuations, it may be more useful to understand the underlying fundamentals that support franchise values. Some of these fundamentals include the relative scarcity of sports assets, the exclusive right to operate, the economics of the respective league and the prestige associated with owning a sports team.
Relative Scarcity of Sports Assets
The consensus from officials across all leagues seems to suggest that demand far exceeds supply for ownership of a professional sports team, although Fitch notes that current demand may change in the future. However, given franchise sales over the past 10 years, Fitch believes the likelihood that franchise values would decline in the near term is highly unlikely; thus, demand will remain strong. With waiting lists of buyers and a limited amount of teams available for purchase, competition for ownership can be intense and drive up the price paid for a team, in many cases. However, demand for clubs can differ significantly based on the team’s local market, history of support and the league in which it plays, among other factors.
The Exclusive Right to Operate
The right to operate a team is solely and exclusively granted by the governing league. The right granted by the respective league effectively serves as a key barrier to entry. This right to operate allows an acquiring owner exclusive access to national media revenues and other team-generated revenue streams. Moreover, each major sports league has explicit rules prohibiting competing ownership within the same market. This effectively provides an owner with the ability to operate in noncompetitive geographical markets (for the respective sport).
The Economics of the League
As discussed in the league analysis section, the underlying economics of a league help determine the overall attractiveness of a franchise. One of the major differentiating factors between sports leagues is the allocation of revenues among member teams. For example, the NFL equitably distributes a high percentage of total leaguewide revenues and places a hard cap on players’ salaries. This policy puts franchises on generally level fiscal terms, translating into greater on-field competition and fan interest. As a result of these policies, the overall attractiveness, from a financial standpoint, of NFL member teams is increased.
Trophy Assets
The prestige associated with owning a professional sports team is an intangible benefit that is not easily measured. Instant visibility is gained upon owning a sports team, as fans and local media perceive the owner as a key community figure. Like a valuable piece of art, some of the benefits of owning a professional sports team are less scientific. The emotional aspects of ownership may play a big role in the overall purchase decision.
To the extent that debt is used to finance a significant portion of a purchase price, prudent credit decisions must still be made. Depending on the operating history of the respective franchise and prevailing macroeconomic trends in the industry, credit-protection measures, such as material debt amortization and/or mandatory debt reductions, may help offset credit concerns relating to future franchise values and refinancing risks.
Cash Flow Analysis
In addition to the aforementioned factors analyzed in determining franchise values, the ability and amount of positive cash flow a franchise generates is also analyzed. It is important to note that a thorough understanding of the league framework in which a franchise operates in is a pivotal factor when analyzing cash flows of a franchise in the value of a franchise. A franchise that plays in a league where there is substantial leaguewide revenue sharing and a salary cap has a stronger foundation to produce positive cash flow, because a significant amount of overall revenues flow from national television contracts and the largest expense item, player salaries, is fixed. While franchise performance may affect other revenues, a franchise in a league that does not have significant revenue sharing from a national broadcast agreement and a salary cap may be more susceptible to revenue fluctuations based on on-field performance, which would ultimately have a greater effect on cash flow. Management’s ability to grow revenues in addition to leaguewide revenues from local media contracts, average ticket prices, advertising and sponsorships, and concessions and novelties is an important rating factor.
Management’s historical track record and ability to manage and adjust expenses in a period of declining revenues is also a key credit consideration. Fitch recognizes that while other team-level expenses, such as player development, general administrative costs and benefits are a small portion of total expenses, they are important to a franchise. Historical demonstration and understanding management’s ability, plan and implementation to manage expenses is crucial. Fitch will carefully monitor any changes in league revenues and locally generated franchise revenues and any potential short-term and long-term effects on cash flows.
SPORTS FACILITIES
The increasing importance of sports facility generated revenue to teams’ financial health spurred a significant surge of new construction, as the changing model of professional sports has proven that new facilities are vital to a franchise’s financial success. New facilities have the ability to generate new revenue streams, such as naming rights, club seats and suite revenues and, generally, strong corporate advertising and sponsorship revenues. Older stadiums that have not benefited from the aforementioned new revenue streams and, in many cases, lease agreements that limited financial growth often impede the financial potential of a franchise.
Historically, most stadiums and arenas were financed under the same city-building infrastructure theory as municipal properties; that is, the buildings were intended to be used by all and constructed solely with public dollars for the benefit of the town and people. However, as professional sports leagues expanded into big business, the pressure for modern stadiums with new and increased revenue drivers pushed the trend of facility construction into a new era, much of which with private dollars. Several methods of financing construction have been used, including public financing via tax-generated sources, stand alone nonrecourse project financing and asset-backed securitization of stadium revenues. It is important to note that almost every sports facility financing package is different and has consisted of elements of either tax-backed or project financing, or both, as well as private loans or private cash. However, certain underlying factors are similar and necessary in all sports facility transactions, such as the franchise’s lease agreement with a nonrelocation agreement or a “promise to play” for the term of the debt.
From a project finance perspective, public dollars are considered pseudo equity, helping to bolster the economics of the project finance bond transaction. Fitch observes that there is not a consistent debt-equity structure utilized, as there are many different ways to finance a large-scale project, and that each transaction is structurally different. From a bondholder’s perspective, the lower the leverage and the higher the debt-service coverage the better, but both factors are different in every transaction. While there is almost always a mixture of public debt, private debt and private equity contributed to sports facilities, Fitch notes that, in many cases, the public sector retains the title and ownership to the stadium or arena.
Projected cash flows, debt-service coverage and liquidity levels for these types of project financing transactions must undergo various base and stress test case scenarios. Pro forma projections must be able to withstand several sensitivity analyses. Generally, assumptions in the stress test include reductions in base attendance levels, decreased percentages of premium seating renewals, the exclusion of certain revenue from other events and a significant reduction of other revenue, such as naming rights, concessions, advertising and parking. Structural protections, such as debt-service reserve funds, must also be included in the transaction to mitigate the risk of a work stoppage. The appendix attached to this report, and further discussed below, provides an indication of various assumptions Fitch will build into a base-case and stress-case scenario.
Furthermore, Fitch assesses the viability of each sports project finance transaction through a detailed analysis of the facility’s service and market area, franchise and venue competition, project construction risk, the respective league of the tenant franchise, the quality of the franchise and the strength of facility management and operations.
PROJECT FINANCE—FINANCIAL PROFILE
In general, for project finance sports facility ratings, it is important to note that Fitch uses fan attendance averages from historical trends, rather than from pro forma attendance estimates. Additionally, the rating is based largely on COR, which is not directly dependent on the on-field success of the home team but rather on presigned long-term leases the sports facility enters into with the various counterparties, such as naming rights partners, advertising partners, long-term suites and club seat agreements, guaranteed concession agreements and team rent payments.
Although revenues in entertainment-dependent facilities are often considered volatile because of their nonessential nature, a high percentage of COR provides a degree of stability and predictability to the revenue stream. Key elements of COR include solid lease agreements with the anchor tenants, premium seat license agreements, long-term contracts with concessionaires and advertisers and, possibly, some type of guaranteed public support (such as a sales tax rebate). It is important, for investment-grade consideration, that transactions have at least 60% of projected pledged revenues contractually obligated.
Luxury Suites and Club Seats
Premium seating has become a major source of security for project finance transactions. Premium seating generally consists of luxury suites and club seats that range in price from $50,000–$350,000 and $500–$5,000 per annum, respectively. The pricing structure is driven by demand, actual suite location and associated amenities, the strength of the tenant franchises and the number of included events. Due to their high cost, suites are normally leased by corporations, and Fitch analyzes the service area’s corporate base compared with the overall supply of suites in the area. The length of premium seat leases varies, with average terms ranging between three and 10 years. From a debtholder’s perspective, a transaction with staggered lease expiration dates mitigates the risk of a significant percentage of leases expiring in any given year, which poses renewal risk. Demand factors for luxury seats are based on economic conditions in the local area, historical franchise performance and fan support. For luxury suite agreements, Fitch generally assumes the payment schedule according to the initial terms of the agreement and stresses the renewal of those agreements. Club seat revenue can also represent a significant amount of pledged revenue. Club seat holders are typically small businesses and wealthy individuals, and Fitch believes club seat demand is more dependent on the franchise record than luxury suites.
Naming Rights and Sponsorship Agreements
Naming rights agreements are another revenue source that can be part of a basket of revenue streams that can secure project bonds. Naming rights enable a corporation to name the facility after itself or one of its products. Naming rights agreements may include a substantial upfront payment, in addition to annual payments, typically well in excess of $1 million. A naming rights counterparty analysis is important to the rating of the project debt, and the underlying rating of the corporation is considered. Projected income may be discounted for low-rated counterparties. Additional corporate-related income may be derived through sponsorship and advertising agreements.
Personal Seat Licenses
Personal seat licenses (PSLs) are another source of revenue earned by facilities. A PSL is purchased by individuals, giving them the right to buy season tickets for a certain period of time or for the life of the facility. PSL revenue is typically collected in the initial stages of the construction process, so it is often used as equity to partially fund facility construction, as opposed to being utilized to retire debt.
Season Ticket Sales and Concessions Revenue
Season tickets, and to a greater extent gate receipts, comprise relatively volatile revenue streams in certain sports and markets, since the demand is highly correlated to the franchise’s current performance and economic conditions. Stress levels for these revenue streams are significant and depend on market location, the inclusion of an upfront payment or PSL, franchise support and demonstrated continued demand, such as historical revenues and the existence of a ticketholder waiting list. The guaranteed revenue under a concession agreement is based on calculations that incorporate fan attendance levels and varying percentages of gross annual receipts net of sales taxes. To determine the likelihood of payment of the guaranteed portion of the concession revenue stream, Fitch analyzes the historical concession revenue performance. The strength of the guaranteed revenue stream is also based on the counterparty’s credit rating and its position in the industry. The agreement may include a substantial upfront fee to the facility and a guaranteed portion that is significantly lower than the historical concession revenue generated. Inclusion of these provisions partially mitigates the risk that an obligor may default on its obligation and increases the ability to attract a replacement concessionaire in the event of unacceptable performance.
PUBLIC FINANCING
Traditionally, there has been substantial public support in sports financing, as state governments, local governments and special tax districts pledge support to the projects in various ways. Tax-supported sports transactions have been structured as general obligation bonds, lease-backed bonds and dedicated tax bonds, among others. Specific taxes earmarked to support facilities, including taxes on tobacco and alcohol, general sales taxes, accommodations taxes for hotels and motels, and ticket surcharges, among others, have been used to secure the debt issued for sports facilities. The use of accommodations taxes is a popular method of financing the debt, because it is perceived that the project will attract visitors who, in turn, will occupy the hotels and motels. This method of financing, along with similar tourist development taxes, such as those on rental cars, are politically more palatable and, consequently, may be more successful in gaining local support, because they primarily affect visitors, as opposed to local residents.
LEGAL STRUCTURE
Various legal agreements establish a project framework and each party’s obligations. Fitch analyzes project documents and their legal implications to ensure full and timely principal and interest payments and to evaluate bondholder security. Although there are several primary legal considerations inherent in all sports facility financings, all legal analyses focus on the bondholders’ legal right to receive project revenues on time and in full. Fitch first focuses on collateral pledged to the bondholders. In all sports facility financing structures, a team nonrelocation covenant is required. These agreements protect the economic value of the project by legally requiring the teams to play their games at the facility, thereby mitigating the risk that there will be insufficient revenues due to a team’s departure.
Project Finance and Securitization
In traditional project finance and those structures incorporating elements of securitization, security is derived from pledged revenues and, in some cases, a mortgage on the building, as well as a ground lease. The pledged revenues usually include several revenue streams, the right to future revenues, the right to enter into future contracts and the right to renew contracts. Fitch then evaluates the potential bankruptcy of all parties to the transaction, with a particular focus on the issuer and/or its parent, analyzing the possible delay and the potential of total disruption in bondholder payments.
Bankruptcy analysis is paramount to these transactions. The legal structure and/or supporting credit solutions are evaluated when analyzing the potential bankruptcy of all parties where their bankruptcy could affect full and timely payment to the noteholders. The primary focus is usually on the issuer, parent(s) and affiliates. Fitch’s bankruptcy analysis evaluates the ability of the entity to make timely payments to the bondholders without any interruption in the cash flows and the potential for the complete termination of those cash flows.
In project finance sports facility transactions, the debt-issuing entity is either a newly formed special-purpose vehicle (SPV) or operating subsidiary. Traditionally, the issuer has a first perfected security interest in the collateral, which is then pledged to the indenture trustee for the benefit of the bondholders. If the issuer is not an SPV, Fitch performs a financial analysis of the issuer to ensure that its bankruptcy risk is commensurate with the rating level assigned to the transaction. Transactions incorporating elements of securitization generally involve the sale of the collateral from the operating subsidiary to a bankruptcy-remote SPV created to serve as the issuer of the financing. The issuer SPV then issues bonds supported by the assets acquired by the issuer SPV. Fitch expects the counsel to the transaction would confirm that a true sale of the assets has occurred, such that the assets would not form part of the transferor’s estate if such transferor filed a petition in bankruptcy. Fitch further expects, with respect to the SPV’s issuance of the bonds, that the counsel validate that the issuer SPV has granted the indenture trustee a first-priority perfected security interest in all of the issuer SPV’s assets. Also, Fitch expects that all relevant enforceability opinions required for the transaction will be provided. Generally, both of these transaction structures include the use of a lockbox for bondholder protection.
Fitch expects that the transaction’s counsel would furnish a nonconsolidation opinion with respect to any owner holding more than 50% interest in an SPV. If an SPV has been created, Fitch evaluates the credit strength and financial viability of the SPV’s parent and affiliates. This analysis sometimes provides adequate assurance that voluntary and involuntary bankruptcy of the parent and affiliates is unlikely. In those cases in which parents and affiliates hold real estate interests or are the operator, Fitch, in addition to analyzing the parent’s and affiliates’ credit quality, assumes they become insolvent and declare bankruptcy. Since the operation of the sports facility is usually necessary to generate revenues for the parent or affiliates, Fitch, on a case-by-case basis, will analyze the business incentives for a parent or affiliate to cause consolidation. Fitch has consistently reached the conclusion that bondholders will be ultimately paid. However, a lapse in the timely payment of principal and/or interest is likely while the entity restructures. Certain reserve requirements are traditionally provided to ensure timely payment to the bondholders.
Real Estate Structures
In many tax-supported and project finance structures, as well as structures incorporating elements of securitization, the land is owned by the municipality or other parties and leased via a triple-net ground lease to the issuer through the term of the debt. Traditionally, the improvements are either transferred to the issuing entity through the sale of a fee—simple interest in the building after construction is complete or leased in the form of a triple-net lease through the term of the debt. In either instance, the interest in the building and its fixtures provide lenders with additional repayment security.
Under a triple-net lease, the lessee bears all responsibility on real estate issues, costs of operation, insurance, abatement, assignments and sublets. The leasehold and/or fee interest is sometimes pledged to the bondholders, providing additional security and often the right to replace the operator if the facility is not managed as a first-class facility or up to certain identified industry standards. However, Fitch will evaluate a structure that does not include a mortgage interest granted to the bondholders. For example, instead of a mortgage interest, the issuer and other appropriate parties may incorporate either a pledge not to encumber the fee simple while bonds are outstanding, which is offset by additional overcollateralization or a springing mortgage. Both of these structures are inherently weaker from a credit perspective but can be evaluated and included in investment-grade credits if they have appropriate offsetting strengths.
Construction Risk
As with other types of projects, construction risk often constitutes the greatest risk in the credit quality chain of a stand-alone sports facility project. In certain circumstances, it can constrain the rating to a level below what it would be after completion. Completion risk refers to the risk that the facility will not be completed on time, on budget or up to the required performance standards. For strong, economically viable projects, construction completion risk can be mitigated and investment-grade ratings can be achieved. Fitch will carefully consider the project’s complexity and technology, projected costs, delay risk and quality of contractors, as well as the terms of the construction contract.
Sports facilities vary widely in complexity, ranging from less complex open-air, single-level stadiums on undeveloped land to multilevel, retractable roof stadiums in densely populated areas and arenas in earthquake-prone areas. Fitch relies on the expertise and opinion of independent and reputable engineers (I/Es) to evaluate the design specifications of the project and the reasonableness of the development cost estimates and ongoing maintenance expenditures. The role of the I/E is crucial during the development phase, as one of the critical tasks is to monitor the works process, milestone compliance, and critical path or schedule. Typically, the I/E also approves the release of escrowed funds to compensate the contractors from proceeds of rated debt.
Construction quality and proper maintenance are fundamental for sports facilities, as they are generally considered assets with a useful life of 30–40 years that can support long-term, nonrecourse financing. The I/E’s assurances regarding construction quality and maintenance represent a vital link between the sports facility (the asset) and the financing’s structure.
Project complexity will affect the likelihood that the facility will be completed on time (delay risk). Delays can also occur due to permitting, stop-work orders, availability of critical equipment or labor, weather or seasonal conditions, and other factors. Delays that cannot be controlled by the contractor, such as force majeure and permitting, must be addressed by other means, such as compensation from insurance. Of note, potential delays and construction cost overruns caused by incomplete, ambiguous or evolving specifications, beyond the customary and often inevitable work changes requested by either the sponsors or contractor, are of great concern. Fitch expects projects financed by the capital markets will be undertaken on the basis of minimal design risk. Neither Fitch nor the I/E has the capacity to estimate the ultimate effect on project costs and cash flows from material changes in design once a project has initiated construction, especially if appropriate mechanisms, such as completion and performance guarantees from sponsors, governments or solid third parties, are insufficient or not provided.
Environmental Risk
Another major consideration is environmental risk, including remediation efforts, cost overruns, timing and insurance. Environmental issues are of greatest concern during the construction phase of a project, because unexpected expenses during this period can seriously deteriorate the credit quality of the project. Traditionally, the environmental concerns are identified, and mitigation procedures have been established prior to the project being brought to the capital markets. Also, most project finance and structures incorporating elements of securitization involve guaranteed maximum price contracts, thereby transferring responsibility for unexpected costs. Fitch will review the guaranteed maximum price contract to ensure that such risks are shared by the public and private entity. If the contractor bears the burden for preexisting conditions, the risk could limit the rating. In some instances, the municipality bears all responsibility for environmental risks and will cover the costs associated at the various stages of buildout. Fitch’s concern is for the overall viability of the project: how unexpected environmental costs will be paid for, are there adequate reserves and insurance, or are the risks assumed by the party best able to handle such issues.
FITCH BASE-CASE AND STRESS-CASE SCENARIOS
To assess the ability to repay debt in a full and timely manner, Fitch will first evaluate the economic profile of the project and then layer onto it any legal, financial and policy constraints. To accomplish this, Fitch will initially design base and stress cases solely based on economic factors that incorporate reasonable scenarios that can occur based on Fitch’s experience with the sports industry as a whole and with similar projects. As an illustration, Fitch provides some guidance on how we might design these cases in the matrix … [that follows]. While the appendix is largely a general guide, tailored assumptions may be necessary based on local experience and broader legal, political, economic and financial considerations. The application of each of the factors identified will be a function of the type of the sports facility (new construction or facility with an operating history), the level of conservatism in key finance plan assumptions and the level of financial flexibility maintained.
For each factor, Fitch identifies an analytical approach and a range of possible adjustments. The level of adjustment within the identified ranges will be a function of the nature of the project and its risk profile, which incorporates service area analysis, historical franchise operations and the league framework, as well as Fitch’s assessment of the conservatism or aggressiveness built into the plan of finance provided. Fitch will then layer noneconomic factors to finalize our base and stress cases. Generally, Fitch’s base case will be more conservative than the base case provided by the entity, as Fitch’s base case seeks to establish a scenario that is highly probable under normal conditions. For example, Fitch’s scenarios eliminate any built-in optimism in assumptions with future attendance levels and any additional revenue assumptions, including higher concession, novelty, parking and ticket revenues. Fitch’s stress case then seeks to assess the ability of the structure to withstand a combination of severe, but reasonably probable, stress situations while still paying debt service on a full and timely basis.
The level of financial flexibility that remains after the application of the stress test to absorb further downside events will be an important driver of the facility’s debt rating. Facilities with minimal remaining flexibility will at best achieve low investment-grade ratings. Facilities with higher levels of remaining flexibility and strong structural enhancements may be able to achieve higher ratings, although they will be generally capped in the ‘A’ category.
APPENDIX TO SPORTS RATING GUIDELINES
Sports Financing in Europe
A small number of European football-related (often referred to as soccer in the United States) financings have been completed, mostly via private placements with banks or with institutional investors (frequently in the U.S. market), with the most notable public financing being that for Arsenal Football Club (a soccer club in the English Premiership League) in 2006. In order to understand the importance of relegation risks and other credit factors in European football, as compared to U.S.-based sports, it is necessary to understand how the English Premiership League system and other European counterparts operates. Although all of the specific features of the English Premier League are not necessarily common across the other European leagues, Fitch’s approach to analyzing key credit factors serves to illustrate the differences and specific risks addressed to transactions in Europe.
Because the role of European sport leagues differs significantly from the role of those in the United States, Fitch does not need to rate the league in order to rate a sports transaction. While the rules of the leagues in terms of broadcasting revenue distribution, financial control and sporting sanctions in case of financial difficulties will be reviewed, there is no concept of a league-related rating cap for European football transactions. However, given that Fitch compares sports-related credit ratings across various countries and the risks of relegation in Europe, Fitch notes that European soccer ratings may be limited to rating ceilings based on the league fundamentals analyzed in U.S. sports transactions.
Leagues
Arguably, European football is the most highly developed and popular sport in Europe. The Barclays English Premier League (the top league in England), Serie A (the top Italian Soccer League), Liga de Futbol Profesional (commonly known as La Liga, the top league in Spain), the Bundesliga (the top league in Germany) and Ligue de Football Professionnel (the top league in France) are widely regarded as the top five leagues in Europe. Each league operates and competes within their respective country, as well as in competitions across Europe.
Qualification for the two major European competitions, the Union of European Football Association (UEFA) Champions League and UEFA Cup, is available to clubs finishing in the top 4–8 spots in the league (the exact number depending on the size of the league and past performance of its clubs in the European competitions). At the opposite end of the scale, clubs can be relegated to a lower league if they finish the season in the bottom two or three spots in the league.
This structure has the effect of making virtually all games have some importance, whether for the top clubs seeking to win the league, the middle-ranking clubs seeking to qualify for European competition and the extra income that brings or the bottom clubs seeking to avoid relegation. This apparent lack of a widely competitive league structure has not detracted from the popularity of the game, which continues to improve annually, given Fitch’s observation of attendance levels across Europe. This is undoubtedly partly a result of increased interest in the pan-European competitions, where there are no dominant teams or countries.
Relegation
The major European soccer leagues practice a system of promotion/relegation. This is the key difference in league structures between the U.S. and European soccer leagues and raises unique credit risk concerns. Relegation is the process by which poorly performing teams at the bottom of league standings are demoted to a lower division and replaced by top teams in the next lowest division. This performance-related risk can have significant implications on two fronts. First, broadcast rights fees can be dramatically different from one division to the next, creating a greater degree of uncertainty with regard to revenue flows. Second, attendance figures will be affected, as fan interest is a function of the level and quality of competition. Some leagues provide an element of compensation for relegated teams in the form of a “parachute payment,” payable for two years in the case of the English league, to offset the effect of lower revenues (mostly media), which may not be immediately fully reflected in lower player salaries. Despite the parachute payments (which are not common to all European leagues), relegation is a considerable rating stress scenario for which Fitch seeks reassurance that the relevant club would have adequate financial resources to meet its debt payments.
Locally Generated Revenues
Ticket sales are widely viewed as the most stable revenue source, but they can vary significantly between the largest clubs with stadium capacity of more than 70,000 to the smallest clubs with stadium capacity of 20,000. Historically a club’s revenues would have been principally generated by ticket sales to the local community, in addition to a small proportion of sales to traveling fans. The increased influence of television broadcasting rights, sponsorship, advertising and retail sales via club Web sites has changed the revenue mix significantly, but the importance of local support is a key rating factor and has historically contributed to a signifi-cant proportion of total club revenues.
Given the large dependence on ticket revenues, Fitch will review the history of a football club over the past 10–30 years, with particular focus on its league position and the effect on ticket prices and the stadium occupancy rate. The history of the club in terms of ticket sales and prices in different league positions will be taken into account in applying stresses, but recent evidence of the effect of relegation may be unlikely for one of the leading clubs. In this case, stresses will be based on the experiences of other clubs relegated in more recent years. Some clubs, which are notable for having a very loyal local following, may be stressed less in terms of match attendance.
Similar to U.S. transactions, Fitch will generally use a historical occupancy/attendance average of the stadium as a floor for attendance and create a stress scenario that will apply a steady fall in the premier league position from its most recent performance and, given the long term of these transactions, a relegation scenario one or more times during the life of the transaction for one or more years on each occasion. Fitch will then assess the effect of declining ticket revenues on the transaction’s ability to service the debt. A club that has occupied a high league position over a long period of time or has never been relegated into a lower league will provide guidance in assessing the future financial performance of the club.
Television Contracts
Although generally a less important source of revenue than ticket sales, certainly as compared with U.S. sports, television/media contracts are still crucial to the financial success of a club. Contracts have historically been renewed every 3–4 years, and recent experience has been that significant increases have been achieved with new contracts. This provides Fitch some comfort that future negotiations would be positive, although, there is no certainty the value of future broadcasting contracts will be of equal or greater value. Consequently, Fitch generally will assume minimal, if any, increases in renewal amounts.
The split of media revenues varies from country to country. In England, approximately 50% of the revenues is shared equally across the top 20 premier league teams, 25% is shared by reference to the number of games of a particular club that are televised (inevitably a larger share for the more successful and more widely supported clubs) and the remaining 25% is split by league position on a sum of the digits basis (i.e., the top club receives 20/210th, the bottom team 1/210th). Similar to ticket receipts, there is a built-in bias toward the larger and more successful clubs, thus consolidating their ability to remain larger and more successful.
The broadcasting rights in English football are contracted on a pool basis (i.e., the contracts are negotiated by Football Association [FA], the governing body, on behalf of all the clubs). The revenue is then shared among Premiership League teams according to the above formula. However, as noted, there is a built-in bias toward the larger clubs. This is regarded as a necessary in order to prevent each club from negotiating its own contracts and creating a more size-biased distribution.
Fitch notes the key difference in the distribution of national broadcast revenues in Europe, as compared with the United States, is that the four major sports receive an equal distribution of national broadcast revenues. While this provides some revenue certainty, locally generated media outlets can vary between large and small market teams. Given this key difference, Fitch typically assumes that a club’s share of broadcasting revenue decreases in line with the formula set out above as it moves down the league table. Fitch will create a stress scenario by applying a steady fall in the premier league position from its most recent performance and, given the long term of these transactions, a relegation scenario one or more times during the life of the transaction and for one or more years on each occasion. Again, the extent of the decrease will be based on the experience of relegated clubs in the past. Fitch will then assess the effect of media and other revenues on the transaction’s ability to service the debt.
Sponsorship and Advertising Agreements
The wide appeal of football has seen a huge growth over the past decade in terms of advertising and sponsorship revenue. Similar to the growth in broadcast contracts, sponsorship and advertising agreements, for clubs in comparable league positions, have experienced similar growth. While sponsorship and advertising agreements are usually negotiated on a club-by-club basis with clubs with the biggest fan bases and stadiums commanding the best deals, sponsorship and advertising agreements are key to each club’s financial existence.
Other revenues, such as merchandising, have historically followed similar patterns, but many clubs have developed more sophisticated approaches to exploiting the potential for increasing match day revenues and sales via the Internet to, in many cases, a worldwide audience. The clubs with the bigger grounds also have the ability to use their corporate hospitality facilities on nonmatch days for conferences, weddings, etc. Only this latter source is likely to be delinked from on-the-field performance.
Fitch generally takes a similar approach to creating stress scenarios for sponsorship and advertising, as compared with ticket sales and broadcast revenues, whereby a team performance and league standings are analyzed. Stressed sponsorship revenues will typically follow the terms of the contracts, which often contain reductions for poor performance. In the event that a sponsorship contract expires during a period of relegation, Fitch would assume renewal at a stressed rate. Other commercial revenues that are likely to be directly linked to team performance will be stressed accordingly.
Player Salary Structure
As noted earlier, there are no salary restrictions in European football. However, salary costs as a percentage of overall turnover are a standard measure of financial prudence, with 55% being the average for an English club. There are, of course, anomalies, particularly where the club has been purchased by a wealthy individual who is prepared to buy success. The notable example is Chelsea in the English League, which was purchased by Roman Abramovich, the Russian oil magnate, in 2003. Since then, the club has purchased several players at huge transfer fees and has the highest wage bill in the country.
In terms of costs, Fitch will review player contracts to see whether a club has some flexibility in managing the overall cost (e.g., by staggering contract maturities so as to be able to take the opportunity not to renew a contact for a particularly expensive player). In reality, the better players will seek a transfer to a more successful club, especially in the event of relegation. So, the decline in costs is, to a degree, inevitable even with careful management. However, Fitch will always assume some lag relative to the decline in revenues. Most other costs are seen as independent of league position, so they will not typically be adjusted.
In addition to adjustment to player salaries when a club is relegated, Fitch will also look for features that restrict the net transfer spend (i.e., cost of new players less proceeds from players sold) and, even in a period of strong performance, restrict the use of transfer fees received for football-related assets, usually new players. In the absence of these features, further stresses will be applied.
Relationship Between League and Players’ Unions
Players’ unions exist within European sports leagues, but their role has little overall financial effect because it tends to be focused on protecting players against harsh disciplinary measures (usually by the league rather than an individual club) and securing appropriate compensation in the event of career-threatening injury. There have been no incidents of strike action in recent years, and Fitch generally views this as a strength of European soccer transactions. Furthermore, given the minimal risks associated with work stoppages, stress scenarios for a club or stadium transaction generally do not incorporate a work stoppage, where, given the history of work stoppages in U.S.-based sports, are applied.
Role of League in Team Financial Matters/Debt Limits
The governing body of the league typically has very limited powers over a club’s financial matters, with the exception of some quite draconian sanctions in the event of a club becoming insolvent. An example is the English Premier League, where a club has 10 points deducted from its total for the season—38 games, three points for a win and one for a draw—which could have the effect of taking the club from midtable to relegation, thus potentially compounding its financial problems yet further.
Another example is the Dutch League, which has similar sanctions for insolvency. The Dutch League does, however, have something of an early warning system in the form of a ranking scale for clubs relating to their financial stability. Those clubs falling below a certain score measured across 12 separate criteria (including liquidity and player costs as a percentage of turnover) are subject to a degree of supervision (e.g., player purchases are subject to approval).
Clubs entering European competitions are required by the European governing body, UEFA, to obtain a license confirming their ability to meet their financial obligations for a period of 18 months.
Although all of these methods of the supervision are somewhat passive, Fitch views them as credit positive for the football industry. The management of a club will have a strong incentive to manage a club cautiously to avoid being ejected from any competitions.
[Ed. Note: See Table 4 for characteristics of a typical Fitch analysis for sports facilities.]
DETERMINANTS OF FRANCHISE VALUES
DETERMINANTS OF FRANCHISE VALUES IN NORTH AMERICAN PROFESSIONAL SPORTS LEAGUES: EVIDENCE FROM A HEDONIC PRICE MODEL
Brad Humphreys and Michael Mondello
INTRODUCTION
There has been a recent increase in scholarly research on the determinants of professional sports franchise values. This research is limited by the fact that the fundamentals used to value typical businesses are not readily available for North American professional sports teams, which are privately held corporations and do not release audited financial data to the general public. In addition, a distinguishing characteristic differentiating sport franchises from traditional businesses is their dependence on intangible assets. These intangible assets, including player contracts, television rights, stadium agreements, and relationships with fans, are important factors contributing to the overall financial status of professional sports teams. Although intangible assets are present within traditional businesses, tangible assets such as plant, property, and equipment are generally considered the drivers of valuation.
Despite anecdotal evidence primarily filtered through the mass media reporting imminent bankruptcies and claims of individual team owners losing significant dollars, few professional sports teams in North America have been forced into bankruptcy, and only a few empirical studies examining the determinants of franchise valuation exist. This study adds to the existing research by identifying factors associated with franchise valuation.
Table 4 Characteristics of a Typical Fitch Analysis for Sports Facilities to Achieve Investment-Grade Ratings
| Fitch Base Case | Fitch Stress Case | |
| Construction Simple Project | ||
Cost | 0%–5% overrun | 5%–10% overrun |
Schedule | 0–3 month delay | 3–6 month delay |
| Complex Project | ||
Cost | 0%–10% overrun | 10%–20% overrun |
Schedule | 3–12 month delay | 6–24 month delay |
| Attendance | ||
Established | 5–15 year historical average | (Base case) — (10%–15%) |
New Facility | 10–15 year historical average | (Base case) — (10%–15%) |
| Suite and Premium Seat Renewal Rates Established | ||
Staggered Lease Agreements | CPI + (50 bps–100 bps) | CPI – (50 bps–100 bps) |
Nonstaggered Lease Agreements | CPI – (0 bps–50 bps) | CPI – (50 bps–150 bps) |
| New Facility | ||
Staggered Lease Agreements | CPI + (50 bps–100 bps) | CPI + (50 bps–100 bps) |
Nonstaggered Lease Agreements | CPI + (50 bps–100 bps) | CPI + (50 bps–100 bps) |
| Sponsorship and Advertising Revenues | ||
Established | 5–15 year historical average | (Base case) — (50 bps–100 bps) |
New Facility | 10–15 year historical average | (Base case) — (50 bps–100 bps) |
| Other Revenues | ||
Established | 5–15 year historical average | (Base case) — (50 bps–100 bps) |
New Facility | 10–15 year historical average | (Base case) — (50 bps–100 bps) |
| O&M Growth | ||
Established | 5–10 year historical average | (Base case) — (50 bps–100 bps) |
New Construction | 10–15 year historical average | (Base case) — (50 bps–100 bps) |
| Financial Ratios (×) Established—Minimum DSCR | ||
Contractually Obligated Revenue | 1.50–1.75 | 1.20–1.45 |
Total Pledged Revenue | 2.00–2.25 | 1.50–1.75 |
| New Facility—Minimum DSCR | ||
Contractually Obligated Revenue | 1.75–2.00 | 1.45–1.70 |
Total Pledged Revenue | 2.25–2.40 | 1.75–2.00 |
| Reserve Levels | ||
Debt-Service Reserve | Six-month minimum | Six-month minimum |
Operations and Maintenance | 3–6 month minimum | 3–6 month minimum |
Strike Reserve | Single anchor tenant facility. In addition to debt-service reserve, additional six-month reserve prior to the signing of a CBA | Single anchor tenant facility. In addition to debt-service reserve, additional six-month reserve prior to the signing of a CBA |
Capital Expenditure Reserve | Buildup over initial 10 years | Buildup over initial 10 years |
| Other | ||
Lease Agreement | At a minimum for a term equal to the term of bonds | At a minimum for a term equal to the term of bonds |
Term | 20–25 year maximum debt term | 20–25 year maximum debt term |
CPI—Consumer Price Index. bps—Basis points. DSCR—Debt-service coverage ratio. CBA—Collective bargaining agreement. 1. Suite and premium seat renewal rates are for existing and new facilities with a waiting list; base- and stress-case scenarios may not include reduction amounts. 2. Other revenues are noncontractually obligated and dependant on attendance levels, which include parking revenues, concessions revenue that is not guaranteed by the concession provider, novelty revenues and ticket revenues. 3. A peer analysis is also incorporated into Fitch’s assumptions and may affect ranges.
Source: Fitch Ratings. Reprinted by permission of Fitch, Inc.
In one of the first empirical studies of professional sport team values, Alexander and Kern (2004) examined the effects of team classification, relocation, and the impact of a new stadium on franchise values in the National Football League (NFL), National Basketball Association (NBA), National Hockey League (NHL), and Major League Baseball (MLB). Variables including market size, team performance, and the presence of new stadiums were all found to increase a team’s franchise value. Furthermore, playing in a new stadium increased MLB team values an average of $17 million; however, NBA team values increased only by $6.6 million. In addition to the impact of a new stadium, teams using a regional identifier, for example the Tampa Bay Devil Rays (a team identified with a single city) as compared to the Florida Marlins (a team identified with a larger region, the entire state of Florida) had increased franchise values in MLB but not in the other three leagues. Alexander and Kern (2004) posited that this finding may be attributed to the fact that other leagues have institutional policies, like revenue sharing, in place, minimizing any differences among the teams.
….
Finally, Miller (2007) analyzed MLB panel data from 1990 to 2002 and found teams playing in new stadiums demonstrated an increase in franchise value after controlling for team quality and city demographic differences. Furthermore, Miller (2007) found that teams playing in private stadiums had higher franchise values compared to teams playing in public stadiums, although this difference was insufficient to cover the average construction cost of the stadium.
… In this paper, we examine the fundamental determinants of franchise sale prices. Although a large number of anecdotal sources have addressed this phenomenon, only a few empirical papers have examined franchise valuation thus far. Fort (2006) found relatively high variation in the appreciation of franchise values over time but did not examine the relationship between fundamentals and sale prices. Similarly, Alexander and Kern (2004) reported that market size, on-field performance, and new facilities were associated with higher franchise values over the period 1991–1997.
METHOD
Several empirical approaches for analyzing changes in the prices of fixed assets like houses and real estate exist. These methods have been used to analyze changes in the prices of assets like art (Beggs & Graddy, 2006; Goetzmann, 1993), wine (Burton & Jacobsen, 2001), and antique furniture (Graesner, 1993). We apply one of these techniques, hedonic price index method (HPI), to the analysis of the prices paid for professional sports franchises.
The hedonic price framework was first proposed by Rosen (1974). The hedonic method uses variation in observable characteristics of an asset, in this case a professional sports franchise, to explain observed variation in the sale price of that asset. The parameters on the variables capturing the characteristics can be interpreted as hedonic prices of those characteristics.
….
DATA
….
We analyze franchise sale prices over the period 1969–2006. Note that we are not using the estimated franchise values reported annually in Forbes magazine; we restrict our analysis to only reported franchise sales prices. We restrict our sample to the post-1969 period because no annual metropolitan area economic data exist before this year, and market characteristics may affect franchise sales prices. Many franchise sales are fractional—an individual or group of investors buys a portion of a professional sports franchise. Following the method used by Fort (2006), we converted all fractional sales to full value. So if 50% of a franchise was sold for $10 million dollars, we count the estimated franchise value as $20 million dollars.
… Collectively, there were 184 sales of existing franchises during the sample period across the four leagues. Specific to these 184 sales, 63 occurred in MLB, 51 in the NBA, 35 in the NFL, and 35 in the NHL.
Table 5 contains summary statistics on the franchise sales over the sample period, in current dollar or nominal terms. Research on the sale price of houses, art, and other assets typically works with nominal prices rather than real prices to avoid bias introduced by the deflation process and to make the results comparable to the nominal rate of return on other traded assets like stocks and bonds. We follow this convention in this paper.
The NFL franchises possessed the largest mean sale price, and NHL franchises the smallest. Moreover, NBA franchise sale prices were more volatile than other leagues; NHL franchise sale prices the least variable. The largest price paid for a sports franchise in the sample was $2.125 billion, paid for the New York Knicks in 1997. Although this transaction would appear to be an outlier, additional examination revealed this transaction also included their home facility Madison Square Garden, a 19,763-seat arena in midtown Manhattan that is the largest revenue-generating sports venue in the world. Likewise, the largest price paid for an NFL franchise was $1.0 billion, paid for the Washington Redskins in 2003, and that transaction included the 80,000-seat stadium in which the Redskins played, named FedEx Field. The largest price paid for a MLB franchise was $700 million, paid for the Boston Red Sox in 2002, including Fenway Park and an 80% ownership interest in a regional sports television network, the New England Sports Network. Lastly, the largest price paid for an NHL franchise was $250 million, paid for the Philadelphia Flyers in 1996. Undoubtedly, ownership of a stadium or arena had a signifi-cant effect on the sale price.
Table 5 Nominal Sale Prices 1969–2006
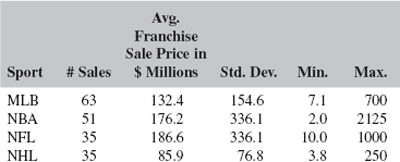
Source: International Journal of Sport Finance. Used with permission from Fitness Information Technology.
The franchise sales were evenly distributed over the sample period. For example, 44 transactions occurred between 1969 and 1979, 49 took place in the 1980s, 54 in the 1990s, and 37 since 2000. Only 3.3% of the sales involved a move of the franchise from one city to another, and 18.5% of the transactions involved both a team and a sports facility. Seven percent of the transactions (15 in total) involved franchises located in Canada. These transaction prices were converted to U.S. dollars at the exchange rate at the time of the transaction.
Our final data set consisted of 184 franchise sale prices from the four major professional sports leagues in North America over the period 1969–2006. We augmented these data with additional variables capturing the ownership of the facility the team played in, the success of the team on the field, the age of the franchise and facility, and market characteristics like metropolitan area population and the number of other professional sports franchises in the metropolitan area. Note that NHL standings are based on points, not wins, so NHL team performance, unlike NFL, NBA, and MLB performance, is not based on winning percentage. For the NHL, we estimated winning percentage by dividing the number of points earned in each season by 162, the maximum number of points possible in an 81-game season. This transformation makes NHL on-ice success comparable to the other three leagues while still preserving the relative within-season and across-season relative standings of NHL teams.
RESULTS
….
[T]he average price of NBA franchises is equal to the average price of an MLB franchise, and the average price of an NHL franchise is lower than a MLB franchise. NFL franchises are the most expensive, and NHL franchises are the least expensive.
Franchises in larger markets command a premium, probably because of the larger revenue potential. The parameter on the log of the metropolitan area population can be interpreted as elasticity in this setting, and the parameter estimate suggests that for each additional 1% increase in the metropolitan area population the franchise sale price increases by 0.67%. Both Alexander and Kern (2004) and Miller (2007) found metropolitan population to have a positive effect on franchise values. Teams owning their facility also command a premium, and the franchise age also carries a positive hedonic price. Team buyers are effectively buying the history of the team, and the longer the team has been in existence, the more team history there is to buy. The age of the facility the team plays in has no effect on franchise sale prices. Recent on-field success, as measured by the average winning percentage in the five seasons before the sale, also had no effect on sale prices. These three results differ from Miller (2007), who found that: (a) franchise age had no effect on franchise value, (b) facility age had a negative effect on franchise value, and (c) current and lagged winning percentage had a positive effect on franchise value. Miller (2007) analyzed annual franchise value estimates from MLB; we analyze transaction prices across all four major leagues. Both Fort (2006) and Miller (2007) remarked that the franchise value estimates typically differ from actual sale prices. Since 1990, when the Forbes/Financial World franchise value estimates were first published, there have been 91 franchise sales in the four North American professional sports leagues studied here. On average, the estimated franchise value was $31.6 million less than the actual sale price for these franchises. This average difference obscures some asymmetry in the difference; for 57 of the sales, the estimated franchise value was less than the sale price, with an average difference of $75 million; for 30 of the sales, the estimated franchise value was greater than the sale price, with an average difference of $49 million; in two instances, the 1991 sale of the New York Giants and the 2001 sale of the Seattle SuperSonics, the sale price and the estimated franchise value were identical.
These differences in parameter estimates help identify why the Forbes franchise estimates differ from actual sale prices. Based on Miller’s (2007) results, the annual franchise value estimates depend more on facility and on-field success, and the sale prices depend more on franchise and market characteristics. Our results suggest that facility age and on-field success have no effect on sale price. Miller’s (2007) analysis of estimated franchise values suggests that on-field success and facility age systematically affect estimated franchise values. Thus, one reason for the systematic difference between the estimated franchise values and actual franchise sales price is that the estimated franchise values take into account on-field success and facility age while franchise buyers do not.
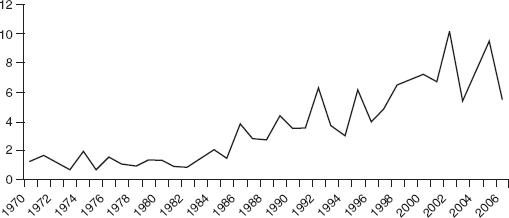
Figure 9 Quality-Adjusted Franchise Price Index 1970–2006
Source: International Journal of Sport Finance. Used with permission from Fitness Information Technology.
… It appears team success does not have an important hedonic price in this setting.
The higher the number of competing professional sports teams in the metropolitan area, the lower the franchise sale price, other things being equal. This result is consistent with the idea that other professional teams in the metropolitan area are competitors, and the presence of more competitors reduces the franchise sale price, holding other market characteristics like metropolitan population constant.
….
First, the quality-adjusted price index has increased steadily over the sample period. Despite some short-term downturns in franchise prices, the quality-adjusted price of an average sports franchise has increased steadily over the past 38 years. It is difficult to reconcile this increase with the periodic claims of large and persistent losses incurred by team owners. If professional sports teams consistently lose money, why does the quality-adjusted price index continue to increase?
Second, based on Figure 9, it is difficult to incur a capital loss on the purchase of a professional sports franchise. The average annual increase in the quality-adjusted franchise price was 16% over the sample period, a nominal rate of return far exceeding the annual 3% per year rate of return used by Fort (2006) as a comparison. Based on this price index, a generic sports franchise bought for $5 million in 1970 and held for 35 years would have been worth $48 million in 2005, holding quality constant over the period. However, the quality-adjusted price index on Figure 9 does exhibit quite a bit of variation, and there are several years with a negative rate of return on the average franchise value.
The average rate of increase also varies considerably by decade. The average annual increase was 21% from 1969 to 1979, 23% in the 1980s, 13% in the 1990s, and just 4% after 2000. It is useful to compare these numbers with the decade-by-decade unconditional results in Fort (2006) for MLB. Fort reports a 5.3% increase for the 1970s, 9.5% for the 1980s, and 3% for the 1990s, based on unconditional repeat sales for specific MLB franchises. Fort’s decade-by-decade annual growth rates are lower because he focused on a single sport and his increases do not hold franchise quality constant over the period. These results suggest that a buyand-hold team owner could expect a much larger annual rate of return in an investment in a sports franchise than Fort’s (2006) results.
The lower annual increase in the quality-adjusted price index after 1990 suggests that there may have been an important change in the market for sports franchises in the latter part of the sample period. Fort (2006) also noted the decline in the value of ownership of professional sports teams in the past 10 years, asking of MLB, “Why did the fall off to essentially zero growth rates in the 1990s occur?” Although we have no evidence to point to in this paper, we can rule out a decline in the quality of sports franchises in the past 20 years as the culprit because the decline is also present in our quality-adjusted price index.
SUMMARY AND CONCLUSIONS
In this paper we analyze the evolution of the sales price for professional sports franchises in North America using a hedonic price model. This approach has been used to investigate changes in the price of other assets like residential real estate, art, and wine. The hedonic price method allows us to identify certain characteristics of sports franchises affecting their sale price and to estimate a hedonic price for each of these characteristics. Our results suggest that the nature of the league, local market size, franchise age, the number of competing professional teams in the market, and the ownership of the facility in which the team plays all have significant hedonic prices, but the team’s on-field success and facility age do not. We construct a quality-adjusted price index for an average professional sports franchise. The average annual rate of increase of this index is over 20% over the period 1969–2006, signifying owners of professional sports teams earned significant capital gains over the period. This estimated increase in franchise prices is also significantly larger than previously reported in the literature, suggesting sports team owners have financially benefited, even better than previously thought, over the past 38 years.
The results in this paper have several important limitations. First and foremost, the results of the hedonic model estimation depend critically on a properly specified model. If we have failed to include important indicators of franchise quality in the empirical model, then the quality-adjusted price index will be biased and may not reflect the actual benefit from owning a professional sports team. Also, we have pooled team sales prices across leagues in order to increase the efficiency of our estimates of the parameters of the hedonic model. If there are important differences in the changes in franchise values across leagues that are not captured by our league-varying intercepts, then our results will be affected. Unfortunately, our sample contains only about 25 observations for some individual sports, making specification tests by sport difficult.
Our results also suggest potential areas for further research. The franchise sales data analyzed here can also be analyzed using other techniques. Foremost among these is the repeat sales method developed by Case and Schiller (1989). This method has the advantage of placing much less emphasis on model specification. Also, the decline in the annual increase in the quality-adjusted franchise price index beginning in the 1990s deserves more attention. Researchers with access to additional franchise sale data from the 2000s should further investigate the nature and causes of this change. Specifically, additional research could accurately determine if this reduction in franchise appreciation represents a permanent trend or if this was just a transitory period in team ownership values.
References
Alexander, D. L., & Kern W. (2004). The economic determinants of professional sports franchise values. Journal of Sports Economics, 5(1), 51–66.
Beggs, A., & Graddy, K. (2006). Failure to meet the reserve price: The impact on returns to art. University of Oxford Department of Economics Discussion Paper number 272.
….
Burton, B. J., & Jacobsen, J. P. (2001). The rate of return on investment in wine. Economic Inquiry, 39(3), 337–350.
Case, K. E., & Shiller, R. J. (1989). The efficiency of the market for single family homes. American Economic Review, 79(1), 125–137.
Fort, R. (2006). The value of Major League Baseball ownership. International Journal of Sport Finance, 1(1), 9–20.
Goetzmann, W. N. (1993). Accounting for taste: Art and the financial markets over three centuries. American Economic Review, 83(5), 1370–1376.
Graeser, P. (1993). Rate of return to investment in American antique furniture. Southern Economic Journal, 59(2), 817–821.
Miller, P. A. (2007). Private financing and sports franchise values: The case of Major League Baseball. Journal of Sports Economics, 8(5), 449–467.
Rosen, S. (1974). Hedonic prices and implicit markets: Product differentiation in pure competition. Journal of Political Economy, 82(1), 34–55.
….
THE ECONOMIC DETERMINANTS OF PROFESSIONAL SPORTS FRANCHISE VALUES
Donald L. Alexander and William Kern
During the past several decades, professional sports have undergone tremendous changes relative to earlier eras. We have seen changes in the location of teams, ownership, the structure of labor/management relations, the names of teams, the emergence of corporate ownership, a stadium building boom, and the sale of stadium naming rights, just to name a few examples. The economic impact and rationale for these changes have been the fodder for recent research by sports economists. Analysis of the economic incentives motivating team relocation and new stadium construction has generated considerable attention. Economists have explored the underlying rationale for the movement of franchises and the building of new stadiums, and have attempted to measure the effects of these changes on outcomes such as the amount of employment and economic growth generated in local and regional economies.1
In this article, we take a different perspective on several of these changes noted above. We examine them from the standpoint of their managerial efficiency—the payoff derived from these strategies for the firm/team rather than the economy as a whole. That is, we attempt to assess the value or payoffs derived from several management strategies commonly employed by team owners during the past several decades. The values of some of these strategies are readily ascertained. For instance, it is easy to determine the value of the decision of any franchise to sell the naming rights to their stadium. There is a market for such rights and they go to the highest bidder. The price those rights command (which are commonly public knowledge) are additions to the franchise’s revenue stream, and their effect on the value of franchises is a clear indication of the payoff to this strategy.
Although the payoff to some of these strategies is less obvious, they presumably (certainly the owners expected them to) have a positive effect on franchise value. For instance, when Bud Adams relocated the Houston Oilers to become the Tennessee Titans, and when Bill Bidwell renamed the Phoenix Cardinals the Arizona Cardinals, and when the Baltimore Orioles built Camden Yards, we can presume that they did so because they felt these decisions would enhance the value of their franchises. The questions that arise and that we seek to answer in this article are whether in fact franchise value is positively enhanced by such strategies and, if so, to what magnitude? What is the incremental value of choosing a regional as opposed to a city-specific identity for your team? What are the effects of team relocation and new stadium construction on franchise values?
AN OVERVIEW OF PROFESSIONAL SPORTS NOMENCLATURE
In the four American professional sports leagues (baseball, basketball, football, and hockey), teams are named either for the city in which they are located (e.g., Miami Dolphins, Los Angeles Dodgers) or in reference to a much broader geographic area (e.g., Florida Marlins, California Angels).
To our knowledge, there has been no formal analysis examining whether having a regional identity rather than a city identity has any effect on a franchise’s economic value. One might argue that if it did matter, then we would expect to see more team owners adopting regional names if it was perceived to be profitable or changing their identities from regional ones if it were perceived to be less profitable than having a city name. We agree in part. We recognize, however, that this is not a simple decision but a more complex calculation that is likely to be affected by considerations such as tradition and the source of funding for stadium construction, as well as the size of the prospective marketing area (i.e., fan base) and cable television market targeted by the team owners.
In this article, we compiled franchise value data for teams in Major League Baseball (MLB), the National Basketball Association (NBA), the National Football League (NFL), and the National Hockey League (NHL). In the empirical analysis described below, we treated each league separately because each has different rules and traditions that affect each franchise’s economic value. For example, MLB is exempt from antitrust laws, whereas the other leagues are not. In addition, the extent of revenue sharing varies across leagues as well. For instance, ticket revenues are shared between the home and visiting teams on a 100-0 basis in the NBA and NHL, on an 85-15 basis [formerly] in MLB, and on a 60-40 basis in the NFL.2 Thus, we believe that it is plausible to consider the leagues as different samples. We can also gain additional insight when we compare some of the trends that have emerged in each of the four professional sports.
Table 6 presents an overview of the situation in each of the four major professional sports leagues. The data summarized in this table span the period from 1991 to 1997. These data show that the number of teams with regional identities is evenly distributed across MLB, the NBA, the NFL, and the NHL. The interesting feature is that different teams in the same location have adopted regional identities, as indicated by the following clustering in certain cities: the Minnesota Twins (MLB), Minnesota Timberwolves (NBA), and Minnesota Vikings (NFL) in Minneapolis;3 the Colorado Rockies (MLB) and Colorado Avalanche (NHL) in Denver; the Tampa Bay Buccaneers (NFL), Tampa Bay Lightning (NHL), and Tampa Bay Devil Rays (MLB) in Tampa;4 the New Jersey Nets (NBA) and New Jersey Devils (NHL); and the Florida Marlins (MLB) and Florida Panthers (NHL) in South Florida. This commonality can be explained in a number of different ways. For example, the Minnesota situation may reflect an implicit compromise between the Minneapolis and St. Paul fans, or it could be an attempt to attract a larger fan base beyond the twin cities. Similarly, the Tampa Bay example may reflect an attempt to draw fans from the greater Tampa, St. Petersburg, and Clearwater communities. The Florida situation is quite similar. In contrast, the New Jersey situation appears to be an attempt to separate itself from New York, but with greater appeal than might be generated by naming the team for Newark or East Rutherford. Indeed, the New Jersey situation may simply reflect a Hotelling-like equilibrium in which competitors achieve some minimal level of product differentiation at the margin while at the same time attempting to maintain a monopoly on the inframarginal consumers.
Table 6 Descriptive Analysis
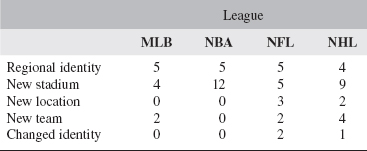
Source: Authors’ calculations and Keating (1999). Reproduced from Journal of Sports Economics. Used with permission.
Note: MLB = Major League Baseball; NBA = the National Basketball Association; NFL = the National Football League; NHL = the National Hockey League. The following lists the teams with regional identities: MLB (California, Colorado, Florida, Minnesota, and Texas); NBA (Golden State, Indiana, Minnesota, New Jersey, and Utah); NFL (Carolina, Minnesota, New England, Arizona, and Tampa Bay); and NHL (Colorado, Florida, New Jersey, and Tampa Bay). We recognize that several of these regional identities have changed since the end of our sample period in 1997.
Another interesting feature of these data is the relatively few situations (at least during our sample period) in which teams have changed their identities. Two are particularly noteworthy and merit some discussion. The first involves the Phoenix Cardinals (NFL) changing their identity to the Arizona Cardinals. This is an example in which team owners have adopted a regional identity, perhaps trying to establish a broader fan base beyond the Phoenix area. The second involves the change that occurred when the Minnesota North Stars (NHL) moved to Dallas. Instead of changing the name to the Texas North Stars, the owners adopted Dallas Stars as the new team name. This contrasts with the Phoenix situation in which the owners chose to use a regional identity, whereas the owners of the Stars chose to use a city-specific identity. [Ed. Note: Subsequently, the Anaheim Angels changed their name to the Los Angeles Angels of Anaheim after withstanding a legal challenge to the change brought by the City of Anaheim.]
These data also illustrate several other features of professional sports. First, there was expansion in three of the four leagues as several new teams were formed. In our sample, the new teams were formed mainly in California and Florida. Second, several existing teams changed locations. In the NFL, the Cleveland Browns moved to Baltimore, the Los Angeles Rams moved to St. Louis, and the Los Angeles Raiders moved back to Oakland. Third, there were a considerable number of new stadiums or arenas built during our sample period, which represents a trend that has continued into the new century. With the exception of new stadium construction, these changes were confined to MLB, the NFL, and the NHL.
THE EMPIRICAL MODEL
The sample consists of a pooled, cross-sectional, time-series panel of team specific data for each of the four major professional sports leagues. Each sample spans the period from 1991 to 1997 and includes data for only U.S.-based franchises…. We used the franchise value for each team as the dependent variable. Financial World (FW) magazine reported these data annually for MLB, NBA, NFL, and NHL.5 In general, these data represent FW’s estimate of the present discounted value of the team’s net revenue stream at a point in time. We acknowledge that these are only crude estimates and are not determined in organized financial markets through the interaction of supply and demand. Nevertheless, there has been a reasonable attempt to estimate the net revenue flow for each team. For example, revenue estimates are based on gate receipts, television contracts (national and local including cable), concessions, parking, venue advertising, naming rights, licensing, and merchandising. Cost estimates are based on player costs, pensions, travel, marketing, administrative, and media expenses. Moreover, we compared the estimates reported in FW to the prices paid for various franchises sold during the sample period, and several conclusions emerge from this informal comparison.6 First, the FW estimates were typically lower than the reported transaction prices but always within an order of magnitude of the sales price. Scully (1995), however, argues that the premium paid for various franchises may simply reflect the “winner’s curse” in the bidding competition for that franchise, especially for teams with good reputations. Second, in many instances it appeared that FW adjusted the franchise value estimate in the following year, and this may simply reflect the fact that the FW estimates were published before the franchise sales were consummated. Third, this pattern did not appear to vary across the four professional sports, which leads us to believe that if there are any biases in the FW procedure used to compute those estimates, those biases will affect all the estimates within the sample….
[The following anticipates] the various factors that are likely to influence the determination of a team’s franchise value.8 On the demand side, we use real, per-capita income (INCOME) to control for differences in ticket demand that will affect a team’s revenue and, hence, franchise profitability. We anticipate a positive sign for this variable. We also include a city’s population (POP) to control for market-size effects on franchise profitability. Generally, we expect that teams located in larger markets will be more profitable than teams located in smaller markets, ceteris paribus.9 The major reason is that large market teams have a larger potential fan base to support their franchises. In addition, large market teams are in a better position to negotiate lucrative cable television contracts if for no other reason than the advertisers, who pay premium rates to the local cable service provider, would gain exposure to a large number of potential customers.10
Team performance during the season is another factor that will likely affect demand and, hence, franchise value.11 In this case, we used team’s final standings from the previous season (PLACE) to control for this influence. We expect a negative sign for this variable because as team performance worsens (e.g., first to fourth), revenue will likely decrease. The reason may be that the team’s reputation is diminishing (Scully, 1995), which is diminishing the franchise value, or it simply may be that some season ticket holders are less likely to renew their season tickets (Salant, 1992), which is also likely to reduce profitability.
….
We also included several indicator variables to account for other factors that will likely affect a team’s profitability. The first is … if a team has what we characterize as a regional identity …. We anticipate a positive sign for this variable. For example, a regional identity (e.g., Tennessee Titans instead of the Nashville Titans) may represent an appeal to a larger geographic fan base, which will enhance a team’s profitability, ceteris paribus. If this is the case, then we should see more teams adopting regional type identities whenever possible. We recognize, however, that tradition may well interfere here and significantly restrict an owner’s abilities to carry out such a strategy. For instance, it is hard to imagine the Cleveland Indians becoming the Northern Ohio Indians or the Green Bay Packers becoming the Wisconsin Packers. The creation of a regional identity is more easily accomplished and, therefore, more likely when a team changes location or when a new franchise is created through league expansion.
A regional identity could also possibly arise as a consequence of the nature of the financing that has been employed as part of the package used to lure a team to an area. When taxpayers from across the state are compelled to pay taxes to build arenas and stadiums, there may arise a sort of stakeholder effect whereby citizens of that state feel as though they have some claim on that team. The team may therefore feel obligated to adopt a state or regional identity to appease potential fans. Leeds and von Allmen (2002, p.172) argue that the common practice during the 1962 to 1991 period of naming stadiums after the municipalities in which they are located could be traced to the fact that the cities were paying for the new stadiums.
In our opinion, the creation of a regional identity appears much more likely to be undertaken as a marketing strategy rather than a quid pro quo for a new stadium or team. An examination of the recent history of new stadiums, team relocation, and league expansion indicates that franchise owners certainly do not need to adopt a regional identity to get a new stadium deal or attract a team. Of the total of 62 new stadiums constructed, renovated, or in the planning phase during the period from 1994 to 2004, only 21 were even partially funded by state governments. Sixteen of those 21 funded by state governments were built or are being built for franchises with city identities. Of the remaining 5, 1 is the New England Patriots, who adopted a regional identity in 1971 (and also built their old stadium at their own expense), and 2 carry the regional identity of Tampa Bay.12
The second indicator variable is … if the team is playing in a new stadium or arena…. The construction of new stadiums or arenas marked the 1990s as team owners sought new financial arrangements and revenue sources and local governments sought to keep the home team from moving to a new location.13 We anticipate that this variable will have a positive and permanent effect on franchise value during the stadium’s economic life because it affords owners additional revenue generating means such as luxury suites and enhanced concession revenues.
The third variable … is a measure that attempts to account for the effect of a change in a franchise’s location…. [T]he effect of a new location will have a positive but diminishing effect on franchise value. Hamilton and Kahn (1997, p. 253) note that several authors have hypothesized the existence of a “honeymoon effect” on attendance following a team’s movement to a new location or construction of a new stadium. They report that the accepted wisdom is that this effect begins to fade after about 3 years and is zero after 8 years.
Closely related to this third variable is the case in which a team changes location and changes its identity as well. For example, when Art Modell moved the Cleveland Browns to Baltimore, he changed the team’s nickname from the Browns to the Ravens …. Again, we anticipate that this factor will have a positive but diminishing effect on a team’s value. The fifth … is the year the team enters the league … Here we seek to account for the effect of the “newness” of the team. We hypothesize that a new team has a sort of novelty that exerts a significant effect on fan interest in the first few years of its existence.14
THE EMPIRICAL RESULTS
… For all four leagues, the empirical model performed well and as we anticipated. [See Table 7.] For example, the results indicate that population differences (POP) have a positive effect on franchise values in three of the four leagues. Not unexpectedly, it is insignificant in the NFL model and this may reflect the fact that the NFL’s extensive system of revenue sharing among its teams minimizes any market-size effects arising from population differences across cities. The results also show that team performance (PLACE) matters, as this variable has the expected negative sign and is significant at conventional levels in all four models.
In the MLB sample, there were no teams that changed locations or their identities and, consequently, we did not include NEWLOC and CHGID in the MLB model. However, there were several new teams that joined the league and several that moved into a new stadium. The results show that there was no significant difference between new teams (NEWTEAM) and established teams in terms of average franchise values. One explanation for this result may be that new teams have yet to establish a strong fan base and lucrative revenue sources to enhance their profitability as compared to the older teams that have been in the league for some time. This may be explained by the fact that in all leagues, previous growth and expansion have already taken the best locations. Expansion during the sample period was generally toward more marginal market areas such as the formation of the Florida Marlins and Tampa Bay Devil Rays. These areas may be classified as marginal because they are smaller in terms of population, income, and, perhaps more important, fan interest relative to some of the older, more established franchises.
By contrast, we did find that teams playing in new stadiums (NEWFACILITY) have, on average, higher franchise values. The plausible explanation for this result is that the new stadium provides the owners with new revenue sources such as the sale or rental of additional corporate boxes and the opportunity to sell the naming rights which, all taken together, increase a team’s franchise value. Indeed, the results suggest that a new facility increases franchise value (in real terms) in MLB by approximately $17 million. One explanation for why NEWTEAM is insignificant while NEWFACILITY is significant is that the teams that are new also are playing in a new stadium as well. Given the construction of the empirical model, it is quite possible that we are unable to separate the effects for those teams that are new and playing in a new stadium.17
Table 7 Ordinary Least Squares (OLS) Regression Analysis of Professional Sports Franchise Values (Dependent Variable = Franchise Value)
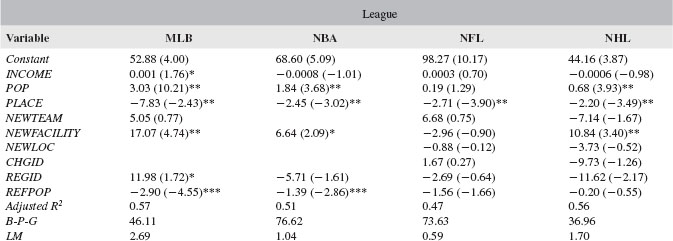
Source: Journal of Sports Economics. Used with permission.
Note: MLB = Major League Baseball; NBA = the National Basketball Association; NFL = the National Football League; NHL = the National Hockey League. The t values are in parentheses. The regression estimates were obtained using the HECTOV (and AUTCOV in MMLB regression) procedure in SHAZAM. The Breusch-Pagan-Godfrey (B-P-G) test statistic and the Lagrange multiplier (LM) test statistic were computed before correcting for heteroscedasticity. The results for the year fixed effects are available on request.
*Five percent significance level (one-tailed) = 1.65 **One percent significance level (one-tailed) = 2.33. ***One percent significance level (two-tailed) = 2.58.
The results also show that teams with regional identities (REGID) have, on average, higher franchise values than teams that do not.18 The coefficient indicates that a regional identity increases franchise value by almost $12 million in MLB. We interacted REGID with population (POP) to test whether the effect of a regional identity varies with market size. We expect that a regional identity would have a larger effect on franchise value for teams located in small market areas. Thus, we anticipate a negative sign for REGPOP and the results support this hypothesis.
In the NBA sample, there were no new teams (NEWTEAM) and no teams that moved (NEWLOC) or changed their identity (CHGID). Thus, we did not include these variables in the NBA model. Nonetheless, the results show that the teams moving into new arenas (NEWFACILITY) did improve their franchise values, ceteris paribus, because this variable is significant at conventional levels. It is interesting that the results indicate that a new facility only increases franchise value (in real terms) by $6.64 million. This is much less than the increase reported for MLB, perhaps because MLB plays approximately twice as many home games as the NBA.
The results indicate that the regional identity variable (REGID) does not help to explain variations in franchise values in the NBA as it did in MLB, except that when it is interacted with population, the coefficient for REGPOP is negative and significant at conventional levels. We interpret this to mean that the effect of having a regional identity does vary inversely with market size. Teams with regional identities that are located in larger markets will, on average, have lower franchise values as compared to teams with regional identities that are located in smaller markets.
The NFL sample is much more mixed than the MLB and NBA samples in terms of teams moving, new teams joining the league, and so forth. The results for the NFL model provide a mixed message as well. The variables NEWTEAM, NEWFACILITY, NEWLOC, and CHGID are all insignificant at conventional levels. We believe there are two primary reasons for why this pattern emerges in the NFL regression results. The first is that the NFL’s system of revenue sharing minimizes any differences in franchise values and, consequently, we are unable to estimate the separate effects of team-specific differences (e.g., teams playing in a new stadium compared to teams playing in an older stadium) given the limited nature of our sample (7 years of data). The second reason is that there may be some correlation among the explanatory variables. For example, teams that have moved to new stadiums may also be new teams or teams that have changed location.
Again, the results indicate that the regional identity variable (REGID) does not help to explain variations in franchise values in the NFL as it did in MLB, except that when it is interacted with population, the coefficient is negative and significant at conventional levels. We interpret this to mean that the effect of having a regional identity does vary inversely with market size. Teams with regional identities that are located in larger markets will on average have lower franchise values as compared to teams with regional identities that are located in smaller markets. We find this result somewhat surprising, given that revenue sharing is intended to minimize differences between small and large market teams.
The NHL sample is also mixed in terms of teams moving, new teams joining the league, and so forth, but the results are similar to the pattern reported for MLB and the NBA. For example, the NEWFACILITY variable indicates that teams playing in new venues have higher franchise values, on average. The results suggest that a new venue increases franchise value by approximately $10.8 million, which is greater than the increase for the NBA but less than the increase for MLB. It is reasonable to expect that the increase is less than the increase reported for MLB, but at the same time it seems puzzling that it would be greater than the increase for the NBA because in many instances the NBA and NHL share the same arenas.
In contrast to the results for the other three leagues, the results for the NHL show that teams with a regional identity (REGID) do not have, on average, a higher franchise value and that the effect does not vary with market size. In the case of the NHL, we believe this reflects the fact the teams with regional identities in our sample are located in what we characterize as marginal or unproven markets. For example, the NHL teams are: Colorado, Florida, New Jersey, and Tampa Bay. Florida is relatively new to the NHL and is located in what many believe is an unproven hockey market. Despite the success on the ice, New Jersey has struggled at the gate and probably because it is competing against the older, more established New York teams. Consequently, it is probably difficult to appeal to loyal Ranger and Islander fans. Tampa Bay is in a situation that is similar to Florida’s situation. It is a relatively new team located in a marginal hockey market at best. Thus, the appeal to draw fans from the greater Tampa area is not likely to have any positive impact, as the evidence confirms. Colorado would appear to be the exception. However, the reader may recall that Colorado previously had an NHL franchise known as the Rockies that moved from Colorado to become the New Jersey Devils in 1982.
….
As we anticipated, income differences will lead to different levels of demand that will affect franchise profitability. Second, population (POP) and team performance (PLACE) also had the expected signs and were significant at conventional levels in all four models. Third, the new facility measure (NEWFACILITY) had a positive and statistically significant impact in all models except the NFL. Again, we believe this may reflect in part the effect of the NFL’s system of revenue sharing, but also the fact that television revenues, which are shared, are relatively more important than stadium revenues.
….
SUMMARY AND CONCLUSIONS
In this article, we examine the economic determinants of professional sports franchise values. The empirical results that we present indicate that market size, team performance, and the presence of a new facility increase a team’s franchise value, as many would expect. Moreover, we find that the use of a regional identity increases franchise value in MLB but not in the other professional sports. We believe this may reflect the fact that the other sports have institutional arrangements that minimize any differences among the various teams unlike MLB. Consequently, this offsets the positive impact of having a regional identity.
The reader may be surprised at the small magnitude of the effects of team relocation, new stadiums, and regional identities on franchise values, given the size of the public subsidies teams often receive and new revenues these changes have generated. But our results are consistent with the claims and observations of Noll and Zimbalist (1997) and Hamilton and Kahn (1997). Noll and Zimbalist argue that although the new stadiums do enhance net franchise revenues, they also raise costs, particularly players’ salaries, which they claim “are roughly proportional to the revenues that they generate,” so that much of the revenue enhancement from a new stadium inevitably goes to players (p. 28). What appears to have happened is that the owners have used the additional revenues derived from the new facilities to bid players away from other teams and, thus, raising the overall pay levels in professional sports. For example, Hamilton and Kahn demonstrate that as a consequence of the Baltimore Orioles’ move to Camden Yards, net revenues increased by $23 million per year, but that allowed them to spend more on players, causing salaries to rise by almost $22 million per year (p. 259). Our results are thus consistent with Noll and Zimbalist’s claim that the players capture a large percentage of the economic rents generated by these changes.
This outcome in which the players capture the additional rents may not necessarily be the only possible outcome. For example, the recent sale of the Washington Redskins and the Cleveland Indians suggests that the former owners may capture some economic rents as well. On the basis of our analysis, it would be difficult to determine how much of the change in franchise value is captured by the players and how much is captured by the owners.
Notes
1. See, for example, Noll and Zimbalist (1997) for a collection of articles investigating these issues.
2. Scully (1995, p. 183, note 22). Television contracts and revenue sharing also vary widely across the four leagues. Whereas the National Football League (NFL) has a lucrative national television contract, Major League Baseball (MLB) and the National Hockey League (NHL) do not.
3. The NHL recently added the Minnesota Wild, although it is not included in our sample.
4. The Devil Rays are also not included in our sample.
5. These data are reported from 1991 to 1997. After 1997, the data were not published until 2000.
6. The franchise sales data were reported in “Most Recent Franchise Sales,” Appendix 2, Sports Facility Reports (Spring 2001), which is published by the National Sports Law Institute of Marquette University Law School (http://www.marquette.edu/law/sports/sfr/sfr21.html).
….
8. Scully (1995, pp. 100-7) argues that teams build reputations that affect their franchise values, and one of the determinants is the team’s winning percentage. The demand for wins is a function of market size, usually measured by the standard metropolitan statistical area (SMSA) and per-capita income.
9. Scully (1995, p. 116) argues that this is the conventional wisdom, except for the NFL, which has an extensive system of revenue sharing that minimizes any market-size differences on profitability.
10. For example, according to the National Center for Policy Analysis, Idea House (http://www.ncpa.org/pd/state/slaugh98c.html), the New York Yankees signed a 12-year, $500 million cable television contract in 1996 and that same year earned $69.8 million from their radio and television contracts.
11. We recognize, however, that high-valued franchises have the financial means to acquire better talent that enhances team performance. This would mean, for example, that franchise value in the year 2000 may affect team performance in 2001, which will then affect franchise value in 2002. But given that we have a relatively short time series, we are unable to construct an econometric model to account for this potential dynamic relationship.
12. These data are derived from Rappaport and Wilkerson (2001), Appendix 2.
13. See Keating (1999) for more details.
14. Alexander (2001) found that expansion teams in MLB experienced a higher demand relative to established teams, but he used a simple dummy variable classification.
….
17. There is some correlation between NEWLOC and NEWTEAM, but it is not perfect.
18. An anonymous referee has pointed out that the REGID variable may be endogenous. Team owners that maximize profit select regional identities because they are perceived to be more profitable. We used the procedure discussed in Greene (2000, pp. 933-934) to determine whether REGID is endogenous, and the results indicate that it is exogenous.
References
….
Hamilton, B., & Kahn, P. (1997). Baltimore’s Camden Yards ballparks. In R. G. Noll & A. Zimbalist (Eds.), Sports, jobs, & taxes: The economic impact of sports teams and stadiums. Washington, DC: Brookings Institution.
Keating, R. J. (1999, April 5). Sports Pork: The costly relationship between major league sports and government. Policy Analysis, 339, 1–33.
….
Leeds, M., & von Allmen, P. (2002). The economics of sports. Boston: Addison-Wesley.
Noll, R., & Zimbalist, A. (1997). Sports, jobs and taxes. Washington, DC: Brookings Institution.
Salant, D. J. (1992). Price setting in professional sports. In P. M. Sommers (Ed.), Diamonds are forever: The business of baseball. Washington, DC: Brookings Institution.
Scully, G. W. (1995). The market structure of sports. Chicago: The University of Chicago Press.
….
THE FUTURE
PROFESSIONAL SPORTS: THE NEXT EVOLUTION IN VALUE CREATION
Jeff Phillips and Jeremy Krasner
The Chicago Cubs and Wrigley Field were acquired by the Tribune Company in 1981 for $20.5 million. [Ed. Note: The team, stadium, and the Cubs 25% stake in Comcast Sportsnet Chicago were sold to the Ricketts family for $845 million in 2009.] … Driving this appreciation was an increase in league-wide revenues, the participation in league-wide ventures like Major League Baseball Advanced Media and a demand for their product that has allowed the team to steadily increase prices. As noted in the chart below [Table 8], this type of historical appreciation is not unusual, but is it reasonable to expect similar appreciation in the future?
To understand how these assets appreciated, one must understand what drives the valuation of a sports franchise. Each year, only a few teams become available, and every sports fan would love to own a team if they had the financial wherewithal. Conceptually, the value of a sports team is more similar to a rare Picasso painting than a typical business. A Picasso has significant value, despite not generating substantial cash flow on an annual basis, because it is rare (in short supply) and many people would like to own one if they could (in high demand).
If supply is low and demand high, one might expect that teams would command similar prices in sale transactions if only the unique nature of the asset determined its value. However, as illustrated in the table below, there has been significant disparity in the valuation of franchises, both within and across the various major leagues.
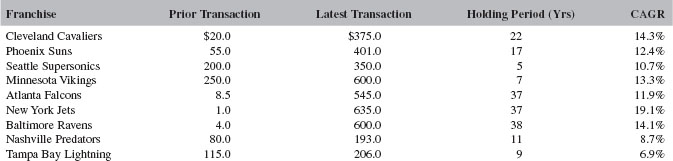
Source: Stout Risius Ross, Inc. Used with permission.
WHAT DRIVES THE DISPARITY IN FRANCHISE VALUES?
At some level, there is the price that is paid to join the “owners club,” with anything above that generally supported by underlying economics. If all revenues within a league were shared equally, valuation ranges of a league’s members would be within a fairly tight band. However, as noted previously, this is not the case. These valuation disparities are driven by significant variations in non-shared revenues.
Sports franchises have experienced significant appreciation during the last several decades. The considerable jumps in franchise values, either collectively within a league or individually, can be tied to certain fundamental changes in economics.
These fundamental changes can impact the valuation of an individual team or an entire league. Leagues with large unexpected increases in broadcast revenues or changes to their fundamental economic structure, such as the NHL’s recent shift to a salary cap, have had changes that impacted the values of all teams within a given league.
On an individual franchise basis, the valuation impact was apparent as teams built new, modern stadiums with the necessary amenities, such as suites and club seats, to generate revenues from premium sources necessary to remain competitive. Teams that built stadiums had a fundamental advantage over those teams that did not have new stadiums. In leagues with salary caps, a new stadium also creates an advantage for the owner (and creates value), as the resulting higher revenue levels do not result in higher player salaries. However, the additional cash flow can be used to service debt, invest in the franchise in other ways (e.g. practice facilities) or pay distributions to the owners.
The majority of teams across the major sports have secured new facility deals that allow them to maximize revenues in their local market. In fact, over the past decade or so, over 50 new stadiums or arenas have been built. Performance can impact these revenue streams as it impacts attendance, but the amenities to generate the incremental revenue streams are in place. The franchises that successfully navigated these trends have reached the point where their ability to materially increase revenues (outside of normal price increases and league-wide ventures) has slowed.
IS THE FUTURE APPRECIATION IN VALUE OF SPORTS FRANCHISES LIMITED?
A quick look at a sports team’s primary revenue categories sheds some light on future growth opportunities:
League Economics—
• National Broadcast Contracts—popularity of league drives rights fees
• Revenue Sharing Policy—shifts dollars to small market clubs
• Salary Cap—provides level of cost certainty
Stadium Economics—
• Luxury Suites
• Club Seats
• Newer stadiums often increase number of suites and club seats
• Other Stadium Amenities—concessions, parking, sponsors and advertising
Market Demographics—
• Market Size
• Corporate Environment
• Increases demand for premium seating, naming rights, sponsorships, etc.
A number of the revenue streams identified above have limited upside potential. A team’s facility revenues are to a large degree constrained by the capacity of their facility and impacted by their ability to increase prices. Increasing prices is easier when the team is winning and the economy is strong. Some of the ancillary revenues (premium seating, advertising and naming rights) can increase based on the overall demand for the product and the health of the corporate environment.
Franchise owners that have maximized their facility revenues must look outside the confines of their stadium or arena to generate significant future appreciation in their franchise.
THE NEXT EVOLUTION IN VALUE CREATION
The major sports leagues and many of their members have effectively evolved, identifying the next opportunity to gain a competitive advantage and capitalizing on it (as illustrated in the chart below). Without identifying the next growth prospect, team valuations may be subject to fluctuations of the market that do not deviate much more than changes in GDP, or best case, increase at rates commensurate with increases in the wealth of likely buyers. Certain leagues still have the ability to positively impact traditional valuation drivers (e.g. broadcast deals and new facilities), but more mature leagues must capitalize on other opportunities to drive future appreciation in franchise value.
WHAT’S NEXT FOR PROFESSIONAL SPORTS?
The creation of value in the next decade or so will be driven by two very different opportunities: (i) the proliferation of large, mixed-use developments in and around facilities that will allow franchises to further maximize their brands and generate incremental revenues; and (ii) the continued expansion of major sports leagues into new markets to drive league-wide revenues to new heights. How successful teams and leagues are in executing these opportunities will determine the valuation landscape in 2020.
The Real Estate Play
More recent facilities focus on providing an entertainment experience and aim to keep “traffic” at the facility before and after the game. While the real estate market has been challenging recently, it continues to pose an interesting growth opportunity for the sports team owner. Leveraging the asset that they possess and extracting value from year-round facility features or the development of the real estate within close proximity to the stadium appears to be the next big domestic opportunity. There are a number of examples that illustrate this point [Table 9].
Real estate development represents an ideal opportunity to expand the reach of the brand into the immediate and surrounding areas and capture incremental revenues that potentially fall outside the definitions of shared revenues. These incremental revenues can provide the owner with the economic advantages to drive investment returns, while funding stadium costs and player salaries. These new revenue streams will also lead to an escalation of franchise values.
Table 9 Examples of Facilities Involving Related Real Estate Opportunities
| Team | Amenities |
St. Louis Cardinals | • Development of a “Ballpark Village” • Approximately $650 million cost • Phase 1: Entertainment, retail and office space • 360,000 square feet of restaurant and retail space • 300,000 square feet of office space • Phase 2: Up to 250 residential units |
Dallas Cowboys | New Stadium in 2009 • Creates one of the largest entertainment venues • Legends Square provides restaurants, shops and other gathering places • Cowboys Experience includes a multi-faceted venue for community activities, fan experiences and tourism |
New York Giants & Jets | New Stadium in 2010 • Atrium consists of a hall-of-fame, team stores, dining and conference space • Future link with $1.3 billion Xanadu retail entertainment complex with over 4.8 million square feet of space, including: • America’s first snow dome for indoor skiing • Luxury hotel and Class A office buildings |
Toronto Maple Leafs & Raptors | Development of Maple Leaf Square with 1.8 million square feet of space • 872 condominiums • A 169 room hotel • 230,000 square feet of office space • 110,000 square feet of retail space with a grocery store, sports bar, and a fine dining establishment • A 1,700 square foot hi-definition theatre broadcasting LeafsTV and Raptors NBA TV around the clock. |
Source: Stout Risius Ross, Inc. Used with permission.
Globalization is not new to the business world or professional sports. However, globalization still presents itself as an opportunity that leagues and teams should continue pursuing to elevate and accelerate revenue growth opportunities. In fact, NFL Commissioner Roger Goodell is quoted as saying “Our goal is to translate America’s obsession into the world’s passion.” The leagues and/or teams that have the highest valuation growth in the next decade will be those that have successfully executed their globalization plans by increasing the number of eyeballs that view or develop a passion for their product. The following chart [Table 10] illustrates the leagues’ current global endeavors. [Ed. Note: For more on globalization issues, see Chapter 3, “Global Leagues.”]
Clearly, the leagues recognize the opportunity. The increased exposure promotes and expands the appeal throughout the world and in turn will drive broadcasting, sponsorship and merchandise revenues, among others. Each league has a current plan and to differing degrees has been successful in the early stage of expanding their reach. For example, MLB’s broadcast agreement with Dentsu has helped drive league-wide revenues, which now approach that of the NFL. NBA. com/China has become the most popular single sports site in China and the NBA is consistently the most searched sports term on Baidu.com, the top search engine in China. The NFL has the longest way to go given its lower international player participation, but at the same time may have the largest opportunity.
Table 10 Globalization Efforts of Professional Sports Leagues
| League | International Movement |
MLB | • International games—Season opening series • Mexico (1999) • Japan (2000, 2004 and 2008) • Exhibition series in China (2008) • World Baseball Classic—Inaugural competition in 2006 with follow-on in 2009 and every four years thereafter • Yankees plan to open an office in China to pursue media and corporate sponsorships • Broadcasting deal with Japanese network ($275 million) |
NFL | • American Bowl Series began in 2005 with preseason games • Regular season games in Mexico and London • Commitment to play 2 regular season international games during the next four years • Buffalo plans to play 1 regular season game in Toronto each of the next five years |
| …. |
NBA | • One of the first leagues to recognize global opportunity • Hong Kong office opened in 1992 • Approximately 20% of all players are of international descent • Yao Ming was the first foreign born player chosen as the overall #1 in the 2002 NBA draft • Formation of NBA China in 2008—will conduct all of the league’s business in Greater China • International revenue growing at double digit rates and approaching 10% of the league’s total revenue • NBA will be seen in over 200 countries and broadcast in over 40 languages • International leagues competing for players |
NHL | • Over 30% of all players are from non-North American countries • This high percentage underscores the potential market that exists for globalization within the NHL • NHL Premiere 2007—Game played in London • NHL Premiere 2008—Will feature games in Prague, Czech Republic and Stockholm, Sweden • International leagues competing for players |
Professional Soccer | • Internationally successful with the greatest global appeal but expanding opportunity to new markets such as North America • Recent large broadcast deals illustrate broad appeal • English Premier League recently negotiated a £2.7 billion contract over 3 years • Scottish Premier League more than doubled its contract to £125 million over 4 years • Introduction of David Beckham to MLS • English Premier League attracting foreign investors • Tom Hicks and George Gillett Jr. purchase of Liverpool Football Club • Malcolm Glazer purchase of Manchester United • Roman Abramovich purchase of Chelsea Football Club |
Source: Stout Risius Ross, Inc. Used with permission.
HOW DOES THIS TRANSLATE INTO VALUE CREATION?
As previously noted, many of the typical franchise’s revenue streams have been maximized. While capacity at a facility may be limited, the opportunity to increase revenues through international growth and real estate development initiatives are immense. Real estate development presents opportunities for owners to differentiate their team by growing non-shared revenue streams.
As leagues pursue globalization strategies, they will elevate league-wide revenues. Since these revenue streams are typically shared by all teams equally, successful globalization strategies should increase the value of all franchises within a given league. Further, as talent from around the world continues to represent an increasing percentage of players and overall interest in sports occurs, the demand for product and content abroad will increase. This increased demand will translate into increasing revenue streams, especially for those that embrace and capture the opportunity that exists. In addition to the impact of globalization on revenue streams, globalization can impact the valuation of franchises through the incremental demand that can be created by expanding the buyer pool to include more international buyers. The tapping of the significant wealth that exists outside of the U.S. is an opportunity that cannot be overlooked.
Given the opportunities that exist within each league, it will not be surprising in the long-run, to see a convergence of franchise values between the various leagues. In the short-term, MLB and the NBA should realize greater increases in value as they benefit from an effort that is more fully developed. The NFL, on the other hand, will face a higher level of challenges due to limited participation in many international markets, and thus the opportunity may be slower to develop. The higher level of international players comprising professional soccer and the NHL provide a framework that these organizations can leverage to enhance overall league and franchise value.
Can professional sports teams achieve comparable value appreciation as the recent past? Only time will tell, but executing on both the real estate and global opportunities will certainly go a long way in helping owners maximize returns.
Discussion Questions
1. From a valuation perspective, what are the advantages and disadvantages of revenue sharing in professional sports leagues?
2. What valuation method would be better for buyers and why? Compare this method with other valuation methods used today. What valuation method would be best for sellers? Why?
3. What are the differences in the effects of team naming discussed in these articles?
4. What are the different barriers to globalization, as described by Phillips and Krasner?
5. What are the most important factors driving valuation?
6. Assuming that regional identities are more profitable to the value of a team, what barriers may prevent a team from successfully changing its name to a more regional one?
7. Provide an example of why a losing team might be purchased for a large sum of money, consistent with the material discussed in this chapter.
8. How does the impact of asymmetric information between buyers and sellers of sports franchises on the sales price of professional sports franchises differ from the impact it has on sales of nonsports businesses?
9. What is a team’s “reputation,” and how does it impact the value of the team? Why is this relationship irrational?
10. What are the most important factors in the credit rating process?