CHAPTER ONE
INTRODUCTION
In the United States and in professional sports around the globe, the individuals or entities that own various sports enterprises have been instrumental in setting the direction of the sports business. As long as there have been professional sports, there have been investors motivated by profits, public attention, winning, and community impact. As described in Don Kowet’s 1970s classic The Rich Who Own Sports,1 chariot races in ancient Rome were structured as a league, with corporations owning each of the four teams that competed at Circus Maximus—the Whites, Blues, Reds, and Greens—whose drivers dressed in the appropriately colored tunics. As the Roman Republic became the Roman Empire, the popularity of the races led to an expanded schedule—more races—and the gradual addition of 12 teams, with expansion fees in the millions of sesterces (the currency of the day). Owners of the chariot teams ran a profitable business.
The United States has seen several generations of professional team owners. The “original” generation of owners was largely composed of men (and it was all men) who had playing and/or coaching backgrounds. They typically wore multiple hats—owner, general manager, and coach, for example. The National Football League (NFL) had George Halas of the Chicago Bears and Curly Lambeau of the Green Bay Packers; Major League Baseball (MLB) had Connie Mack of the Philadelphia A’s, Charles Comiskey of the Chicago White Sox, Clark Griffith of the Washington Senators, and John McGraw of the New York Giants.2 Other owners bought teams with the goal of making their team the focus of their entrepreneurship. The team was their business. Though not inconsequential, their monetary investments in their teams was paltry by today’s standards, and their ownership occurred during the start-up days of their leagues—an era marked by franchise and league instability. Without the determination and foresight of these owners, the leagues would not have survived.
The second generation of league owners was comprised largely of men who had made money in other industries and whose interest in sports led them to purchase a franchise. Multimillionaires such as Ray Kroc, Ewing Kauffman, Charlie Finley, and Gene Autry invested part of their fortunes in MLB teams. The second generation of owners blazed a trail for the current, third generation. This third generation is marked by individuals who have accumulated vast fortunes through outside business interests and who have purchased sports organizations for any number of different reasons—from business to pleasure. Corporations are also an important part of this third generation, with entities such as Red Bull, Comcast, and Cablevision joining the ownership ranks (Table 1). These corporations look to use their sports holdings to improve their core businesses.
The individual equity ownership model of sports organizations can take one of two forms. The first form involves a single, independently wealthy owner, such as “new school” owners Dan Snyder, Mark Cuban, Paul Allen, and Jeffrey Lurie, who can take either a passive or active role in the club’s decision making. The owner’s role may change over time as he or she becomes less or more interested in team operations. The second form involves a group of individuals who pool their resources to acquire ownership of the team. League rules usually require that one individual be deemed the majority owner and/or specify that one individual be labeled as the final decision maker. For example, in the NFL the majority owner’s family must have a 30% stake in the team; in the NBA the requirement is 15%. An investment syndicate document typically outlines the rights and responsibilities of each investor. Although this model can be quite successful—witness the Boston Celtics “Banner 17 LLC” group of Wyc and Irving Grousbeck, Stephen Pagliuca, and Robert Epstein—it can be fraught with danger if the members of the syndicate develop philosophical or personal differences. The demise of the Atlanta Spirit LLC group and the antagonistic relationship between the Liverpool Football Club’s owners Tom Hicks and George Gillett are instructive.
Table 1 List of High-Profile and Publicly Traded Corporations that Own Sports Franchises
| Company | Symbol | Teams |
Cablevision Systems |
CVC |
NY Knicks, NY Rangers |
Comcast Corporation |
CMCSK |
Philadelphia 76ers, Philadelphia Flyers |
Liberty Media Corporation |
LCAPA, LCAPB |
Atlanta Braves |
Nintendo Company |
NTDOY |
Seattle Mariners |
Rogers Communications |
RCI |
Toronto Blue Jays |
Source: Based on records of the Sports Business Resource Guide and Fact Book (2009).
League operators have long preferred to work with individuals who they can look directly in the eye at a meeting and with whom they can make decisions on the spot. League commissioners and owners prefer to deal with individuals rather than corporations and their often unwieldy boards of directors. Leagues want to make decisions now, not when the schedules of two dozen corporate boards allow or, worse yet, those of thousands of shareholders. However, with the exception of the NFL, all leagues now allow teams to be owned by both individuals and corporations, despite the fact that the latter is operationally less desirable. Allowing corporate ownership provides the leagues with greater access to capital markets (i.e., the pool of potential buyers). This helps keep franchise sale prices high.
Although it is debatable whether the evolution from individual to corporate ownership is good or bad for the sports industry, there can be no doubt what is motivating this change: money. Although owners have always been wealthy, escalating franchise prices and operating costs have made ownership by the individual “moms and pops” that embodied the first and second generation of owners more difficult. The game has become too risky and expensive for many of them to play. In the United States, estate planning has also led to the divestiture of sports franchises by individual owners. Even when individual owners have remained, the rationale for their involvement may have changed. Although some venerable first- and second-generation owners remain, such as the descendants of the Mara and Halas families of the NFL’s New York Giants and Chicago Bears, respectively, the new breed of individual owners such as Paul Allen, Phil Anschutz, Bob McNair, Jerry Jones, Ted Leonsis, and Jeff Vanderbeek has infused professional sports. Having representatives from all three generations of ownership creates an interesting dynamic within the ownership ranks of each league.
A number of taxation issues are particular to the sports industry. These issues arise primarily upon the transfer of a sports franchise and involve the accounting concepts of amortization and depreciation. A significant part of the acquisition of a professional sports franchise involves intangible assets, such as the league membership agreement, the facility lease, contracts with season ticketholders, media contracts, and player contracts. The preferential treatment that professional sports franchises receive under the federal tax code—especially with respect to player contracts—is controversial, because it provides their already wealthy owners with a lucrative tax shelter for a period of years after the purchase transaction. The resulting tax benefits associated with ownership of a professional sports franchise help to keep the marketplace robust. Along with the consumption value of team ownership and the opportunity for operating profits and overall capital appreciation, the generous tax treatment of professional sports franchises encourages investment in this industry. Thus, it is important for prospective and current owners to understand the applicable taxation principles. In this chapter’s final excerpt, Coulson and Fort provide an excellent overview of these tax issues.
In addition to the financial benefits that can result from the ownership of professional sports franchises in terms of the possible generation of operating profits, tax benefits, and asset appreciation, a very high consumption value is involved as well. Individual owners have long received significant psychological benefits from ownership, such as boosted egos, publicity, access to athletes and other powerful individuals, the chance to be a “winner” on the field, retaining or enhancing a community asset, membership in an exclusive fraternity or club, and the fun of being a real-life “fantasy team” owner. The motivations of some individual owners have changed in recent years, as there is an ongoing shift in focus to the synergies that ownership can provide. Some individuals, such as former owners Bruce Ratner of the NBA’s New Jersey Nets and Victor McFarland of Major League Soccer’s D.C. United, are motivated by the real estate opportunities surrounding the playing facility. The team serves as a means to accomplish the end goal of maximizing the returns on the larger real estate play. For others, team ownership provides valuable networking opportunities. Bob Johnson, the former owner of the NBA’s Charlotte Bobcats, explained it this way:
It’s not the sports side of me that drives ownership, it’s the business side. Owning an asset like this creates the potential for opportunities beyond the business itself. There are opportunities to develop relationships with other team owners. These are entrepreneurs who like to do things outside of the box. There may be other things I can do with [Dallas Mavericks owner] Mark Cuban or [Denver Nuggets owner] Stan Kroenke. It’s just a good club to belong to.3
Other, lower-profile owners use the team to increase their visibility in the local marketplace. Robert Nucci, the owner of the now defunct Arena Football League’s Tampa Bay Storm, said, “The investment is in the community and in the value of the franchise. By owning this franchise, you’re very involved in the community. Your business becomes more well-known, your overall connections increase. You meet people you haven’t met before. I think it’s a very good investment.”4
Some owners are motivated by a desire to win on the field. Owners are usually very competitive individuals, and this competitive nature has helped them to accumulate the vast amount of wealth that it now takes to acquire a professional sports franchise. The ability to compete for a championship provides them with a high-profile outlet for their competitive streak. Roman Abramovich, the Russian billionaire oligarch and owner of the Chelsea Football Club, said, “The goal is to win. It’s not about making money. I have many much less risky ways of making money. I don’t want to throw my money away, but it’s really about having fun and that means success and trophies.”5
Despite having the business acumen that it takes to accumulate enough wealth to afford a professional sports franchise, a number of owners have struggled to be successful in sports. Donald Trump, the owner of the New Jersey Generals of the long-defunct United States Football League (USFL), once said, “I watch the owners suffer. They have businesses and they’re very successful, but when it comes to sports, it’s like they lose a lot of business judgment.”6
It is important to understand why this is the case. The sports industry is an industry of nuance. First, entrepreneurs in other industries are motivated by one thing—making money. However, entrepreneurs in the sports industry are pursuing victories in addition to profits. Craig Leopold, the owner of the NHL’s Minnesota Wild, has stated:
Owning a sports franchise, I would say, is a departure from conventional wisdom. It’s a different business, a different business model, although you use the same principles of management. That is, you get the best people that you possibly can and you let them do their jobs. But ultimately the end game is different: You’re trying to win something, and the value of the asset is getting larger and larger even though your losses may continue. That’s not a normal business model.7
Robert Kraft, owner of the NFL’s New England Patriots concurs:
I learned early on that you come in as a fan, but there’s no on-the-job training for owning an NFL franchise. You have to get in it and get roughed up by it. You go through a learning curve, understanding the nuances of the business that are different. At the same time, I think it’s important that when you run and manage a franchise, that you use the same core values that you use in your other businesses. You always have to decide what is right for you and your system, develop a strategic plan and follow it even when things don’t go your way. It’s pretty cruel in the short term when you lose and things don’t go right, but as long as you believe you have a good plan, you have to stick with it and back the key people in your system.8
Second, most owners are not used to losing in their entrepreneurial ventures, and like most other entrepreneurs, they do not like to do so. Owners do not buy sports franchises envisioning that they will lose a lot of games. However, the binary nature of sports means that every game has a winner and a loser. There is a lot of emotion associated with the games, and it can be very difficult to separate this emotion from logic, especially when the team is losing a lot. Mark Richardson, the former president of the NFL’s Carolina Panthers, explains it this way, “Until you get into it, I don’t think you truly understand it. You don’t realize the impact (an NFL team) has on your community. You don’t understand the depth of emotion that goes with the fans and the team. You don’t realize how hard it is to win.”9 Perhaps the best way for the owners to keep from making emotional decisions is to let others handle the daily operations of the franchise. In many cases, this is contrary to how many owners run their nonsports businesses, and for some it takes the fun out of owning a team. But the NHL’s Chicago Blackhawks chairman Rocky Wirtz agrees: “You realize tomorrow is a new day, so you can’t let your emotions control your better judgment. The owner needs to not get in the way. Too many times the owners in sports tend to let their egos get ahead of them and that is not good. You have to run this as a business.”10
Third, being an owner of a professional sports franchise is a high-profile position that is dissimilar to what most owners have experienced in their other endeavors. Mickey Arison, owner of the NBA’s Miami Heat, explains:
Before you get into it, you don’t realize how high-profile it is and how much focus there is on you personally. I’m better known in the community for the team than [for] Carnival [the cruise line that he owns], and that doesn’t make a whole lot of sense when you think about it. But the reality is that before I owned the team, I could go out to a restaurant and walk around town and people didn’t know who I was. That changed dramatically, and even more so more recently.11
Although some owners enjoy the publicity and thrive on it, others are far more reluctant to spend time in the spotlight. When John Moores owned the San Diego Padres, he once said:
The worst part of owning the club is the public part of it. It’s just tacky. It’s a little bit of a freak show. But being held up to public scrutiny just comes with the territory of owning any baseball team or public enterprise. It means people care. What would disturb me would be the opposite. If you’re not criticized, it means people don’t care. Then I would really worry. But people do care. They care a lot. People in this town care a lot about the Padres, and I’m glad they do.12
In recent years, the ownership entity has evolved from the gritty, individual model embodied by Art Rooney and George Halas to the presence of both individuals and corporations—particularly media, entertainment, and communications companies—looking for synergies to exploit. It seems that the trend towards corporate ownership is waning, with many of the media, entertainment, and communications companies selling their sports holdings in recent years. Indeed, 10% of all teams in the NBA, MLB, NFL, and NHL are owned in the majority by corporations. Corporations own a minority share of 16% of the teams in the NBA, MLB, NFL, and NHL. A recent count shows that 12 MLB, NBA, and NHL teams are owned by corporations. Rogers Communications, Liberty Media, Comcast, and Cablevision are among the media companies that are involved in the ownership of sports franchises. Traditionally, ownership of professional sports franchises is attractive to corporations with interests in the media, communications, and entertainment business, because sports team programming has significant content value due to the franchise’s strong audience loyalty and brand visibility.
Viewing sports franchises as entertainment assets, corporations have attempted to use them to garner additional revenues through the team’s playing facility and media rights. In theory, the ownership of the team and its playing facility and programming rights enable the corporate owner to enhance the team’s value through the exploitation of a wide range of synergies, including cross-promotional opportunities, the creation of additional distribution outlets, and higher visibility in the marketplace, as well as risk reduction and cost savings through economies of scale. For this reason, as revenues and costs grow larger and values keep increasing, theoretically the number of corporate owners should increase. However, this strategy has not been successful for every corporation that has attempted it, and nationally focused media companies have trended away from sports ownership as a result. It is likely that corporate owners with a local or regional focus will be more successful than those with a national or global focus. Politician Tip O’Neill’s statement that “all politics is local” seems to apply to corporate ownership of professional sports franchises as well.
Some notable flameouts have occurred among nationally focused corporate owners. Former team owners Disney, News Corporation, Tribune Company, and Time Warner abandoned their “sports strategies,” at least partially because they were unable to capitalize on their ownership of professional sports franchises. Disney’s failure is likely attributable to its inability to effectively capture the media-related revenues available through its sports franchises, which resulted in the company incurring a $100 million loss during its ownership tenure of the Anaheim Angels MLB team and Anaheim Mighty Ducks NHL team. To Time Warner, the value of owning professional sports franchises was in its ability to charge national advertising rates for the broad cable distribution of local team broadcasts via its TBS Superstation. When this value diminished as the company grew from a local broadcasting interest to a global venture through a series of mergers and acquisitions, and investor pressure grew for the company to reduce its debt load in a difficult economy, Time Warner withdrew from ownership of its sports franchise holdings. Ironically, the Atlanta Braves were sold to another media company, Liberty Media, as part of a larger stock swap transaction between the companies. Liberty Media is widely expected to sell the team after the tax requirements associated with its acquisition of the team are satisfied. News Corp. acquired the Dodgers from its longtime owners, the O’Malley family, in 1997 for a then-record price of $311 million. In doing so, the company was able to secure the team’s broadcasting rights far into the future. Beyond that, however, the Dodgers were never a great fit for the Fox Entertainment Group, the News Corp. subsidiary that operated the team. The team was never part of its parent company’s core business, and the managerial skill of the parent company’s executives was misplaced when focused on the team side. The Dodgers became lost within the larger entity, and as the team struggled to make the playoffs and began to incur substantial operating losses, News Corp. soon tired of owning the team. When the parent company made the additional acquisition of satellite operator DirecTV for over $6 billion, the Dodgers and its related properties were sold to real estate mogul Frank McCourt, in part to help finance the purchase.
A final hurdle facing large corporate entities that own sports teams is investor and analyst pressure. When the parent company is facing financial difficulties, investors and analysts often place pressure on the company to return to its core businesses. The team is rarely part of that core. In addition, the revenues that are generated by sports franchises do not create regular quarterly earnings before interest, taxes, depreciation, and amortization (EBITDA, a measure of cash flow); instead, revenues are highly seasonal in nature and vary significantly from quarter to quarter. However, public companies are under quarterly pressure to report EBITDA growth; thus, sports teams are not necessarily a good fit for publicly traded corporations.
With the exception of a handful of teams, local sports franchises do not have much impact on a national or international level, where audience loyalty is unlikely to be strong and cross-promotional opportunities limited. Locally focused corporations avoid these problems and can retain the additional revenues that are available through the ownership of professional sports franchises. This is especially true if the corporation is the dominant cable provider in the local marketplace. Companies such as Comcast (owner of the Philadelphia Flyers and 76ers) and Cablevision (owner of the New York Rangers and Knicks) can realize the benefits of vertical integration. By owning the team, its playing facility, and its local media distribution channel, the company captures the lion’s share of revenue generated by the team. It is able to dominate the local marketplace, where fans are most passionate about the local teams and can be most effectively monetized.
In addition to this mix of old-school and corporate owners are anomalies such as the Green Bay Packers, a franchise long held in a public ownership form and a grandfathered exception to the NFL’s rules against corporate ownership. In the 1980s and 1990s, a smattering of other public offerings cropped up as well. The public-offering structure has provided a cash infusion to existing sports enterprises, including several North American franchises and numerous European soccer clubs. The investment merit of these offerings is somewhat dubious; they turned out to be outlets for fan affinity rather than opportunities for real financial returns.
Some private equity (PE) investment has occurred in professional sports. Although there seems to be some trending away from PE investment in sports, such investment has been significant in value when it has occurred. PE investments in major professional sports leagues have presented a number of problems. Operating within a sports league environment is not a great fit for the traditional PE model of purchasing a distressed property, slashing costs, increasing short-term revenue, and exiting for large profit, typically after a 5-year period. The challenges for PE returns are daunting. Growth areas are limited by league rules covering everything from the team’s exclusive and limited geographical territory to marketing prohibitions. Existing long-term local media and sponsorship deals also limit growth opportunities. Cost reduction is difficult because of the presence of collective bargaining agreements negotiated on a leaguewide basis with the players’ unions that establish team and individual player salary floors. An additional concern is whether PE firms are too focused on the short term to be effective team owners. Finally, the exit strategy can prove difficult. Given the aforementioned restrictions, the appreciation of the sports asset may not increase substantially in the window preferred by the PE firm. Thus, it may be that ancillary sports deals are somewhat better suited to PE investment. Indeed, firms such as IMG, Route 2 Digital, Falconhead Capital, and Spire Capital have invested in entities such as rodeo, beach volleyball, cricket, and a number of sports media companies. Minor league baseball and hockey, indoor football and soccer, and lacrosse may offer additional investment possibilities.
Several American sports leagues have recently adopted the single-entity structure. MLS was the first entity to use this model, in which an entire league is controlled by a single operating company. Investments are made in the company, rather than in a particular franchise. This format was developed to avoid the self-destructive behavior displayed by owners in other nascent sports leagues whose desire to win has led them to pay more than they could afford for athlete services. This behavior contributed to the demise of these leagues, because so many teams went out of business that the leagues could no longer survive. By adopting a single-entity structure, competitive bidding among owners for players is eliminated, and a major cause of league failure is sidestepped. In addition, this structure allows sports leagues to evade the application of antitrust laws in management–labor disputes.
Following the lead of MLS, most new leagues have since adopted this operating structure. Despite its strengths, the model may not prove to be an effective method of running a mature league. The single-entity structure places a disincentive on individual investors to engage in entrepreneurial behaviors, because the benefits of such tactics are likely outweighed by their costs. The whole may be weaker than the sum of its individual parts. More on the single-entity model can be found in Chapter 2.
As the sports world has become “flatter,” there has been an influx of foreign ownership in sports leagues throughout the world. While the NBA’s New Jersey Nets were purchased by Russian oligarch Mikhail Prokhorov in 2010, this has been especially prevalent in the English Premier League (EPL), widely regarded as the top soccer league in the world. English clubs Manchester United, Aston Villa, Liverpool, Arsenal, and Derby County are controlled by Americans; Manchester City and Portsmouth (at the time of this writing) are owned by investors from Abu Dhabi and Saudi Arabia, respectively; Fulham is owned by an Egyptian; Chelsea is owned by a Russian; Birmingham City is owned by someone from Hong Kong; and Sunderland is owned by an Irish consortium. The global popularity of the EPL and the more relaxed league rules concerning revenue opportunities and growth make it appealing to foreign investors. Similarly, an entire league, the Indian Premier League (IPL), played its second season in 2009 in South Africa rather than India. The season was moved largely for security reasons, but the action is illustrative of the shrinking sports globe.
The readings that follow examine these various ownership models and the business issues impacting individuals involved in each. There is an emphasis on the functionality of each model. Beyond impact and functionality, the valuable lessons come from understanding who the successful owners have been and who the most successful owners of the future might be.
The chapter opens with an excerpt from Quirk and Fort’s classic, Hard Ball: The Abuse of Power in Pro Team Sports, which touches on ownership history and also provides an overview of modern-day owners. The excerpt also focuses on how these owners fit into the modern-day sports league. This is a discussion that will be carried out in more depth in Chapter 11, “Sports Franchise Valuation.” Note that the excerpt discusses the “why” of ownership, both in monetary and nonmonetary terms. Noted sports economist Andrew Zimbalist is excerpted from next, providing an excellent overview of the reasons that investors seek out professional sports. Rod Fort examines the value of owning an MLB team in the third selection. The fourth and fifth excerpts focus on initial public offerings (IPOs). This format, which has received a good deal of attention, seems to be more of a novelty than an important long-term business model. These are faceless owners, but similar to the broader corporate model used for raising funds for business success. After a brief flurry, it seems that the use of this novel approach to ownership has fizzled in North America, although the model endures in Europe.
Among the related readings in other sections of the book, three might be of particular interest. In Chapter 8, “Media,” there is a discussion of vertical integration. In Chapter 4, “Emerging and Niche Leagues,” a selection focuses on the single-entity model of league operation. In Chapter 18, “Race,” the excerpt from the article “Diversity, Racism, and Professional Sports Franchise Ownership: Change Must Come from Within” focuses on the diversity issue as it relates to ownership.
Notes
1. Random House, 1977, pp. 3–8.
2. Quirk and Fort, Hard Ball.
3. Phil Taylor (quoting Bob Johnson), “Franchise Player,” Sports Illustrated, May 5, 2003, 36.
4. Bruce Goldberg (quoting Robert Nucci), “So, You Want to Buy into the AFL? Here’s How,” Sports Business Journal, February 25, 2008, 18.
5. Alexander Wolff (quoting Roman Abramovich), “To Russia with Love,” Sports Illustrated, December 15, 2008.
6. Peter Fitzsimons (quoting Donald Trump), “Select Policy Pays off for Swans,” The Sydney Morning Herald, October 1, 2005.
7. (Quoting Craig Leipold), “The Daily Goes One-on-One with Wild Owner Craig Leipold,” Sports Business Daily, November 25, 2008.
8. Jim Chairusmi (quoting Robert Kraft), “Top of His Game,” The Wall Street Journal, December 2004.
9. (quoting Mark Richardson), “Panthers Celebrate 15th Anniversary in NFL Amid Ups, Downs,” Sports Business Daily, October 28, 2008.
10. (quoting Rocky Wirtz), “Chicago Sports Leaders Gather to Discuss Local Market,” Sports Business Daily, September 18, 2008.
11. John Lombardo (quoting Mickey Arison), “The Man Behind the Scenes,” The Sports Business Journal, April 30, 2007, 1.
12. Barry M. Bloom (quoting John Moores), “Moores Reclaims Active Role with Padres,” mlb.com, September 18, 2008.
PERSONALITIES AND MOTIVATIONS
HARD BALL: THE ABUSE OF POWER IN PRO TEAM SPORTS
James P. Quirk and Rodney D. Fort
The payoffs to a rich owner from owning a sports team might come mainly from the fun of being involved with the sport itself and with the players and the coaches, rather than from the profits the team generates. There is also the publicity spotlight that shines on the owner of any team—Carl Pohlad [late owner of the Minnesota Twins] is much better known in the Twin Cities for the Twins than for his Marquette National Bank…. And all of the fun and publicity is that much more intense when the team you own is a winner.
This view of owners as “sportsmen” ignoring bottom-line considerations has its attractions, and there have been owners who really seem to have fit this image—Tom Yawkey of the Boston Red Sox of the 1930s and 1940s is one who comes immediately to mind. Still, it pays to be a little skeptical. Billionaires don’t get there by throwing their money around recklessly—they tend to be the people who let someone else pick up the tab for lunch. As important as winning is to them, it might well be a matter of ego and personal pride that they manage to do this while pocketing a good profit at the same time.
A competing view of the owners is that, their loud protestations to the contrary, they actually are minting money from their teams’ TV contracts and high-priced luxury boxes and preferred seating licenses. According to this view, owners would very much like to field winning teams if there’s any money in it, but otherwise, they’re quite content to load up the roster with low-priced talent and have no qualms about moving the team if fans don’t flock to watch a second-division turkey.
Whatever view you have of the matter, there is no doubt that almost all of the huge amount of money that pro team sports generates, through gate receipts, TV income, stadium revenues, and sales of memorabilia, passes first through the hands of the owners. But how much stays there, and how much gets passed on in the form of player and coaching salaries, traveling expenses, administrative costs, stadium rentals, and the like? To answer this question authoritatively would require access to the books of sports teams and their owners. Unfortunately, we do not have that access. There are a few—the Boston Celtics, Cleveland Indians, and Florida Panthers—that are publicly traded businesses, so their revenues, costs, and profits are public information. [Ed. Note: All three teams have since been purchased by private individuals and taken off the public market.] But most sports teams are closely held businesses, organized as limited partnerships or subchapter S corporations, with no legal requirement to open their books to the rest of us. What we have instead is a set of estimates of income of the various sports teams, prepared on an annual basis since 1990 by Financial World [and now Forbes] magazine.
….
The first thing that is abundantly clear … is that, with just a handful of exceptions, pro team sports does not appear to be a terribly profitable business.
….
The figures seem to make mockery of the notion that owners are making out like bandits. At most only a few teams in each league are showing impressive book profits, and they are generally the ones that all of us would have predicted …
Another aspect of the financial picture of sports leagues … is the division between the haves and the have-nots ….
The large numbers of have-nots in baseball and hockey reflect the fact that winning is more important to the bottom line in these sports than in basketball or football. NFL and NBA teams derive most of their gate revenue from season ticket sales, whereas in baseball, walk-in ticket sales are an important share of the team’s gate revenues and are much more sensitive to the team’s won–lost record. In the NHL, there are the regular season and the “second season,” the playoffs. Playoff ticket sales are a critical part of any NHL team’s finances, so missing the playoffs almost certainly means financial problems for the team.
Add to this the fact that the value of local TV rights is sensitive to the playing success of a team and that local TV plays a larger role in baseball and hockey than in the other two sports. Thus, a larger share of revenue is sensitive to the won–lost record of baseball and hockey teams, which tends to increase the value of star players to teams, so that salary costs are adversely affected as well.
The large number of have-not teams also provides a clue as to why it was Major League Baseball and the NHL that experienced long debilitating work stoppages in 1994 and early 1995 [Ed. Note: and again in 2004–2005], with the have-not owners holding out for radical changes in the rules governing their leagues’ player markets….
What does this suggest about the profit orientation of team owners? We would argue that the pressures that free agency has imposed on the bottom line in sports, as indicated by operating income figures, have made it all the more important for teams to act like profit maximizers, ferreting out every possible source of revenue and exploiting it to the hilt, while paring away at costs with a vengeance. It is much more expensive to be a sportsman-owner today than it was in Tom Yawkey’s days, and this lesson is well known to everyone who owns a sports team. The drive for stadium subsidies and tax rebates and the hard-line stands in labor negotiations are just a few of the obvious consequences of the tightening of profit margins in sports.
Does this mean that we should be passing the hat again for Paul Allen …, or that we should erect statues to owners for their profitless task of bringing quality athletic entertainment to the masses? Well, maybe not. Let’s try to count some of the ways in which an owner can still break even or do better than that, even with an operating income that is negative or barely on the plus side.
First, it is commonplace for an owner to take on a salaried job with his team, as president or chairman of the board. It’s the owner’s team so he can pay himself whatever salary he wishes….
In the years when Calvin Griffith owned and operated the Minnesota Twins, it was widely reported that there were Griffith relations galore on the payroll of the team. There is nothing illegal or immoral about this, of course; in fact, to the contrary, it makes Griffith seem like what he in fact was, a very family-oriented person. However, it does mean that book figures on team revenues, costs, and profits for the Twins understated the income that the owner and his family derived from the team.
Second, more and more often, team owners today have complex financial interrelationships with their teams….
In the case of the Florida Marlins, when Wayne Huizenga owned the team, he also owned the stadium in which the team played as well as the Miami TV station that aired Marlin game telecasts. Into which of Huizenga’s several pockets did the stadium rental or the local TV revenue go? Questions like this have become much more than merely academic matters for the players in the NFL and NBA operating under salary cap rules, because those rules guarantee players a stated minimum percent of league revenues. League revenues will vary depending on whether the team gets the full market value of its TV revenues, or instead a part is transferred to the station, network, or superstation owned by the team owner. (See Table 2 for a list of the wealthy individuals that are involved in the sports industry.)
….
Third, ownership of a sports team provides tax sheltering opportunities that are not available to most other businesses, so that what appears to be a before-tax loss by the team can, in certain circumstances, be converted into an after-tax profit for the owner. The idea behind the tax shelter was one more contribution to the sports industry by the fertile and conniving mind of Bill Veeck, baseball’s greatest hustler and team owner. Back in 1950, Veeck was in the process of selling his Cleveland Indians team to a syndicate headed by his friend Hank Greenberg, the great Tiger outfielder. Veeck convinced the IRS that the purchaser of a team should be allowed to assign a portion of the purchase price of the team to the player contracts that the team owned, and then to treat this as a wasting asset, depreciating the contracts over a period of five years or less. That was an important bit of convincing, because the IRS already had in place rules allowing teams to write off as current costs signing bonuses, scouting costs, losses of minor league affiliates, and all the other costs incurred by a team in replacing its current roster of players with young players coming into the sport.
Table 2 Sports Interests Among Forbes’ Top 200 Billionaires in the World
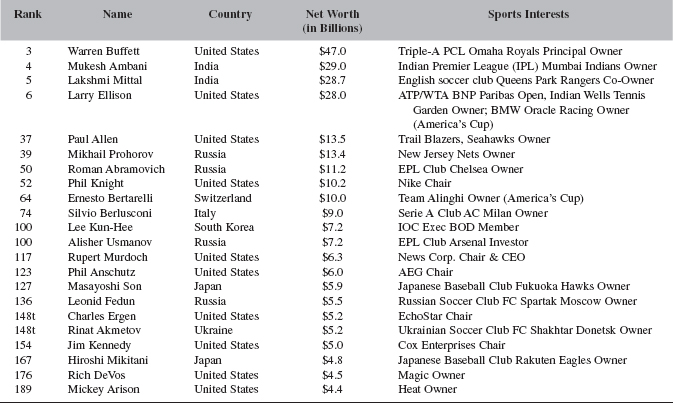
Sources: “Forbes’ Sports Interests Among Forbes’ Top 200 Billionaires in the World,” SportsBusiness Daily, March 23, 2010. Billionaire rankings reprinted by permission of Forbes Media LLC © 2010. Sports information has not been validated by Forbes.
….
Owners typically plead poverty by quoting net operating losses as the value of the team. And, for people in their wealth class, even 7 percent does not seem like an extraordinary return. Harold Seymour, the eminent baseball historian, quotes Charles Ebbets on baseball operations: “The question is purely one of business; I am not in baseball for my health.” But before we agree that sports are not a high-return investment for rich people, let’s remember the other values of owning a team. Profit-taking can occur under the “other salaries” heading. Most of the rest of the costs may actually be revenues, or generate even larger revenues, in other nonsports business operations of the owners. Business and government associations made during ownership tenure are valuable. And there is, after all, the fun of owning a team. Given all of these benefits, a 7 percent rate of return generating $5 million annually after taxes looks pretty good to us. Now, if only we could come up with that initial $75 million….
A team can show a book loss, yet pay owner-management quite well while they run the team, generate many other values not captured in the team’s income statement, and end up as a very valuable commodity at sale time.
….
Finally, offsetting the bad news about operating income is the good news about the continuing increases in the prices of sports teams themselves. The capital gains that an owner gets from selling his team can more than offset the losses, if any, that the team has shown from its ongoing operations. In fact, this has been true in practically all cases involving recent sales of sports teams.
….
The fact that the market prices of teams keep going up, even while operating income figures remain at very low levels, raises the question as to whether what we are observing is a “bubble,” much like the bubble in California real estate in the 1980s. In a bubble, the current price of an asset is determined not by what the asset is expected to earn in the future, but by what people today think buyers in the future will be willing to pay for the asset. A bubble is fueled by the “greater fool” argument: “Sure, I know this house isn’t worth $300,000, but a year from now, I’ll be able to sell it to some other real estate speculator for $500,000 because he’ll be expecting the price the year after he buys it to be $600,000.” The price is what it is today because everyone expects a “greater fool” to come around tomorrow to take the item off your hands at an even higher price.
All that economists know for sure about bubbles is that, eventually, they burst, and it’s like the old game of musical chairs—whoever gets stuck with the overvalued asset at the time the bubble bursts has nowhere to get rid of it. There is a classic story about the stock market that goes something like this:
A broker touted a small company’s stock to a client and convinced him to buy 1,000 shares at $10 per share. A week later, the broker reported that the price was up to $12, and the client opted for another 1,000 shares. The price kept going up and the client kept buying for several more weeks. When the broker reported the price at $25 per share, the client said, “I’m not greedy. I’ll just take my profits now. So sell my shares.” There was a pause and then the broker asked, “To whom?”
If it really is a bubble that we are observing in the market for sports teams, the problem is that there isn’t any way to know beforehand just when the bubble will burst. Those unlucky people who happen to be holding title to the over-valued team franchises will simply have to eat their losses and live with them. But if it is a bubble, it’s been going on for quite a long time. Historical records of franchise sales in sports indicate that over the past thirty years or so [Ed. Note: from approximately 1970–2000], on average, NBA teams have been increasing in price at a rate of around 26 percent per year, MLB teams at around 14 percent per year, and NFL teams at around 22 percent per year.
The fact that the rates of increase in franchise prices in the 1990s, while in the double-digit range, still are lower than those in earlier years indicates that if there is a bubble in these markets, at least it is tapering off. Actually, over the period of the mid-1990s, investors were making a better rate of return simply “buying the market” with an indexed stock fund than were sports entrepreneurs with their high-visibility team investments.
Rather than being simply a bubble phenomenon, the continuing increase in team prices in sports and the capital gains being captured by owners no doubt reflect a range of factors at work in the sports industry. There are the “fun and games” and publicity aspects of ownership of a sports team. These have been increasing over time along with the media exposure that sports receives. The “spill-over” benefits of owning a sports team, those after-tax returns identified earlier that don’t show up as operating income for a team, have been increasing over time as well, and get reflected in higher team prices. And there is undoubtedly something of a speculative bubble present as well, a common belief among present and prospective owners that because almost no one in the past has sold a team for less than its purchase price, future capital gains are more or less assured.
In summary … the current owners of sports teams are, by and large, very wealthy individuals. But, with teams being as expensive as they are, ownership of a team is a significant investment, even for a wealthy owner. The returns to ownership, as measured by operating income, are below market rates of return from investments of comparable risk in all sports with the possible exception of the NBA. A prime reason for the weak operating income performance of teams is free agency and the continuing escalation of player salaries. This suggests that bottom-line considerations play a critical role in team decision making, perhaps looming larger for today’s owners than for owners of the past. On the one hand, this provides incentives for owners to act as aggressively as possible in attempting to exploit whatever local monopoly power the team possesses—if we don’t squeeze out every cent of money from local fans and taxpayers, how can we afford to compete with the teams that do? On the other hand, the concentration on the bottom line makes it more difficult for teams to act cooperatively as members of a sports league in addressing problems of mutual interest to all teams in the league. What team can afford to sacrifice some of its income for the “common good” in a world in which lots of red ink is waiting just around the bend for any team that loses a star player to injury or ticket sales to bad weather?
There have been exceptional owners such as Phil Wrigley, who refused to schedule night games at Wrigley Field when he owned the Cubs, to keep nighttime noise, traffic, and confusion out of the north side neighborhood of the park; and Ewing Kauffman, who heavily subsidized his Kansas City Royals when he was alive and then set up a committee of leading local citizens to operate and then sell the team after his death, to ensure that the team stayed in town. But everything about the current and historical record of pro sports suggests that if you are trying to understand what is going on in sports, your best bet is to assume that owners will be motivated by bottom-line considerations, however wealthy they are. Wayne Huizenga’s decision to sell off his Florida Marlins, one by one, and then the team franchise itself after the team won the 1997 World Series but reportedly lost $30 million at the gate, fits the mold nicely.
The contribution of owners to the problems of pro team sports does not arise, however, because they operate their teams to make money. After all, one of the fundamental reasons why we in America enjoy the living standards we do is that all those businessmen out there are free to operate to make as much money as they can. The argument in favor of a free enterprise, profit-oriented economy is that the way a businessman makes money is by producing the goods that consumers want, in the style and quantity that they want, at the lowest possible price. And if a businessman doesn’t do this, he should be prepared to be steamrollered by other businessmen who do a better and cheaper job of producing that product.
Once again, the problem with the sports industry is the fact that leagues operate as monopolies, so that team owners in sports are not subject to the same intense market pressures to perform well as if they had to face competition from rivals. The local monopoly power of teams is limited, of course, by the availability of substitutes. NFL football has to compete with the college game, with other pro sports such as the NBA and the NHL, and with alternative forms of entertainment. But, when combined with the monopoly power of the league it belongs to, the local monopoly power of a team is certainly significant, as evidenced, for example, by the success of teams in their campaigns for new, highly subsidized stadiums financed by cities and states….
SPORT AS BUSINESS
Andrew Zimbalist
I. INTRODUCTION
Unlike businesses in other industries, professional sports teams in a given league both compete against and cooperate with each other. The success of a league is, to some extent, affected by the degree of uncertainty of outcome of its contests and its seasonal competitions, or, stated differently, by the degree of balance among its teams.
Professional sports leagues also differ from other industries in the degree of public exposure they garner. The daily game results are reported upon extensively in the local print, audio, and video media, and discussed widely and passionately by millions of fans.
Do these unique features of sporting leagues lead team owners to behave differently from owners of other businesses? Preeminent sportswriter Leonard Koppett (1973, p. 11), writing in the New York Times Magazine 30 years ago, suggested that they do:
Club owners are not ordinary businessmen. To begin with, profit in itself is not the owner’s primary motive. Any man with the resources to acquire a major league team can find ways to make better dollar-for-dollar investments. His payoff is in terms of social prestige…. A man who runs a $100m-a-year business is usually anonymous to the general public; a man who owns even a piece of a ball club that grosses $5m a year is a celebrity. His picture and comments are repeatedly published in news papers known in every corner of his community…. This does not mean, of course, that ball clubs don’t seek profits … but the driving force is to be identified with a popular and successful team … and that motivation leads to important variations from ‘normal’ business behavior.
To be sure, many economists agree with this perspective. Peter Sloane, in his well-known piece on English football (soccer), writes:
It is quite apparent that directors and shareholders invest money in football clubs not because of expectations of pecuniary income but for psychological reasons as the urge for power, the desire for prestige, the propensity to group identification and the related feeling of group loyalty. (Sloane, 1971, p. 134)
He then goes on to quote a 1966 report on the English Football Association (FA) that found the objective of a club owner was ‘to provide entertainment in the form of a football match. The objective is not to maximize profits, but to achieve playing success whilst remaining solvent.’ Sloane suggests an owner-objective function with playing success, average attendance, health of the league, and minimum profits as its arguments.
At the time Sloane was writing, a large share of FA clubs carried payrolls that were above 80 per cent of team revenues and FA rules stipulated maximum dividend pay-outs to shareholders for the minority of teams that were publicly held.2 Indeed, it became commonplace among economists to associate FA club ownership with utility—rather than profit maximization. In a 1999 article, for instance, Stefan Kesenne and Claude Jeanrenaud state matter-of-factly: “The most important difference between the USA and Europe is that American clubs are business-type companies seeking to make profits, whereas the only aim of most European clubs so far is to be successful on the field.” Kesenne and Jeanrenaud are joined in this view by a sizeable list of others….
Of course, the presumption that club owners do not profit maximize is also found in the literature on US sporting leagues. For their book on the baseball business, Jesse Markham and Paul Teplitz (1981, p. 26) interviewed ten owners as well as various other club executives and concluded that owners “were motivated to enter the baseball industry more out of reason of personal gratification, love of the game, devotion to professional sports generally, or out of civic pride than by the prospects of profits.” Markham and Teplitz claim that owners “satisfice,” that is, they seek “good enough” performance—analogous to utility maximization subject to a minimum profit constraint or, as the English football report put it, “playing success whilst remaining solvent.”3
There is no dearth of newspaper articles or television shows where one can find pious ownership claims about their motives. Joe Maloof, owner of the National Basketball Association (NBA)’s Sacramento Kings, for instance, on 13 May 2003, appeared on Jim Rome’s ESPN show and stated: “We have one goal in mind and that’s to win a title. We’re not going to rest until we have that for the city of Sacramento and for our franchise. We’ve never had a title and that’s what we need to get.”4
Another line of economic analysis of sports leagues holds either that team owners fundamentally maximize profit or that analyzing leagues under the profit-maximization assumption provides a useful efficiency standard against which to assess actual performance.
….
Most economists do not accept at face value assertions from ownership to the effect that they are motivated strictly or mostly by civic pride or eleemosynary goals. Interviews and survey data that produce self-proclaimed, non-selfish motives can be found among executives in many industries.
Because of this distrust of the survey interview methodology, some economists have attempted to seek empirical confirmation of ownership motivation. Noll (1974) finds that ticket prices are set where the price elasticity of demand is sufficiently close to unity, so that the hypothesis of profit maximization cannot be rejected…. Of course, it is possible that teams follow profit-maximizing behaviour with regard to ticket pricing, and utility-maximizing behavior with regard to player salaries (by offering above competitive salaries). Furthermore, as Kesenne and Pauwels (2002) point out, profit and win maximizers are likely to follow identical pricing rules.7
Hunt and Lewis (1976) study the level of individual team dominance in MLB with respect to what level of dominance produces profit maximization and what level produces revenue maximization. They find that the actual level of attained dominance is consistent with profit maximization but below the level that would yield revenue maximization.
Scully’s findings (1974, 1989) that baseball teams pay players below their marginal revenue products are consistent with profit-maximizing behaviour, as is Zimbalist’s (1992a) estimate—using a modified Scully methodology—that on balance players are roughly paid their marginal revenue products.
Szymanski and Hall (2003) analyse the performance of 16 FA clubs that went public since 1995 to see if their behaviour changed along with ownership. The hypothesis is that if clubs were utility maximizers when privately held, then when they went public there would be increased pressure for them to perform on the bottom line. They, however, found no significant evidence of modified performance. This finding is consistent either with the argument that FA clubs are still utility maximizers after going public or the argument that clubs were always profit maximizers.8
While some of the empirical results in the literature have been consistent with the hypothesis of profit maximization, the results have not been conclusive. Indeed, Fort and Quirk (2002) find that without holding revenue and labour demand functions constant, it is not possible to find a definitive test to discern whether owners in a league are profit or win maximizing. Still another hypothesis was suggested by author James Michener in his book Sports in America (1976, p. 441):
In the early years of every professional sport, the owners were men of great dedication and expertise…. Their type was soon superseded, however, by the business tycoon who made his fortune in trade, then dabbled in sports ownership both as a means of advertising his product and finding community approval. The beer barons—Jacob Ruppert with his New York Yankees and Augie Busch with his St Louis Cardinals—were prototypes; they became famous across America and the sales of their beer did not suffer in the process. It is interesting that when William Wrigley, the Chicago tycoon, wanted to buy into the National League, he was strongly opposed by Colonel Ruppert, who feared such ownership might be used to commercialize chewing gum.
Then came a third echelon of ownership, the corporate manager who bought a club not only to publicize his business enterprises but also to take advantage of a curious development in federal tax laws.
One could easily quibble with aspects of Michener’s taxonomy. What are particularly interesting for our purposes, however, are the notions that: (a) ownership motives might change over time, particularly as franchise values skyrocket—it being one thing to treat a sports club as a plaything when it is purchased for $lm, yet quite another when it is purchased for $800m, and (b) within a given league, ownership motives may vary.
II. WHY DO OWNER OBJECTIVES MATTER?
The behaviour of clubs and the performance of sporting leagues may be affected by objectives of owners. If club owners are profit maximizers, then they would invest in team success up to the point where the expected marginal revenue from an additional win is equal to the marginal cost. In contrast, if owners are utility or win maximizers, then they may invest beyond this point.9 Thus, if some clubs in a league are utility maximizers and others are profit maximizers, it may provide an additional source of competitive imbalance.10 Of course, if it is the owners of small market teams that utility maximize (while the owners of large market teams profit maximize), then playing balance may be enhanced.
Rottenberg (1956) argued that a league with profit maximizing owners will be more mindful of the need to maintain a certain level of balance and, hence, will be more restrained in labour-market spending.11 In contrast, a league of individual utility maximizers will prioritize winning over league success and spend more aggressively on the players’ market, even if it renders certain teams perennially dominant.
While this logic suggests that profit-maximizing behaviour will lead to greater competitive balance, El Hodiri and Quirk (1971) show that this generally will not be the case as long as market size and revenue potential remain disparate across the teams. Underscoring this point, a recent article by Burger and Walters (2003), using data from MLB during 1995–9 and respecifying the traditional revenue equation, find that profit-maximizing teams in the largest markets will value a player six times more than teams in the smallest markets, and that, within a given market, when a team is in contention, it can raise a player’s value sixfold.
In theory, whether owners in a league are profit or utility maximizers may also affect the success of policies to promote competitive balance. If we assume that owners maximize winning and, therefore, they spend any available revenue on improving their team, then the collective selling of television or Internet rights or other revenue-sharing schemes will improve league balance (Cairns et al., 1986; Kesenne, 1996).12 This is so because collective selling will result in less money for rich teams and more money for poor teams, and, by assumption, this will yield greater equality in payroll spending across teams. Conversely, if we assume that owners maximize profits and that fan attendance depends only on the relative quality of the home team, proportional revenue sharing will not alter the relative marginal revenues from winning and, thus, will not alter the relative payrolls or talent distribution (although all salaries would be reduced under most revenue sharing schemes) (Fort and Quirk, 1995; Vrooman, 1995; Marburger, 1997).13
There is one potentially significant caveat to the last assertion. When teams sign a free agent, they do not know how the player will perform and what impact his performance will have on revenues. They can only estimate a player’s marginal revenue product. Hiring players, then, comes along with risk. Teams with higher revenues may be less risk averse and more willing to be aggressive in the free-agent market. Revenue sharing, although it may not alter the expected relative marginal revenue product of a player, may change owner behaviour by providing poorer teams with a larger financial cushion and making them less risk averse. It may also increase the risk aversion among owners of high-revenue teams. Insofar as revenue sharing promotes either of these results, it may promote competitive balance.14
Although owners’ objectives will affect behavior and league success, existing literature does little more than suggest possible tendencies. Most observed behaviour is consistent with a variety of objective functions. In his 1971 piece on English football, Sloane observes that an owner’s objective could be “rationalised so that it is consistent with almost any type of behaviour and therefore tends to lack operational significance.” And Cairns et al. (1986, p. 10) conclude that “there are great difficulties involved in distinguishing between the competing hypotheses.”15
To be sure, owners themselves seem to have difficulty distinguishing between different objectives. Listen, for instance, to Robert Kraft, owner of the National Football League (NFL)’s New England Patriots: “And if you’re passionate about winning and you help put an organization in place that can win, the business part will follow.” And listen to Robert Johnson, founder of the BET network and [then] owner of the expansion NBA Charlotte Bobcats: “I’m first and foremost a business guy and I don’t see a distinction between a winning team and a profitable team.” Or to Mark Cuban, owner of the NBA’s Dallas Mavericks, expressing a somewhat more enlightened view:
There’s a misconception that people look at sports and say the real people who focus on the business side are just the ones that reduce costs, that the only way to really reflect running it as a business is to keep your player costs low when the reality is if I increase my sales enough it doesn’t matter what my costs are.16
The likelihood is that owner-objective functions are both more nuanced and more varied than is allowed in the literature attempting to model sports leagues. In the next section, I suggest a more complex view of what today’s club owners seek to maximize.
III. WHAT DO OWNERS REALLY SEEK?
Owners, in fact, take their returns on sports franchises in a number of ways. As indicated above, one obvious aspect of their return is the fun, perquisites, power, and ego gratification they receive. Ownership, in part, is a consumption good. Thus, it would make sense to think of owners as maximizing their total (consumption and investment) return, not just their financial profit.
A significant part of the investment return is indirect. For instance, team ownership provides opportunities to develop new business relationships and to leverage political influence—potentially benefiting the owner’s other investments as well as the sports team….
With few exceptions, franchise ownership also produces substantial capital gains. According to Fort’s estimates (2002, p. 389), during the 1990s the average annual rates of franchise appreciation were 11.3 per cent in MLB, 17.7 per cent in the NBA, 10.7 per cent in the National Hockey League (NHL), and 12.7 per cent in the NFL. Moag (2002, p. 2), using a different methodology and updating through mid-2002, estimated the annual rate of return to owning a baseball franchise to be 12.44 per cent from 1960 to 2002, which would put it well above the return to common stock ownership for the same period (6.91 per cent for the S&P 500 through 30 June 2002).18 According to Szymanski and Kuypers (1999, p. 19), an investor who paid 385 pence for a share of Manchester United stock in 1991 and sold the share in mid-1998 would have experienced a capital gain of £24.40 on the single share for an annual rate of return of above 30 per cent.
In each of these instances—consumption value, business connections, political ties, tax benefits, and capital gains—the investment return will not show up on the income statement and is long term in nature. Other than the tax shelter, each of these returns is enriched by having a winning team. This suggests that owners’ objective functions may contain both wins and profits. It may also include accumulation of star players.
There is also a great many ways for an owner to take short-run and pecuniary returns.19 First, an owner can boost other companies in his or her portfolio through favoured contracting with the team. Many team owners today own entities (such as TV, cable, or radio stations, and facility management, concessions, or chartering companies) that do business with the team. When the owner does business with himself he can charge whatever prices he likes—it is money in one pocket or the other. This practice, known as a related-party transaction or transfer pricing, can reduce reported franchise revenues substantially. Consider the example of MLB’s Chicago Cubs.
According to 2001 figures that MLB Commissioner Bud Selig delivered to the U.S. Congress, the Chicago White Sox’s income from local TV, radio, and cable was $30.1m, and that of the Chicago Cubs was $23.6m. Yet, everyone knows that the Cubs are by far the more popular team in the Windy City, and TV ratings bear this out: in 2001 the Cubs’ average ratings were 6.8 on over-the-air broadcasting and 3.8 on cable; the White Sox’s were 3.6 and 1.9, respectively. And this does not take account of the fact that the Cubs games are shown on super-station WGN which reaches 55m-plus homes nationally.
So, how can we understand Selig’s figures? The Cubs are owned by the Tribune Corporation, which also owns WGN. [Ed. Note: The team and its related properties were sold to Tom Ricketts in 2009 for $845 million.] The Tribune Corporation, in effect, is transferring revenue away from the Cubs and lowering the costs of WGN. It does this by using related party transactions, which are entirely lawful and widely used in the sports industry and across business generally. According to Broadcasting & Cable, the industry’s authoritative source, the estimated value of the Cubs’ local media earnings in 2001 was $59m. If the Cubs reported this figure instead of $23.6m, then their reported $1.8m loss would become a $33.6m profit in 2001!20
Why would the Cubs (and all other baseball teams) want to reduce their reported revenues? There are several possible reasons. First, since 1996, MLB has had a revenue-sharing system that levies a tax on a team’s net local revenues. In 2001 this tax was at 20 per cent (in 2003 the effective marginal tax rate is close to 40 per cent) (Zimbalist, 2003, ch. 5). Thus, for every dollar in local revenue not reported in 2001, the team saved just under 20 cents.21 Since WGN pays no such tax to the broadcasting industry, it is preferable for the parent corporation, Tribune, to have the profits appear on WGN’s books.
Second, baseball teams (and even the Cubs, who were seeking public permission to erect higher leftfield stands in 2002) seek various kinds of public support for their facilities. They may believe that the more impecunious they appear, the more likely it is that such support will be forthcoming.
Third, every few years the owners negotiate with the players over a new collective-bargaining contract. The owners always seek new restrictions in the labour market to lower salaries. One of the justifications for these restrictions commonly is that the teams are losing money. Whether or not the Players Association is persuaded by such arguments, it appears to be permanently fixed as part of the owners’ opening gambit.
Fourth, MLB is the only professional sport in the United States that has a presumed antitrust exemption. Periodically, MLB is called before Congress to justify this special treatment. One of the arguments that MLB has repeatedly trotted out—most recently by Selig before the U.S. Congress in December 2001—is that the industry cannot possibly be abusing its market power because it is not profitable.
Fifth, ownership may believe that claims of poverty may help to justify higher ticket or concessions prices to the fans.
As in the example of the Chicago Cubs, many MLB teams and teams in other sports make extensive use of related party transactions. In each case, the team’s true financial return is unlikely to be found on the bottom line. Hence, a cursory glance at a team’s income statement is unlikely to reveal ownership motives.
More generally, it is common for owners to treat sports teams as part of their entire investment portfolio. Often, the team itself is not managed as a profit centre, but rather as a vehicle for promoting the owner’s other investments. Owners can take their investment returns in a number of ways. For instance, George Steinbrenner used his New York Yankees to create the YES regional sports network in the nation’s largest media market. In 2001, YES had a market value upward of $850m. Rupert Murdoch admitted that his purchase of the Dodgers paid off because it enabled him to prevent Disney from creating a regional sports network in southern California. In 1998, Disney had signed up its MLB Angels and NHL Mighty Ducks to a 10-year cable contract with Fox Sports Net West II for a seemingly well-under-market $12m a year. It is not unlikely that Disney received other benefits from the News Corp. (such as carriage at an attractive price for Disney’s many cable channels on the News Corp.’s worldwide satellite distribution systems).
Tom Hicks hopes to use his ownership of the Texas Rangers to develop some 270 acres of commercial and residential real estate around the ballpark in Arlington and to grow his Southwest Sports Group, among other things. [Ed. Note: These efforts proved unsuccessful, and Hicks sold the Rangers in 2010.] Dick Jacobs exploited his ownership of the Indians to promote the value of his downtown real estate. And so on. Once again, the team’s income statement will not tell the whole story.
One important implication of the preceding discussion is that competitive balance may be more elusive to sporting leagues. Not only may different owner objective functions and team-specific revenue potentials engender imbalance, but team synergies with related business interests may exacerbate inequalities. For instance, when Tom Hicks signed Alex Rodriguez to a 10-year deal for $25.2m annually, he was thinking about the return A-Rod would bring to all of his businesses, not just to the Rangers. Thus, what might appear as utility-maximizing behavior by an owner is really global (portfolio-wide) profit-maximizing behavior. Put differently, owners may find that the best way to profit maximize globally is to win maximize at the team level.24
When owner investment in players yields returns to both the ball club and to other businesses of the owner, this may be a significant additional source of league imbalance. Under such circumstances, leagues may be justified in imposing constraints on the legal form of ownership, such as proscribing corporate ownership.
In the United States, however, other than the general and welfare-diminishing prohibition on municipal ownership in all leagues, the NFL is the only league to limit systematically the ownership form. It does so by outlawing corporate ownership. There is an irony here, because the NFL, with its relatively hard salary cap and extensive revenue sharing, is probably the only U.S. league that does not have to worry about competitive balance.
….
In sum, one obvious conclusion to draw from the foregoing discussion is that owners maximize global, long-term returns and that these are very different from a team’s reported annual operating profits. While, at today’s stratospheric franchise prices, it is problematic for most owners to be pure sportsmen—maximizing utility without a financial constraint—it is almost a certainty that different owners give different weights to the variety of arguments in their objective functions. The next task for modelling the behaviour and performance of sports leagues is to take fuller account of this probable diversity of ownership objectives within a given league.
References
Brower, J. (1977), ‘Professional Sports Team ownership: Fun, Profit and Ideology of the Power Elite’, Journal of Sport and Social Issues, 1(1), 16–51.
Burger, J., and Walters, S. (2003), ‘Market Size, Pay, and Performance: A General Model and Application to Major League Baseball’, Journal of Sports Economics, 4(2), 108–25.
Cairns, J., Jennett, N., and Sloane, P. J. (1986), ‘The Economics of Professional Team Sport: A Survey of Theory and Evidence’, Journal of Economic Studies, 13, 3–80.
Dabscheck, B. (1975a), ‘Sporting Equality: Labour Market versus Product Market Control’, Journal of Industrial Relations, 17(2), 174–90.
——— (1975b), ‘The Wage Determination Process for Sportsmen’, Economic Record, 51(133), 52–65.
Daly, G., and Moore, W. (1981), ‘Externalities, Property Rights and the Allocation of Resources in Major League Baseball’, Economic Inquiry, 19(1), 77–95.
Davenport, D. S. (1969), ‘Collusive Competition in Major League Baseball: Its Theory and Institutional Development’, American Economist, 13, 630.
Demmert, H. G. (1973), The Economics of Professional Team Sports, Lexington, MA, D. C. Heath.
El Hodiri, M., and Quirk, J. (1971), ‘An Economic Model of a Professional Sports League’, Journal of Political Economy, 79(6), 1302–19.
Ferguson, D. G., Stewart, K., Jones, J. C. H., and LeDressay, A. (1991), ‘The Pricing of Sports Events: Do Teams Maximize Profit?’, The Journal of Industrial Economics, 34(3), 297–310.
Fort, R. (2002), Sports Economics, Upper Saddle River, NJ, Prentice Hall.
——— and Quirk, J. (1995), ‘Cross Subsidization, Incentives and Outcomes in Professional Team Sports Leagues’, Journal of Economic Literature, 33(3), 1265–99.
——— (2002), ‘Owner Objectives and Competitive Balance’, Washington State University, unpublished manuscript.
Hunt, J. W., and Lewis, K. A. (1976), ‘Dominance, Recontracting and the Reserve Clause: Major League Baseball’, American Economic Review, 66(5), 936–43.
Jones, J. C. H. (1969), ‘The Economics of the National Hockey League’, Canadian Journal of Economics, 2(1), 1–20.
Kesenne, S. (1996), ‘League Management in Professional Team Sports with Win Maximizing Clubs’, European Journal for Sports Management, 2, 14–22.
——— (2000), ‘Revenue Sharing and Competitive Balance in Professional Team Sports’, Journal of Sports Economics, 1(1), 56–65.
——— and Jeanrenaud, C. (1999), ‘Introduction’, in S. Kesenne and C. Jeanrenaud (eds), Competition Policy in Professional Sports, Antwerp, Standard Editions.
——— and Pauwels, W. (2002), ‘Club Objectives and Ticket Pricing in Professional Team Sports’, Department of Economics, University of Antwerp, unpublished manuscript.
Koppett, L. (1973), ‘A Strange Business, Baseball’, The New York Times Magazine, 2 September.
Lewis, M. (2003), Moneyball: The Art of Winning an Unfair Game, New York, Norton.
Marburger, D. (1997), ‘Gate Revenue Sharing and Luxury Taxes in Professional Sports’, Contemporary Economic Policy, 15,114–23.
Markham, J., and Teplitz, P. (1981), Baseball Economics and Public Policy, Lexington, MA, D. C. Heath.
Michener, J. (1976), Sports in America, New York, Random House.
Moag, J. (2002), Moag & Company Industry Analysis, Spring.
Neale, W. (1964), ‘The Peculiar Economics of Professional Sports’, Quarterly Journal of Economics, 78, 1–14.
Noll, R. G. (1974), ‘Attendance and Price Setting’, in R. G. Noll (ed.), Government and the Sport Business, Washington, DC, Brookings.
Rascher, D. (1997), ‘A Model of a Professional Sports League’, in W. Hendricks (ed.), Advances in the Economics of Sport, Vol. 2, Greenwich, CT, JAI Press, 27–76.
Rottenberg, S. (1956), ‘The Baseball Players’ Market’, Journal of Political Economy, 64, 242–58.
Schofield, J. A. (1982), ‘The Development of First-class Cricket in England: An Economic Analysis’, Journal of Industrial Economics, 30(4), 337–60.
Scully, G. (1974), ‘Pay and Performance in Major League Baseball’, American Economic Review, 64(6), 915–30.
——— (1989), The Business of Professional Baseball, Chicago, IL, University of Chicago Press.
——— (1995), The Market Structure of Sports, Chicago, IL, University of Chicago Press.
Sloane, P. J. (1971), ‘The Economics of Professional Football: The Football Club as a Utility Maximiser’, Scottish Journal of Political Economy, 17(2), 121–46.
Szymanski, S., and Hall, S. (2003), ‘Making Money Out of Football’, The Business School, Imperial College, London, unpublished manuscript.
——— and Kuypers, T. (1999), Winners and Losers: The Business Strategy of Football, London, Viking Books.
Vrooman, J. (1995), ‘A General Theory of Professional Sports Leagues’, Southern Economic Journal, 61, 971–90.
Zimbalist, A. (1992a), ‘Pay and Performance in Major League Baseball: Beyond the Scully Model’, in P. Sommers (ed.), Diamonds Are Forever, Washington, DC, Brookings Institution Press.
——— (1992b), Baseball and Billions, New York, Basic Books.
——— (2003), May the Best Team Win: Baseball Economics and Public Policy, Washington, DC, Brookings Institution Press.
Notes
….
2. In their excellent overview of English soccer, Stefan Szymanski and Tim Kuypers (1999, p. 16) write that the FA first imposed dividend limitations in 1896. The first limit was 5 per cent of paid-in capital. It was raised to 7.5 per cent in 1920 and to 15 per cent in 1983, but most teams had ceased to pay dividends in the 1950s.
3. The most common formalization of this approach is to assume win maximization subject to a break-even constraint.
4. Quoted in the Sports Business Daily, 14 May 2003, p. 20.
….
7. This result may be altered if home-field advantage is partially based on attendance.
8. Szymanski and Kuypers (1999, p. 19) point out that when Manchester United went public in 1991, it organized a holding company that received most of the team’s revenue. Among other things, the holding company was a way to avoid FA regulations over the appointment of directors and limitations on dividend pay-outs.
9. This point is nicely exposited by Szymanski and Hall (2003). Depending on one’s assumptions, if clubs are constrained win maximizers, they may evince the same labour-market behaviour as profit maximizers. If owners were unconstrained win maximizers, they presumably would invest in increments to player talent until the last player had zero productivity.
10. Fort and Quirk (2002), however, point out that, assuming concavity in teams’ revenue functions, the level of competitive imbalance in a profit-maximizing or constrained win-maximizing league is indeterminate.
11. Rottenberg (1956) also argued that diminishing returns to additional star players would support the appropriate level of competitive balance.
12. Kesenne (1996) finds this to hold if the owner maximizes wins subject to a break-even financial constraint. Kesenne (2000) finds it to hold even without a break-even constraint. Still another possibility not considered in the literature is that owners will spend revenues from sources other than their sports franchises to improve team quality.
13. In contrast, if we assume profit maximization and that attendance is a function of the quality of both the home and visiting teams, then increased revenue sharing will equalize the distribution of talent (Marburger, 1997). Rascher (1997) posits an objective function with both profits and wins as arguments and shows that if clubs assign different weights to winning, revenue sharing will promote league balance.
14. To the extent that risk aversion differs between profit- and utility-maximizing owners, the relationship between payroll size and ownership objectives becomes still more complicated.
15. This conclusion is also reached by Fort and Quirk (2002) and by Kesenne and Pauwels (2002).
16. Quoted in the Sports Business Daily, 16 May 2003.
….
18. Using data through the early 1990s, Scully (1995, ch. 6, pp. 118–25) finds even higher annual rates of return on sports franchise ownership.
19. What follows in the text is not intended as an exhaustive list of the ways ownership can manipulate the results on an income statement. Another common practice is for an owner to lend money to a partnership and then have the partnership buy the team. The owner in this case receives his return via interest payments on his loan and these interest payments enter the income statement as costs, lowering team book profits. It is also common for the owner to receive financial returns by benefiting from salary, consulting fees, or perquisites, and by hiring family members.
20. It is possible that this figure should be adjusted for the super-station payments that the Cubs make to MLB, which are probably in the order of $15m annually. It is also possible, however, that the Broadcasting & Cable figure is conservative.
21. The reason the net tax was just under 20 cents was that the team gets back roughly one-thirtieth of every dollar it contributed.
….
24. To the extent that this is true, of course, the win-maximization assumption would be appropriate for modelling ownership behaviour in a sports league.
….
THE VALUE OF MAJOR LEAGUE BASEBALL OWNERSHIP
Rodney Fort
Major League Baseball (MLB) owners have always made the same claims. There’s never enough left-handed pitching. And nobody ever makes any money with a baseball team. According to Scully (1989, p. 126), “Whining about lack of profit from owning a baseball club has been a sacred tradition among owners from time immemorial.” He cites a case back to 1880 and other famous quotes abound (these were gleaned from USAToday.com’s “Antitrust Quotes”):
Unless something happens, we’re all going to be out of business. When you have as many teams as there are losing money, something has got to give.—Cleveland Indians chairman Patrick J. O’Neill, February 27, 1985.
We have a remarkable number of teams losing a lot of money.—Milwaukee Brewers owner Bud Selig in testimony to a House subcommittee, September 22, 1994.
Professional baseball is on the wane. Salaries must come down or the interest of the public baseball must be increased in some way. If one or the other does not happen, bankruptcy stares every team in the face.—Chicago White Stockings owner Albert Spalding, 1881.
More recently, Commissioner Selig’s report on finances for 2001 (Street & Smith’s Sports Business Journal, December 10, 2001, p. 44) showed 19 MLB teams in the red to the tune of $362.3 million (prior to revenue sharing). Since there were 11 teams $130.1 million to the good, consolidated losses were reported at $232.2 million for that season.
The findings in this paper shed light on these claims based on basic finance principles…. Data limitations prohibit a direct assessment of the value of professional team sports ownership. But, given that competition over the purchase of MLB teams appears to be brisk, team sale prices should approximate the expected discounted future value of ownership. Further, the observed growth rate in team prices should also be at least as large as the next best alternative growth that owners could enjoy.
An alternative view is that owners don’t care about cash flow, or pursue other goals. This view suggests that they are sports consumers with budgets so large that they simply buy the objects of their consumption affection. While some owners no doubt derive consumption value, the vast majority of owner behavior reveals them to be thoroughly professional business people with a keen eye toward the bottom line (Fort, 2003, Chapter 1). Further, as is quite well known, there are other monetary values to owning a team that are not captured on their income–expense reports.
These principles lead to two main findings on actual MLB team sale prices. First, the mean and median growth in team sale prices over the modern history of MLB easily exceed a standard comparison, namely, 3% real growth in the economy at large. Second, the expected growth rate from time of purchase to time of sale has fluctuated over time. The average real growth rate in team sale prices exceeded the 3% typical growth rate in the economy at large from the 1900s through the 1940s. Indeed, prior to the 1930s, growth rates were over three times this comparison value. The 1950s through the 1970s were, indeed, a down period below the 3% comparison. But a strong rebound occurred in the 1980s. Recently, in the 1990s, the growth rate was essentially zero. This roller-coaster ride reveals that owner claims are partly consistent with the data, but not always.
There are other interesting findings as well. First, as with other financial assets, there is a strong relationship between risk, measured by the variance in team sale prices, and expected return, measured by average sale prices. Second, owners appear to have learned over time how to price expansion franchises closer to a reasonable estimate of the expected discounted value of future profits. Third, omitting the tumultuous decade surrounding World War II, the period of ownership fell dramatically in the 1960s and again in the 1990s. Finally, the portion of the value of ownership that is not associated with annual operations appears to be significant, possibly in the tens of millions of dollars.
The paper proceeds as follows. In Section II, the approach to analyzing the value of team ownership is presented and some insights are offered on the popular Financial World/Forbes annual team valuations. Section III presents the historical growth of team sale prices and expansion fees. The analysis also yields some estimates of the values of ownership beyond team annual operating profits. Conclusions round out the paper in Section IV. Formal modeling of the determination of team prices would improve our understanding greatly, but the length of such an analysis precludes its inclusion here.
THE VALUE OF TEAM OWNERSHIP
Those seeking to analyze the value of team ownership should keep this warning from Scully (1989, p. 129) well in mind:
To the researcher, the analysis of profit in baseball is a particularly difficult undertaking, because uniform audited financial data from the clubs generally is not available, because expended items frequently cover some portion of profits, and because the financial return to ownership is multifaceted.
The value of owning a pro sports team clearly exceeds annual operating profits. The following is a more complete categorization of ownership values:
1. Annual operating profits.
2. Shelters from federal income taxes.
3. Spillovers to other wealth generating elements of the owner’s portfolio.
4. Profit taking from the expense side.
5. League revenue sharing, including future expansion fees.
Throughout this section, EBITDA refers to earnings before interest, taxes, depreciation, and amortization and ITDA will be used as shorthand for those deductions from earnings.
Item 1 should be clear enough. After all is said and done, even after ITDA, there may be annual operating profits. But these can be difficult to discern and, to see why, let’s turn immediately to Items 2 and 3. The sports accounting practices that come into play have been allowed by the IRS since 1959 (Scully, 1989, p. 130). Okner (1974) was the first to treat these practices academically more than 30 years ago. And despite the fact that they were treated academically again by Scully (1989) and Quirk and Fort (1992), and are now the stuff of sports economics textbooks (Fort, 2003), these accounting practices are completely neglected in the popular analysis of sports team profits.
While there are other nuances concerning tax restructuring and capital gains (covered in detail in the works just cited), the easiest tax shelter to see is produced by the so-called “roster depreciation allowance” (henceforth, RDA). In 1959, Bill Veeck bought the Chicago White Sox for the first time. He argued that players “waste away” like livestock and, since livestock could be depreciated, why not players? The IRS agreed and the RDA was born.
After a few investigations of subsequent use of the RDA by other owners, the IRS finally settled in the late 1970s on the following. An owner could allocate 50% of the purchase price of a team to a five-year depreciation schedule without challenge. Any deviation had to be justified by the taxpayer. That ruling held until just recently and federal tax law amendments now allow 100% of the team sale price to be depreciated for 15 years.
While the merits of Veeck’s argument are debatable (again, see the works just cited), and why it is that players can be both depreciated and expensed has not been addressed, the results for sports team owners have been valuable to say the least. The RDA, coupled with structuring the team as a pass-through for tax purposes, generates a tax shelter as follows. I buy a team for about the average price through the current decade, $255 million. I can depreciate the entire $255 million over 15 years. For easy presentation, suppose a flat schedule at $17 million per year. This $17 million annually is my RDA. Suppose my EBITDA in year one is $25 million and interest, actual physical depreciation, and amortization equal $20 million. Annual operating profits subject to taxation would be $5 million. But now my RDA comes into play—subtracting the $17 million RDA generates a $12 million loss for the year. My tax liability from the team is erased.
But what really happened? The $5 million subject to taxation is never really lost; it’s a paper reduction according to allowable IRS rules. So I enjoy that $5 million tax-free. But it gets better still. If the team is originally structured as a pass-through (e.g., a Subchapter S Corporation), then the $12 million paper loss goes through to my 1040 Form and shelters other income according to my marginal tax rate. Owners surely pay the top 35% marginal tax rate so about $4.2 million in other earnings is sheltered. From the owner’s perspective, this is the best kind of $12 million “loss” possible. In The Hustler’s Handbook, Bill Veeck jokes, “We play the Star-Spangled Banner before every game. You want us to pay taxes, too?”
Let’s move on to Items 3 through 5. Spillovers to other wealth generating items in the owner’s portfolio occur along a spectrum of complexity. The more pedestrian include the value of entertaining that might lead to future business dealings; nothing like a night in the owner’s box for lively business interaction. More complex is access to information concerning future government decisions that can affect the current and future business dealings of an owner. And then we get to the deeply complex, as in the following example offered by Zimbalist (1998).
The Florida Marlins won the 1997 World Series. Then owner Wayne Huizenga claimed losses of $30 million for that year. But Huizenga also owned the stadium where the Marlins played and the regional media carrier of the team’s locally broadcast games. Zimbalist (1998) presents an argument that shifting reported revenues between the team, stadium, and media unit could reduce the amount of revenue shared with other MLB owners as well as produce a tax savings. By Zimbalist’s account, the $30 million loss could easily be a $13.8 million gain.
The last two values of ownership are much more straightforward. Profit taking on the expense side is common in all business structures; health care benefits, transportation, and entertainment expenses commonly displace similar expenditures that owners would otherwise have to take on themselves. And low-rate loans from “the team” to “the owner” are common. Finally, membership in a pro sports league entitles team owners to net revenue sharing amounts dictated by league sharing rules (of course, this might be negative if the team is in a relatively larger-revenue market) as well as an equal share of future expansion fees.
The foregoing provides the basic model for an approach to analyze team sale prices and expansion fees. The most anyone should pay for a team (or expansion franchise) should be the real discounted net present value (DNPV) of the stream of returns: …. what can reasonably be referred to as the stand-alone asset value of ownership and should be equal to the discounted stream of real annual operating profits alone. While it is only one of the ownership values, it is the object of attention in much of the discussion of MLB owner profits … [and] was clearly the object of analysis in Commissioner Selig’s presentations during the last labor–management negotiations in 2001. And independent assessments also focus on this amount. For example, in personal correspondence with Michael Ozanian, one of the authors of the Financial World–Forbes (henceforth, FW-F) team valuation reports, it was revealed that those reports are a “multiple of revenues” estimate, adjusted for specific stadium/arena lease factors estimated by those authors.
The usefulness … is that both actual team sale values… and reports on team valuations … are available. And that means we can approximate values of ownership other than annual operating profits, namely, by simple subtraction. This approach helps us sidestep one of Scully’s warnings that ownership is multifaceted and still get an estimate of that value.
But we should proceed with caution in this type of comparison. Under the “multiple of revenues” approach, a benchmark is set at some multiple of a team’s revenues over time. Lately, reputable finance houses have raised this multiple from around 3.0 to 5.5 (Kaplan, 2004). But revenues can be shifted for some teams, as in the preceding Marlins example, so that reported revenues used in the “multiple of earnings” approach are understated. This means that teams with higher spillover values and understated reported revenues will have artificially understated estimates….
As an aside, the “discounted cash flow” approach to team valuation estimates team sale prices as the amount someone is willing to pay today in order to receive the anticipated cash flow in future years…. But, with the RDA and other tax complications, then Blue Jays President and COO Paul Beeston instructs us as follows (found at the same USAToday.com location cited earlier in the section):
Anyone who quotes profits of a baseball club is missing the point. Under generally accepted accounting principles, I can turn a $4 million profit into a $2 million loss, and I can get every national accounting firm to agree with me.
It is straightforward sports accounting to show negative cash flows, rendering the “discounted cash flow” method without its required data.
THE GROWTH IN MLB FRANCHISE PRICES
The aims of this section are to 1) assess the growth of team sale prices and expansion franchise fees, and 2) calculate ownership value other than annual operating profits as in expression (2). The data used to analyze team sale prices and expansion team prices are from popular sources and are listed at the author’s webpage, http://www.rodneyfort.com (click on the “Sports Business Data Area” link). Expansion episodes are reserved for separate treatment since that price isn’t really the price of a team.
The transaction data were constructed as follows. If a team sells at time t for Pt and then sells again at time t+ for Pt+, then the buy and sell pair for this transaction at t+ is (Pt, Pt+). Throughout the data, the actual owner at time t is not necessarily the owner that sells at time t. In many cases, there were intervening transactions for which there are no data. Purchases of less than 100% were adjusted to full-purchase price. No transactions that included other inseparable purchases (real estate, broadcasting ventures, teams in other leagues, and stadiums) were included.
The unit of analysis is the franchise, not the location. For example, the history of the value of the MLB Braves includes their travels from Boston (1901–1952) to Milwaukee (1953–1965) and on to Atlanta (1966–present). This follows since a foresighted owner knows full well that moving a team to a new location is within the realm of possibility and certainly can affect the growth in value of the franchise. In addition, transactions that occurred in steps are treated as a single transaction, including the CBS purchase of the New York Yankees that occurred from 1964–1967.
Only one subjective judgment was made on a transaction—the buyout of the final Marge Schott estate holding of 1/15 of the Cincinnati Reds produced a team value that simply was unbelievably too low. The result is 95 separate transactions for 28 different teams over the period 1902–2004. All values are adjusted to 2004 U.S. dollars (some deflators for the earliest sales were extrapolated).
In the literature, Scully (1989, 1995) examines profitability and return for MLB teams, but only for a few years each time. Quirk and Fort (1992) compare nominal rates of return to the rate of return on industrial common stocks for the same data used here, through 1990, and then extend that calculation in nominal terms to sales episodes during the 1990s (Quirk & Fort, 1995). Zimbalist (1992) produces an overall nominal and real growth rate, for the entire period of the 1910s through the 1980s. But all of these works included sales with inseparable purchases other than the team. Here, those episodes are omitted and real growth rates are compared to the typical real growth rate in the economy of 3%.
Table 3 shows all of the transactions organized by franchise. The clear observation is that there was astronomical growth for some transactions. The truly fabulous all involve the earliest purchases of the older teams, although there have also been handsome growth rates in more recent times, with a few just breaking into double digits relative to the comparison 3%. This observation is consistent with imputation of monopoly power into the purchase price; subsequent returns may still be large relative to 3%, but there’s nothing like being the earliest owners to capture monopoly profits (the Cardinals price grew at a 124.6% rate from 1920–1925; the Boston Braves price increased 62.5% in one year, 1910–1911). There also were some large declines in some of the transactions (the 1965 sale of the Senators2 and the 1973 sale of the Indians, and the White Sox decline of 11.1% in 1975 and then, subsequently, another 13.6% in 1981). But on balance the mean and median are well in excess of the 3% comparison.
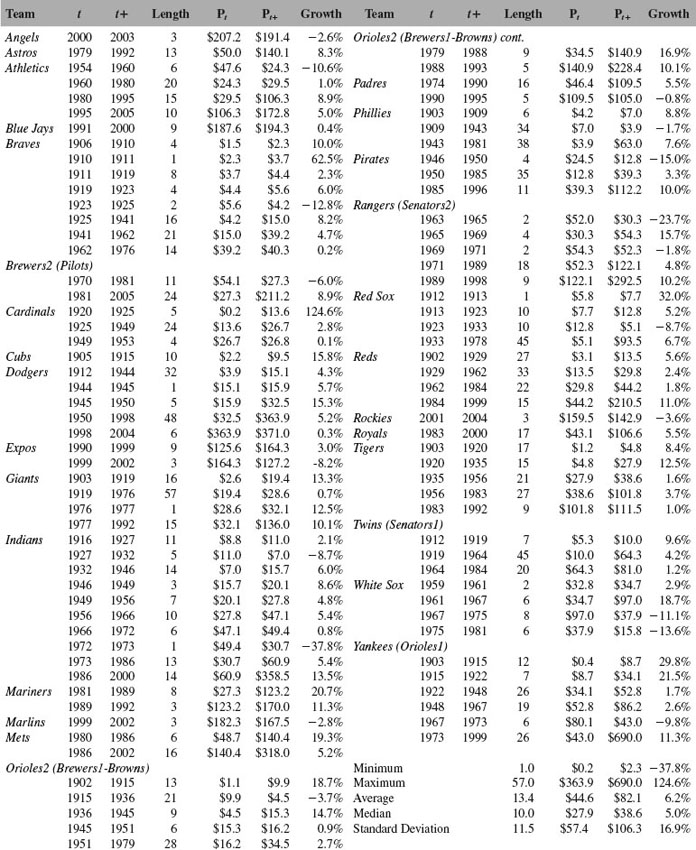
Sources: Author’s webpage, http://www.rodneyfort.com (click on “Sports Business Data Area” link). Previously published in International Journal of Sport Finance. Used with permission from Fitness Information Technology.
Notes: The transaction time endpoints are (t, t+); buy and sell prices for each transaction are (Pt and Pt+); growth is calculated over the length of time between t and t+. The formula simply solves the standard discounted present value formula for the rate that would change prices from Pt to Pt+ over the period t to t+.
The aggregation in Table 4 covers beginning and end results for each franchise as opposed to separate transactions for insights into longer-term ownership. The Cardinals, Cubs, and Mariners top the list, each over five times the 3% comparison. As with the individual transactions, the team-level aggregates have both average and median growth rates well in excess of the 3% comparison. And, of course, there have been clubs, decline in price. There are seven losers relative to the 3% comparison (Angels, White Sox, Rockies, Marlins, Athletics, Expos, and Blue Jays). But an actual decline in the purchase price only happens for four of these franchises (Angels, White Sox, Rockies, and Marlins). And of these four, only one is over any reasonable amount of time to judge (the White Sox at 22 years, while the period for the rest is only three years). So, we can be pretty sure that 21 franchises did as well or better than the comparison 3% (and some very well, indeed) and that four franchises did not: the White Sox, Athletics, Expos, and Blue Jays. The following conclusion is a fair one: Owning a MLB franchise almost always generates growth in the sale price that exceeds the 3% comparison, and typically (at the median) by about 50%.
One item of interest, relevant to whether or not a market is producing results in line with standard finance notions, is whether or not there is a relationship between risk and return. At the team level, one can calculate the mean growth for teams with more than one transaction and the variance. The correlation between the means of sale prices (MEAN Pt) and their variance (VAR Pt) is 0.516. And a simple regression across teams yields the following:
![]()
Standard errors are in parentheses and the F-value of the regression is significant at the 95% level. While clearly much of the variation in mean sale prices remains to be explained, there is some support that higher variance leads to higher mean prices consistent with the risk-return explanation.
Formal time series modeling of the behavior of team sale prices is beyond the aims of this particular paper, so we end with the preceding conclusions. But there is one more observation that can be made by aggregating across teams over time. While no market participant can buy a portfolio of baseball teams (the few sales of shares have been mostly gimmick short-term fund-raisers and almost immediately bought back), or speculate on some “index value” of baseball teams, they can use the aggregated information to guide their assessment of the value of purchasing any particular team. And this is especially true for the purchase of an expansion franchise.
But let’s be clear. I might ask myself what the expected net discounted present value of ownership might be. This would be associated with similarly situated teams; in the comparison for expansion teams that follows, the average should be an over-statement since expansion teams in MLB typically look more like smaller-revenue market teams.
The behavior of prices, from this perspective, is shown in Table 5. If an owner bought in a given decade, what rate of growth did they enjoy to eventual sale (sort Table 3 by Pt and take averages by decade)? Again, the highest growth rates were captured by the earliest owners. Coupled with the observations around Table 4, baseball was simply a booming business through its first 40 modern years. Growth over time moderated considerably for those buying teams in the 1950s through 1970s. And then there’s a fascinating episode for the 1980s. The average for those buying in the 1990s is essentially zero. The verdict is still out on those buying in the 2000s; only two of them sold their teams and they didn’t hold them for very long.
A standard approach in evaluating owner choices is to compare to a buy-and-hold strategy. For example, suppose a team purchased in a given decade was held the average period that owners actually held their teams purchased in that decade. This strategy beats the decade average growth actually observed in the 1970s and 1990s (two low periods for buyers). But following this strategy would have been the height of foolishness through the first five decades of MLB and in the 1990s. While owners are typically on the ball relative to this objective buy-and-hold strategy, learning why growth is relatively so low in the 1970s and 1990s remains for future work. An obvious explanation is that if all owners sold according to this strategy, franchise prices may not be the actually observed average Pt used in the buy-and-hold calculation.
It is worth noting two other observations generated by this look at decade aggregates. First, the average period of ownership drops off sharply during the War years, as might be expected in a time of high uncertainty. But it also drops off dramatically in the 1960s and again in the 1990s.
Second, this look at aggregates by decade also shows that taking on higher risk purchases yields a greater mean return. The correlation between the mean and variance of decade-average sell prices is 0.823. Running a regression similar to the earlier one for team observations, one finds the following:
![]()
The variables are as before with YEAR the last year in the decade where there was a sale. Standard errors are in parentheses and the F-value of the regression is significant at the 99% level. Even accounting for the significant trend over time, there is a significant positive relationship between risk and return and very little of the variation in mean return remains to be explained. Let’s see how the information in Table 5 can inform us about expansion franchise fees.
Table 6, Panel A, shows the fees and averages for the five MLB expansion episodes, along with growth rates from episode to episode and over the entire period where any expansion is observed. While not really a team sale price, expansion fees are reflective of a prospective owner’s anticipation of collecting the type of values listed in Section II, and detailed in Table 5. And let’s remember that expansion fees are low-end estimates of ownership value since expansion should occur into economically marginal territories; otherwise, existing owners would want to move there.
Table 4 MLB Summary (2004) (in Millions)
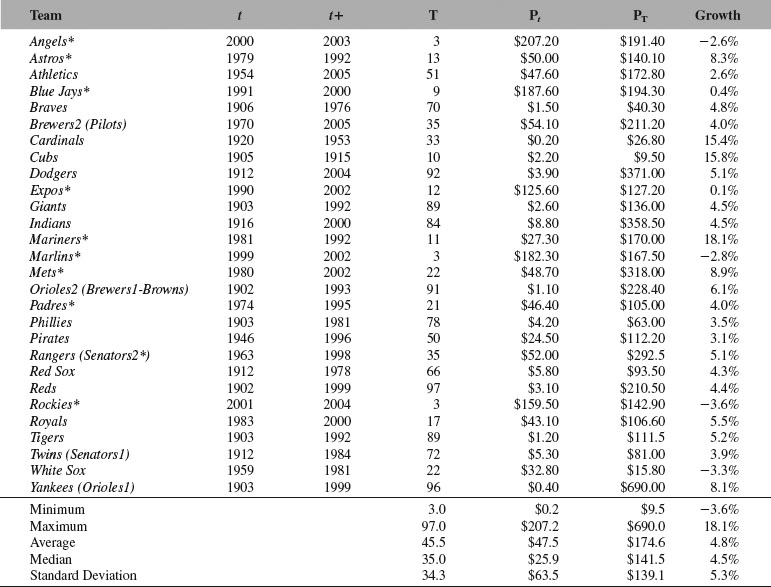
Source: Author’s webpage, http://www.rodneyfort.com (click on “Sports Business Data Area” link). Previously published in International Journal of Sport Finance. Used with permission from Fitness Information Technology.
Notes: See Table 3. In addition, T is the length of time between the first buy and last sell for each franchise. *Denotes expansion teams used for calculations in the text (Senators2 to 1971).
Table 5 Growth in Pt by Decade Average Period of Ownership and Buy-And-Hold to 1999 (2004) (in Millions)
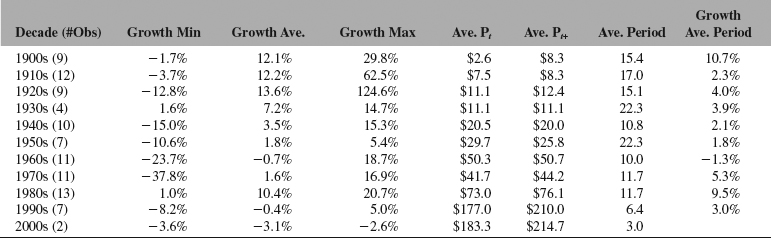
Source: Author’s webpage, http://www.rodneyfort.com (click on “Sports Business Data Area” link). Previously published in International Journal of Sport Finance. Used with permission from Fitness Information Technology.
Table 6 MLB Expansion Fees (2004) (in Millions)
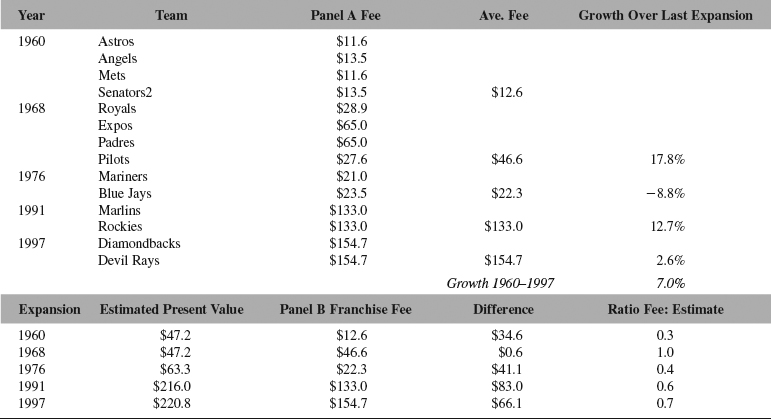
Source: Author’s webpage, http://www.rodneyfort.com (click on “Sports Business Data Area” link). Previously published in International Journal of Sport Finance. Used with permission from Fitness Information Technology.
Over the full sample period, real expansion fees rose from a 1960 average of $12.6 million to $154.7 million in 1997. That’s a real annual growth rate of 7.0% over 37 years but includes a significant decline in the 1976 expansion. This overall high rate of growth relative to the growth rate in the general economy might be explained by recognition on the part of prospective owners that the returns to expansion franchises are more risky. And there is some evidence to support this view.
All expansion franchises except the Pilots and the most recent Diamondbacks and Devil Rays appear in Table 4. Seven of the 11 are below average and all of the observations with negative growth rates (except the White Sox) were expansion franchises. And the overall average for the 11 expansion teams (including the Senators2 to 1971 with a growth rate essentially equal to zero) with observations in Table 4 is 3.4%.
But the evidence isn’t complete on the idea that expansion franchises are quite risky prospects. For example, the Astros (8.3%), Mets (8.9%), and Royals (5.5%) are all strong performers and the Mariners (18.1%), thanks to the dot.com boom in the Seattle area, show the highest rate of real growth of all teams in Table 4. In addition, the Pilots, arguably the worst experiment in modern MLB history, sold for $54.1 million in 1970 when the average sell price was $44.2 million (Table 5). So, while risky on average, there were some true gems in the expansion mix. This begs an alternative explanation and one does present itself.
Table 6, Panel B, compares an estimated present value of profits to franchise fees. The estimated present value is found as follows. Suppose an existing team were purchased at the same time as the 1960 expansion. Given that the average period of ownership for those buying in the 1960s was 10.0 years (Table 5), and the rate of growth for buyers in the 1960s was 0.7%, and the sale price in the 1970s averaged $44.2 million, then what original buy price in 1960 solves P1960*[44.2/(1 – 0.7)10.0]? This estimated buy price should be the discounted present value of profits for such a team. These values are shown in Panel B, column 2. Of course, when one buys an expansion franchise, there is still the player roster, stadium arrangement, and other operating expenses to incur. Especially for marginal territories, the franchise fee should be less than the estimated present value of the eventual team that takes the field. But it is the pattern of the fees that proves interesting, not their absolute level.
As an alternative to the idea that expansion teams are riskier than others, Panel B suggests that the overall 7% growth rate is overblown because the franchise fee in the 1960 expansion is only 30% of the estimate of net present value of profits! An explanation for this “mistake” by the league owners in 1960 could simply be “learning by doing.” After all, this was their first experiment with expansion in the modern period. The 1960s expansion involved only one city of unknown potential (Houston) but the price was only 30% of the reasonable estimate. Subsequently, for the 1968 expansion, the price jumps to equal the reasonable estimate, but this price is too high for an expansion franchise for the reasons just noted—the owner still needs to buy players, a stadium arrangement, and the rest of their operations. And after the 1968 over-charging, the expansion franchise cautiously rises from 40% to 70% of the estimated present value of profits. This is consistent with learning over time.
Panel B also suggests the following for expansion team owners. Since the expansion of 1976, it appears that owners have been zeroing in on the estimated present value of profits for potential expansion owners. And this really doesn’t bode well for potential owners of expansion teams since they must then earn back a discounted present value of profits to cover the expansion fee and their net rate of return. Perhaps the below-average growth rates for the seven of 11 expansion teams in Table 4 is due to this added burden in territories that already were marginal in terms of expected profitability.
Think about this: It appears that the most reasonable conclusion is that owning MLB teams is, with a few notable exceptions, quite profitable and nearly always beats the growth rate in the economy at large. These results, along with the ability of owners to use the RDA or revenue transfers to mask actual operating profits, cast serious doubts on claims of poverty voiced by MLB owners. And expansion franchises appear to be less and less valuable on net, over time, once the original purchase price is imputed into the result.
Finally, what can we learn about ownership values other than operating profits by employing expression? The FW-F valuations are DNPV1, the other values of ownership are ![]() and actual sale prices should be DNPV. So we should be able to find the other values of ownership as:
and actual sale prices should be DNPV. So we should be able to find the other values of ownership as:
![]()
There are 27 transactions from Table 3 that occurred over the period of the FW-F data. Actual sale prices (Pt+), FW-F valuations (DNPV1), and differences are shown…. The difference between average actual sale prices and average FW-F valuations is only $1.3 million, or about 0.63%. If we toss out the three largest FW-F misses (Seattle, Montreal, and Colorado) the average difference is less than $1 million.
But, the variation is broad in the FW-F estimates; the average percentage difference across all of the observations is about –8.5% (–3.9% without the three biggest misses). So the FW-F estimates are less than actual sale prices as hypothesized in Section II with the conclusion that other ownership values average about 8.5% of actual sale prices. At the average of all actual sale prices, the other values of ownership would be 8.5% of $208.4 million, or about $17.7 million.
But by the discussion in Section II and [the equation], the differences should all be negative…. Perhaps heroically, let’s focus only on the 15 transactions where the difference is negative and assume that the estimates in those cases are somehow more accurate than the rest. For those 15 transactions, the average difference is $42.1 million. Since the average actual sale price for these transactions is $218.9 million, then other ownership values would be about 19.2% of the actual average sale value.
CONCLUSIONS
Since believable profit data are not provided by MLB owners, one way to track the value of ownership is through actual team sale prices. If owners maximize economic return and competition is brisk, sale prices should approximate the discounted net present value of ownership. Further, observed growth rates in these prices should indicate the next best alternative growth that team owners can obtain.
Examining these growth rates for MLB franchises, it appears that MLB team ownership, once all values to ownership are included in the analysis, is profitable in the aggregate. At the level of individual transactions, the average rate of growth in sale prices is twice the 3% typical growth rate in the economy at large and the median is 1.6 times larger. The average real growth rate in sale prices aggregated at the franchise level is 4.8% and 4.5% at the median. Again, both values are well in excess of the 3% real growth rate in the economy at large. Further, there is a strong risk and return relationship in these prices suggesting that the market for franchises reward those buying higher risk teams.
Without any formal time series analysis, all that can be said is that the behavior of growth rates aggregated at the decade level has been a roller-coaster ride, dramatically high in MLB’s earliest decades, falling below the 3% comparison rate from the 1950s through 1970s, bouncing back handsomely in the 1980s, and falling off again in the 1990s to essentially zero. While some of these periods are consistent with owner laments of losses, not all periods back up these claims. And there is an even tighter risk-return relationship at the decade averages (statistically speaking, based on the significance of the regression and coefficient estimates).
In addition, owners appear to have learned over time how to price expansion franchises closer to a reasonable estimate of the expected discounted value of future profits. This may help explain why the growth rates in sale prices for the vast majority of expansion teams are so weak. And, omitting the tumultuous decade surrounding World War II, the period of ownership fell dramatically in the 1960s and again in the 1990s. Finally, the portion of the value of ownership that is not associated with annual operations appears to be significant, possibly in the tens of millions of dollars. Even at its generous length, the paper fails to address some obvious and important issues. The results in Tables 3 and 4 cry out for formal modeling and estimation of the price determination process, perhaps along the lines begun by Alexander and Kern (2004). And surely solid time series techniques can inform us about the interesting roller-coaster ride for sale price growth rates in Table 3. The explosion in the 1980s is consistent with the dramatic expansion of cable TV. But why are growth rates so phenomenal early on only to fall into the doldrums from the 1950s through the 1970s? And why did the fall off to essentially zero growth rates in the 1990s occur? Finally, there is the puzzle of the two fairly distinct points in time where the average period of ownership drops substantially. Related to time series issues, perhaps regime changes based on structural alternations occurred; changes in the tax value of owning teams is one possibility worth exploring.
The analysis suffers from the absence of actual profit data. In the absence of those data, we are left with our suspicions and the results that can be determined from available data. And the results here suggest that few owners actually do experience negative cash flows in the first place since 1) team sale prices increase at rates in excess of the growth rate in the economy at large, and 2) riskier prospects do, indeed, receive higher mean returns. Outside of a few very remote theoretical oddities (Quirk & Fort, 1992, pp. 72–77), claims of negative cash flow appear to be an artifact of acceptable accounting practices. The roster depletion allowance and the ability to shift revenues between multiple operations generate paper losses only. And that is what owners report.
My favorite quote about MLB is attributed variously to Hall of Fame Manager Leo Durocher, “Baseball is like church. Many attend. Few understand.” And on the business side of the game, it is no wonder. It is relatively straightforward to list the elements of ownership value. But our ability to untangle values other than operating profit depends on data we rarely get to see. And to date the popular media reports of team sale prices and Financial World/Forbes team valuations are what we have to work with. The analysis should be extended as just suggested and revisited as it is here if additional data ever become available.
References
Alexander, D. L., & Kern, W. (2004). The economic determinants of professional sports franchise values. Journal of Sports Economics, 5, 51–66.
Fort, R. (2003). Sports economics. Upper Saddle River, NJ: Prentice Hall.
Kaplan, D. (2004) Franchise value a multiple-choice question: In analysis of valuation methods, Lehman Bros. finds nearly $1B gap between extremes for Bengals. Street & Smith’s Sports Business Journal, May 17, 2004, p. 3.
Okner, B. A. (1974). Taxation and sports enterprises. In R. G. Noll (ed.), Government and the sports business. Washington, D.C.: The Brookings Institution.
Quirk, J., & Fort, R. D. (1992). Pay dirt: The business of professional team sports. Princeton, NJ: Princeton University Press.
Quirk, J., & Fort, R. D. (1999). Hard ball: The abuse of power in pro team sports. Princeton, NJ: Princeton University Press.
Scully, G. W. (1989). The business of Major League Baseball. Chicago, IL:
University of Chicago Press.
Scully, G. W. (1995). The market structure of sports. Chicago, IL: University of Chicago Press.
Zimbalist, A. (1992). Baseball and billions: A probing look inside the big business of our national pastime. New York, NY: Basic Books.
Zimbalist, A. (1998). Just another fish story. New York Times, October 18.
ALTERNATIVE MODELS
NFL VS. SHERMAN ACT: HOW THE NFL’S BAN ON PUBLIC OWNERSHIP VIOLATES FEDERAL ANTITRUST LAWS
Genevieve F. E. Birren
I. INTRODUCTION
In 1991 William H. Sullivan sued the National Football League (NFL), accusing the NFL of violating federal antitrust laws.1 Sullivan, the owner of the New England Patriots, wanted to sell forty-nine percent of his team to the public in the form of stock.2 The stock sale never happened and Sullivan sold his team.3 Sullivan claimed that the NFL rule against public ownership was an antitrust violation.4
In the NFL Constitution, there are several rules that result in the ban on public ownership of teams. Rule 3.2(a) prohibits nonprofit corporations from owning a team.5 This rule includes a “grandfather clause,” which allows the Green Bay Packers to operate as a public corporation and still be a member of the NFL. At the time the old NFL and the American Football League (AFL) merged, the Patriots, a member of the AFL, were also publicly owned.6 The Patriots were also grandfathered into the newly merged NFL.7 However, in 1976 Sullivan bought all the public shares and became the sole owner of the Patriots.8 This acquisition of all public stock apparently eliminated the Patriots’ right to public ownership under the grandfather clause, at least in Sullivan’s mind. In 1987, when the Patriots were in financial trouble and Sullivan wanted to sell public ownership interests again, he sought NFL approval for the sale.9 The Green Bay Packers, on the other hand, neither needed, nor sought, league approval for any of their four stock sales.10 If Sullivan believed that he had the right to sell public interests without NFL approval, he would have done so without seeking league approval first.
A combination of other rules makes team ownership by a for-profit public entity a “practical impossibility.”11 Rule 3.3(A)(1) requires “the names and addresses of all persons who do or shall own any interest or stock” in an NFL team.12 Rule 3.3(A)(2) requires written financial statements from all persons who will have ownership interests, including stockholders.13 Rule 3.3(C) states that “each proposed owner or holder of any interest in a membership, including stockholders … must be individually approved by the … members of League.”14 Finally, rule 3.515 prohibits certain types of transfers of ownership interests, “effectively precluding any kind of public ownership.”16
….
[Ed. Note: Author’s discussions of the applicability of the antitrust laws, standards of antitrust analysis and relevant markets are omitted.]
V. RULE OF REASON ANALYSIS
A. Economic Aspects of Public Ownership
There is an agreement among most NFL owners that the sale of stock will substantially increase revenue for the teams that do so.105 But this does not mean that the owners are correct.
In Sullivan, various NFL owners testified that publicly owned teams would have access to more money than privately owned teams and that privately owned teams would be unable to compete.106 Theoretically, the publicly owned teams would gain such an economic advantage from their stock sales that private owners would have to sell their ownership interests to the public in order to compete.107
This theory does not appear to be accurate. A 2002 news article reported the Green Bay Packers’ 2001–2002 net annual income at just $3.75 million, placing the Packers 20th in the league.108 The Packers’ net income increased dramatically during the 2002–2003 football season, totaling a franchise record $18.8 million, making the team 10th in the NFL for the 2002–2003 season.109 This increase is largely attributed to the renovations that were made to the Packers’ stadium, Lambeau Field.110 Even with increased stadium revenues, the Packers’ economic viability depends on the NFL’s revenue sharing.111
The Packers would have a potentially continuous, inexhaustible source of revenue if they sold stock all the time. However, this continuous revenue is unlikely. Although the 1997–1998 stock sale sold 120,010 shares, 400,000 were available for sale to the public.112 If there were not sufficient buyers for 400,000 shares, then an unlimited supply of shares would not likely result in unlimited revenue. Although the 1997–1998 stock sale was only for a limited period of time and more time could have resulted in all 400,000 shares being sold, it is unlikely that sales of undefined amounts of stock could continue indefinitely.
Another potential argument against public ownership is that even if all the teams sold public interests, some teams would be at an economic advantage because of the team’s location. Although some teams may be located in larger economic markets at the local level, those teams usually share the market with other professional sports teams, including other NFL teams (i.e., New York City and the San Francisco area). Some individual teams may bring in more money from the cities in which they are located but other teams will generate more national income.
To prevent this type of potential inequity, the NFL has adopted rules against public ownership. The First Circuit concluded that were public ownership available, there would be pressure on the teams to compete for public income and this competition is prevented only by the NFL’s rules.113
Dividends could create another potential economic imbalance. The NFL rules imply a distinction between stocks that pay dividends and ones that do not.114 The outright ban on nonprofit organizations owning teams is essentially an outright ban on dividend-free stock.115 There is no such outright ban on stock that pays dividends, but as discussed in the introduction, other rules make it virtually impossible to set up a for-profit public ownership scheme.
It makes sense that the league’s primary concerns would be about dividend-free stock. This type of stock allows the team to retain all the revenues from stock sales, whereas stock that pays dividends lowers the income value of the stock to the team. A team that pays dividends on public stock will need to take that into account when looking at the price of the stock and overall team revenue. The NFL has never had a publicly owned team that paid dividends, so there is no example to examine.
The Green Bay Packers do not pay dividends to the shareholders of team stock.116 This has not resulted in significantly more revenue for the Packers, and to do so could severely hurt the team financially since the total net income is only a few million a year.117
B. Efficiency of Team Management
In a publicly owned corporation, the ownership and the management are different parties. This can make decision-making difficult if there are a large number of owners that need to agree on a specific course of action.118 Conversely, a privately owned corporation has ownership and management consolidated into one party, expediting decision-making.119
However, the above description of a public corporation’s management is misleading. Publicly owned corporations generally vest their power in a Chief Executive Officer (CEO) or president, a single person who makes the daily business decisions.120 The president carries out the directions of a governing board.121 This is what the Packers have done. The Packers have a board of directors and an executive committee.122 Although the shareholders have voting rights, they do not make decisions regarding the everyday affairs of the team. There is an annual meeting where the stockholders elect the board of directors, and the board of directors elects the executive committee, which includes the president.123 Stockholders also vote on whether to increase stock shares and conduct a sale.124
This arrangement, which is fairly similar to many other publicly owned corporations, is functional and efficient. There is no indication that this form of ownership has inhibited the Green Bay Packers management efficiency; if it had, then it would not have been reasonable for the shareholders to approve the sale of up to one million shares in 1997.125 A business, even a professional football team, would not choose to expand a certain form of management if that form had been inefficient at a smaller size.126
Furthermore, the NFL exercises a great deal of control over the individual teams, preventing the owners from unilaterally making any decisions they want. The league limits what the owners can do with their ownership interest and requires league approval for any ownership sale or transfer.127 Private owners cannot act as though they were autonomous corporations. All of this said, there is no evidence that a publicly held team is any less efficient then a privately owned team.
C. The Role of Relocation
It is in the interest of NFL teams to be able to relocate. If teams can relocate, then cities have an incentive to build new football stadiums and give teams gratuitous leases on publicly owned facilities. If teams cannot relocate, then the teams, and thus the league, lose an important bargaining advantage over cities.
The NFL regulates franchise relocation with rule 4.3.128 Rule 4.3 requires a three-fourths vote of approval by the other teams before any team can relocate.129 The NFL admits that the purpose of the rule is to restrain competition between the teams for franchise location.130 In Raiders, the NFL argued that the rule was necessary for league and franchise stability.131 This rule gives the impression that the NFL does not want teams to be able to relocate. But history indicates that the NFL has not made strong efforts to prevent its franchises from moving.132
There have been twenty-three relocations of NFL teams since 1921.133 Seven of these relocations are merely the team moving to a nearby town or suburb, not changing the city with which the team is associated.134 For example, both the New York Giants and New York Jets have moved to Rutherford, New Jersey,135 but they are still considered to be teams located in New York City. The team changed its name to the new city for the other seventeen relocations but only seven of those have occurred since the NFL/AFL merger in 1966,136 an average of one relocation every five years and three months.137 Even if the NFL tries to maintain the stability of franchise locations, a team’s ability to relocate is also important to the league.
Los Angeles, the second largest city in the country, currently has no NFL franchise. Los Angeles is considered to be the most appealing market for an NFL franchise.138 There is a great deal of speculation that many teams are interested in relocating to Los Angeles …139
Due to the intricacies of public ownerships, it is unlikely that the Green Bay Packers will ever be able to relocate. A majority vote of stockholders is necessary to relocate the team.143 Since ninety percent of the Packers shareholders live in Wisconsin, it is highly unlikely that the needed majority could ever be achieved.144 If all of the teams in the NFL could be prevented from relocating, the teams and the NFL could be bound to less lucrative cities than if they could relocate.
Teams that have the potential to move are in a position of power relative to their current city. Teams have tried the threat of relocation to get the team’s current city to agree to build a new stadium.145 New stadiums and tax breaks offered by cities trying to keep their teams increases the individual team’s revenue, and due to revenue-sharing, the league’s revenue.146
While the SBA gave the NFL the right to merge and become a monopoly, it does not grant the NFL complete antitrust exemption.147 If the revenue increases for NFL teams through NFL rules because prices for tickets, concessions, parking, and merchandise all go up, the league may have abused its position as the only major professional football league in the country and abused the leniency it received under the rule of reason because collusion is necessary for the league to function.
D. Majority vs. Minority Ownership by the Public
The Green Bay Packers are the only NFL team whose majority interest is owned via stock.148 In the Packers case, the entire team is owned by the public in the form of stock.149 This is the type of ownership to which the NFL seems to refer when it cites the difficulty of getting many owners to agree and the potential problems this creates in making management and relocation decisions. As previously discussed, these concerns are invalid.
The NFL’s other main concern with public ownership is the potential financial windfall for a team with public stock.150 A team that is entirely owned in stock could split its shares ad infinitum, if the stock holders approved, as the Packers did in 1997, splitting stock shares 1,000 to 1 and selling 400,000 of the resulting million to the public.151 The Packers shareholders could vote to split the current 4,748,910 shares152 again and again. This has the potential to be an inexhaustible resource, but, as discussed earlier, the demand must exist for the quantity of stock that would become available. Without buyers, the available stock is of no economic value to the team.
Even if the NFL’s concerns about majority public ownership were valid and the courts assumed them to be true, those concerns do not explain the ban against minority public ownership.153 When only a minority public ownership in a team exists, the problem of getting enough owners to agree and make decisions is moot. One person still has control over the team. Even if the public owns 49% of a team, the one individual who owns 51% makes all the decisions. If that one owner wants to hire a certain coach or general manager or relocate the team, even if every stockholder votes no, there is still 51% voting yes. The majority owner still runs the team as though he were the sole owner.
There are teams in the NFL other then the Green Bay Packers that have divided ownership. Two have minority owners that own fairly large interests. Al Davis owns 28% of the Oakland Raiders, with several other parties owning the remaining 72%.154 However, there is no question that Al Davis runs the Raiders….
The percentage division in the Ravens ownership is identical to the division Sullivan wanted to make by selling the Patriots. Sullivan wanted to sell 49% of the team to the public.156 There appears to be no significant difference between having the minority ownership, if 49% is held by one person … or many, potentially thousands of people, as it could have been with the Patriots. In either situation, the team is still run as though it is individually owned.
The fine line drawn between minority ownership by individuals or a small group and minority ownership by the public is too fine. There is no practical business justification for allowing one and not the other. The NFL’s concerns with multiple minority owners should be the same regardless of who those owners are. The dissimilar treatment of private and public holding indicates the NFL’s true goal: restraining a product, NFL team ownership, from a willing market, the public.
VI. CONCLUSION
The NFL policy banning public ownership interests in NFL teams is intended to restrain competition by excluding a particular type of owner: the public owner. The ban, although proclaimed to have pro-competitive effects that justify the policy, does not correct any competitive advantage either method of team management may have had over the other. Relocation is substantially affected by the ban because it preserves teams’ ability to relocate; an ability that might be lost with publicly owned teams. The economic windfalls presumed to accompany public ownership are nonexistent. The fine line drawn between allowing minority ownership by an individual or group of people and allowing minority ownership by a large group of the public has no justification. The NFL was created by a group of individual owners who shared control over a large financial enterprise the public wants: football. To allow the public to become owners potentially takes away from the economic benefits and the prestige of team ownership individual owners currently enjoy. The only purpose the NFL ban on public ownership seems to serve is the preservation of the NFL as a private group, composed of private owners.
Notes
1. See Sullivan v. NFL, 34 F.3d 1091, 1096 (1st Cir. 1994).
2. See id. at 1095.
3. See id. at 1096.
4. See id.
5. See NFL Constitution and Bylaws art. 3.2(a) (2003). This rule also includes a “grandfather clause” for teams already in the league when the rule was created. See id. This exception is how the Green Bay Packers are able to continue to operate as a nonprofit corporation against league rules.
6. See Sullivan, 34 F.3d at 1095.
7. See id.
8. See id.
9. See id. at 1095–96.
10. See Packers Stock and Financial History, available at http://www.packers.com/history/stock_history/. The Green Bay Packers stock sales have been held in 1923, 1935, 1950, and 1997–1998.
11. Lynn Reynolds Hartel, Comment, Community-Based Ownership of a National Football League Franchise: The Answer to Relocation and Taxpayer Financing of NFL Teams, 18 Loy. L.A. Ent. L.J. 589, 604 (1998).
12. NFL Const. art. 3.3(A)(1).
13. See id. art. 3.3(A)(2).
14. Id. art. 3.3(C).
15. See id. art. 3.5.
16. Hartel, supra note 11, at 605. n104.
105. See Sullivan, 34 F.3d at 1099-1103; see also John E. Lopatka & Jill Boylston Herndon, Antitrust and Sports Franchise Ownership Restraints: A Sad Tale of Two Cases, 42 Antitrust Bull. 749, 780–82 (1997).
106. See Sullivan, 34 F.3d at 1100.
107. See Lopatka & Herndon, supra note 105, at 782.
108. Richard Ryman, Packers’ Net Income $3.75 Million, at http://www.packersnews.com/archives/news/pack_4527676.shtml (last visited Sept. 27, 2003).
109. Daniel Kaplan, Pack Earnings Hit a Record $18.8 Million, Street & Smith’s Sports Bus. J., June 16–22, 2003, at 1.
110. See id. at 37.
111. See id.; see also Ryman, supra note 108; Hartel, supra note 11, at 595.
112. See Packers Stock and Financial History, supra note 10.
113. See Sullivan v. NFL, 34 F.3d 1091, 1100 (1st Cir. 1994).
114. See generally NFL Const. art. 3.
115. See id. art. 3.2(a).
116. See Green Bay Packers Stockholders Information, available at http//www.packers.com/stockholders/ (last visited Sept. 27, 2003).
117. See Ryman, supra note 108.
118. See Lopatka & Herndon, supra note 105, at 778–79.
119. See id.
120. See Robert W. Hamilton, The Law of Corporations 323 (5th ed. 2000).
121. See id. at 330–31.
122. See Packers Stock and Financial History, supra note 10; see also Green Bay Packers Stockholder Information, supra note 116.
123. See Packers Stock and Financial History, supra note 10.
124. See id.
125. See id.
126. There is a difference between having efficient management and having a good on-field team. Just like an individual owner and their general manager, a corporate president and general manager can make bad decisions in coaching staff, draft picks, salaries, and trades. These decisions probably account more for the Packers lack of success throughout the 1970s, 1980s and early 1990s than a failure of the actual type of management structure the team used.
127. See NFL Const. art. 3.5.
128. See id. art. 4.3.
129. See id.
130. See L.A. Mem’l Coliseum Comm’n v. NFL, 726 F.2d 1381, 1395 (9th Cir. 1984).
131. See id.
132. See John Wunderli, Squeeze Play: The Game of Owners, Cities, Leagues and Congress, 5 Marq. Sports L.J.. 83, 90, (1994).
133. See Cozzillio & Levinstein, supra note 20, at 557–58.
134. See id.
135. See id.
136. See id.
137. The current NFL has existed for thirty-seven years. There have been nine franchise relocations with name changes in that time, averaging a relocation every 5.28 years.
138. See G. Scott Thomas, The 10 Most Appealing Markets in America for New Sports Teams, Sports Bus. J., Jan. 6–12, 2003, at 26.
139. See Sam Farmer, Group Extends Hand to Chargers; Pro Football: Posturing Begins as Anschutz Representatives Query Team About Relocation to L.A., L.A. Times, May 30, 2002, at Sports, part 4, page 9. The San Diego Chargers, Minnesota Vikings, Buffalo Bills, New Orleans Saints, and Indianapolis Colts are all teams that have been mentioned to have an interest in relocating to Los Angeles, and the Oakland Raiders are involved in lawsuits to allow the team to return to Los Angeles. See id.
140. See Jay Weiner, Easier Said Than Done: Relocating an NFL Franchise Takes Some Shifty Maneuvering, Star Trib. (Minneapolis), Sept. 1, 1999, at C1; Jeff Duncan, Saints Seek Stadium Solution, Times-Picayune (New Orleans), Nov. 17, 2000, at National, page 1.
141. See Weiner, supra note 140.
142. See Duncan, supra note 140.
143. See Hartel, supra note 11, at 594.
144. See id.
145. See Vikings and Gophers Continue Work on Stadium, at http://www.Vikings.com/News/StadiumUpdate723.htm (last visited July 22, 2002); Weiner, supra note 140.
146. See Kevin M. Bahr, The Business of Sports and Small Market Viability: The Green Bay Packers and the Milwaukee Brewers, at http://www.uwsp.edu/business/CWERB/1stQtr01/SpecialReportQtrl_01.htm (last visited Sept. 27, 2003).
147. See 15 U.S.C. 1291, 1294 (2000).
148. See Packers Stock and Financial History, supra note 10.
149. See id.
150. See Sullivan v. NFL, 34 F.3d 1091, 1100 (1st Cir. 1994).
151. Packers Stock and Financial History, supra note 10.
152. Id.
153. See Sullivan, 34 F.3d at 1091. The whole premise of this case is that Sullivan wanted to sell a minority interest in the Patriots to the public and the NFL indicated that it would prevent such a sale.
154. NFL Franchise Directory, at http://www.sportsfansofamerica.com/Directory/Football/NFL1.htm (last visited Sept. 27, 2003).
155. Id.
156. See Sullivan, 34 F.3d at 1094.
A PIECE OF THE ROCK (OR THE ROCKETS): THE VIABILITY OF WIDESPREAD PUBLIC OFFERINGS OF PROFESSIONAL SPORTS FRANCHISES
Ryan Schaffer
INTRODUCTION
In each professional sport, the gap between the “haves” and the “have-nots” has increased exponentially over the past fifteen years…. The increasing gap has led to a competitive imbalance in professional sports in which only a handful of teams have a true opportunity to win a championship at the outset of a season.
Some of the difference in payroll can be attributed to the varying degree of deep pockets and willingness to dig into those deep pockets among the owners. However, the single greatest factor accounting for the differing ability of teams to spend money remains locally generated revenues. In baseball, 80 percent of a team’s revenue is generated locally from ticket sales and local broadcast fees, with the remaining 20 percent coming from national television contracts and licensing fees.7 The reason that the New York Yankees can spend $208 million on player salaries is because they sell out every game and the money generated from local television broadcast fees is much greater than that of other teams.8
With such a disparity, professional team owners should first explore every avenue in attempting to max out their locally generated revenues in order to compete effectively. However, the Milwaukee television market is not likely to grow anytime soon, and the Kansas City Royals are not going to sell more tickets until they get a better team on the field. Owners must be creative then in their search for other sources of capital to make up for the disparity in locally generated revenue. One strategy to be explored is the widespread public ownership of professional sports franchises. By conducting an initial public offering (IPO) of some percentage of a franchise, a professional team owner could tap into an important source of capital without ceding any control of the organization, thereby shrinking the competitive gap.
In this Note, I explore the possibility of conducting an IPO of a professional sports franchise. Part I examines the various types of public ownership possibilities and distinguishes a true “stock market team” from other forms of ownership involving either indirect public ownership or complete community ownership. Part II addresses the question of whether a widespread public offering is a viable option under the current rules of each of the major professional leagues. Part III then considers the idea from the point of view of the team owner and the fan-investor in order to understand whether this would be an attractive option for either or both of these groups. Finally, Part IV examines the unique motives that drive a professional sports franchise in the context of considering what fiduciary duties would be owed to shareholders after a sale of stock.
I. STRUCTURING PUBLIC OWNERSHIP
Various types of public ownership structures have been utilized by professional sports franchises in the past. In order to differentiate the type of widespread public ownership contemplated by this Note from other forms of public ownership, an examination of the various forms is in order.
A. Stock Market Teams
A stock market team constitutes the primary source of revenue and profits for the corporation that owns it.9 Marketable securities are sold to the public and then traded on an exchange. Professional teams in the United States that have embraced this form of ownership include the Boston Celtics (NBA), Cleveland Indians (MLB), and Florida Panthers (NHL).
In 1998, the Cleveland Indians became the first professional baseball team to go public, when the Cleveland Indians Baseball Company raised $60 million by selling four million shares of stock at an initial offering price of fifteen dollars per share.10 The shares were listed for trading on NASDAQ, and consequently fell under the rules and regulations of the National Association of Securities Dealers. The Indians were sold to a private investor in 2000 for $320 million.11 The transaction was structured as a cash-out merger, which meant that all of the shareholders were required to tender their shares back to the company for cash consideration of $22.61 per share.12
Florida Panthers Holdings Inc., the parent holding company of the NHL’s Florida Panthers, carried out an initial public offering on the NASDAQ exchange in November of 1996 at $10 a share under the ticker symbol “PUCK.”13 The IPO netted approximately $66 million, which was primarily used to pay down debt or retained for working capital. Arguably, the Panthers fell outside the definition of a “stock market team” soon after their IPO. Before long, Panthers Holdings began buying hotels and resorts and the company’s name was changed to Boca Resorts, Inc. to better reflect its focus on hotels, as opposed to hockey.14 The sale of the Panthers became official in 2001, and put the team back in private hands.15
The Boston Celtics were the last major independently-owned public sports franchise.16 Between 1986 and 2002, the Celtics were owned by a limited partnership, Boston Celtics LP, which was traded on the New York Stock Exchange (NYSE). In 2002, the Celtics were sold to a group of private investors, leaving the current United States landscape void of any true stock market teams.
B. General Corporate Ownership
A number of professional sports franchises are or have been owned by large publicly-traded corporations. The difference between these teams and pure “stock market teams” lies in the fact that for the “general corporate ownership” teams, the sports franchise makes only a minor contribution to the parent company’s financial performance.17
Public corporations (often from the media, entertainment and communications industries) purchased sports franchises throughout the late twentieth century.18 The Tribune Company bought MLB’s Chicago Cubs in 1981 [Ed. Note: and sold the team in 2009] and Rupert Murdoch’s News Corp purchased the Los Angeles Dodgers in 1998 [Ed. Note: and sold the team in 2004].19 Some media companies engaged in cross-ownership, seeking to leverage their production capability to the fullest extent. Comcast Corporation currently owns the NBA’s Philadelphia 76ers and the NHL’s Philadelphia Flyers, while Cablevision Systems owns the NBA’s New York Knicks and the NHL’s New York Rangers. AOL Time Warner bought [Ed. Note: and then sold] the NHL’s Atlanta Thrashers, the NBA’s Atlanta Hawks, and MLB’s Atlanta Braves, while Walt Disney owned MLB’s Anaheim Angels and the NHL’s Anaheim Mighty Ducks. In Canada, publicly traded Rogers Communications purchased 80% of the Toronto Blue Jays from Labatt Brewing Company, Ltd in 2000.20
Though they are publicly traded, these organizations differ tremendously from stock market teams. Because stock market teams are the primary source of revenue and profits for the corporation that owns them, the team’s financial results will largely determine how the company’s stock performs.21 Investor interest in a pure stock market team will be dictated solely by the interest in investing in the team itself. Sports franchises owned by large media companies constitute an entirely different proposition for investors. While the decision to buy a share of Cleveland Indians Baseball Company stock may come from your love of the team, “buying Disney when one is thinking about the [Anaheim] Angels is a bit of a stretch.”22 For professional sports franchises with general corporate ownership, both financial performance and performance on the field will barely register when it comes to the financial results of the parent company.
C. Community Based Ownership
A third form of public ownership exists in community ownership, where non-marketable securities are sold and the public owns a majority of the stock. In the case of community ownership, the team is set up as a publicly-owned non-profit corporation.23
The Green Bay Packers initiated the phenomenon of stock sales by a professional sports franchise in 1923. Four additional sales of stock (in 1935, 1950, and twice in 1997) have left the Packers with almost 112,000 shareholders, holding a total of 4.75 million shares of stock.24 As a means of running the corporation, a board of directors is elected by the stockholders. The board of directors in turn elects a seven-member executive committee of the corporation, consisting of a president, vice president, treasurer, secretary and three members-at-large. The president is the only officer who receives compensation. The balance of the committee is sitting gratis.25
Purchasers of the Packers’ stock received a stock certificate and were drawn in by the team’s promise that “purchasers of Common Stock will… become a part of the Packers’ tradition and legacy.”26 However, shares of ownership in the Packers include significant limitations. Shareholders receive no dividends and no season ticket privileges of any kind attach to ownership of the stock.27 The shares are not marketable, as they may only be transferred to members of the stockholders’ immediate family by gift or following death.28 Further, the articles of incorporation prohibit any individual from owning more than 200,000 shares of stock, in order to prevent someone from taking control of the team.29
While the Packers are currently the only major-league team in the United States to utilize the community ownership structure, a number of other organizations have shown interest in using this structure to protect against the problems of contraction and franchise relocation.30 One of the most significant features of the Packers’ bylaws is that a majority vote of the shareholders is necessary to relocate the franchise.31 With over 90% of the shareholders residing in Wisconsin, all of whom are probably avid Packers fans, it is extremely unlikely that any shareholder would ever vote to relocate the team.32 Within the past decade there have been several attempts on both the state and federal level to introduce legislation promoting the expansion and growth of community ownership in professional sports.33 … a bill was introduced in the Minnesota House of Representatives proposing a process by which MLB’s Minnesota Twins would become a community owned organization.34 The bill provides in part that at least 50% of the common stock must be sold to the general public in a general solicitation, with no individual owning more than 1% of the outstanding common stock.35 Further, the bill states that “the governing documents must provide that the franchise may not move outside of the state or agree to voluntary contraction without approval of 75% of the shares of common stock, and seventy-five percent of the shares of preferred stock. The 75% requirements may not be amended by shareholders or by other means.”36 Community ownership represents not only an opportunity for fans to feel more connected to their local team, but also an opportunity to protect that community from having its team whisked away on the whim of a greedy owner in search of a new and better stadium deal.
II. COULD THEY?
Before examining whether owners of professional sports franchises should consider conducting an initial public offering of some portion of their franchise, it is important to determine whether this is even a viable option given the current state of rules and regulations in each of the major professional sports leagues.
Each of the professional sports leagues has policies regarding the transfer of ownership of teams. Owners have typically been discouraged from selling a stake in their team to the public.37 While some of these policies are codified in league by-laws and constitutions, others come from “unwritten rules” which the league expects owners to follow.38 Despite this seemingly high hurdle, selling shares to the public may be a viable option as a number of leagues have shown a willingness to endorse limited public ownership, while the league with the strongest policy against public ownership [the NFL] may stand on tenuous legal ground.39
Major League Baseball owners voted in 1997 to change an existing guideline discouraging public ownership and to authorize teams to register with the U.S. Securities and Exchange Commission to sell equity.40 However, the new guideline states that no more than 49% of a team can be distributed by way of a public offering, and voting rights of publicly-held shares must be restricted.41 The intended effect of the guideline is to allow some percentage of ownership to be sold to the general public, while guaranteeing that a controlling voting bloc of shares remains in private hands. The Cleveland Indians became the first (and to this point, only) team to take advantage of this new guideline with their public offering in 1998.42
Similarly, while the NHL must review owners’ proposals to offer shares to the public, the league has generally proved willing to endorse such plans if the proposal complies with a by-law requiring that one shareholder have ultimate voting control.43 In the case of both the NHL and the MLB guidelines, the owners appear concerned only that there is a singular voice able to speak for the organization and vote on matters of league importance. While the owners are concerned with voting rights, they appear less concerned that all the economic rights of ownership should inure to one (or only a few) parties.44
The NFL is the professional league with the strongest anti-public ownership stance. The NFL Constitution prohibits corporate ownership of franchises, and 75% of NFL owners must approve all transfers of ownership interests in NFL clubs.45 Furthermore, there is an uncodified league policy that prohibits public offerings of shares in NFL clubs.46 NFL owners have not shown the same willingness to bend this guideline as their fellow owners in the other major professional sports leagues.
Despite this seemingly insurmountable hurdle, there is some question as to whether the NFL policies concerning public ownership would withstand a challenge under the Sherman Anti-Trust Act. In the late 1980’s, the owner of the New England Patriots, William Sullivan, sought approval by NFL owners for a sale of 49% of the team in a public offering. After Sullivan saw the Boston Celtics complete a public offering in December 1986, he sought to use the same instrument to raise capital in order to alleviate some of his financial problems, while still retaining control of the Patriots.47 Sullivan asked his fellow owners for a modification or waiver of Article 3.5 of the NFL Constitution,48 but was told by the Commissioner that league approval was “very dubious.”49 After being rebuffed, Sullivan was forced to sell the team in 1988.50 Subsequently, Sullivan sued the NFL, claiming among other things that the NFL had violated the Sherman Act by preventing him from selling 49% of the Patriots to the public in an equity offering.51 Sullivan alleged that this policy constituted an illegal restraint on trade in the market for ownership of a National Football League franchise in general, and in the New England Patriots, in particular.52 The jury agreed, and rendered a verdict for Sullivan in the amount of $38 million.53
On appeal, the verdict was eventually reversed and remanded due to procedural errors that occurred during the trial. However, in addressing the antitrust argument that the NFL’s prohibition on public ownership constitutes an illegal restraint on trade, the circuit court left the door open to further challenges. “We accept the NFL’s claim that its public ownership policy contributes to the ability of the NFL to function as an effective sports league…. We disagree, however, that these factors are sufficient to establish as a matter of law that the NFL’s ownership policy does not unreasonably restrain trade in violation of Section 1 of the Sherman Act.”54 From this opinion, it seems at least plausible that a team owner could conduct a successful challenge to the NFL’s public ownership policy in an attempt to conduct an equity offering.
The relaxations of ownership rules in Major League Baseball and the National Hockey League may illustrate a trend towards a greater embrace of public ownership. Furthermore, despite its steadfast policy against public ownership, the NFL’s policy may be open to legal challenge. Though an owner contemplating such a move would undoubtedly receive some resistance from other owners in his league, it appears that a motivated owner would not be legally prohibited from completing a public offering of a limited share of his organization.
III. SHOULD THEY?
In this Part, I consider first whether the widespread public offering of shares is a good idea for owners of professional sports franchises, addressing the pros and cons of such a strategy. I proceed to conduct the same analysis from the point of view of the fans, who will play a vital role in such an offering as the purchasers of the stock. Should a widespread public offering of an ownership interest in their favorite sports franchise be something that the fans want and are willing to pay for? The question of “should they” is taken entirely apart from the question of “could they,” which was addressed above in Part II.
A. Advantages for Current Owners
Often, a corporation will arrange to sell stock to the public in order to fund business activities that cannot be readily financed through other means (e.g., from profits generated by the corporation, from the pockets of the owner of the corporation, or from borrowed funds).55 As with any other corporation, professional franchise owners may consider selling stock for the very same reasons.
i. Construction Activity
Over the past twenty years, professional sports stadiums have become palaces of overindulgence. Rather than serving the utilitarian purpose of providing a venue for the playing and viewing of a professional sports match, these stadiums have become full service family entertainment facilities, providing greater amenities and aesthetically pleasing architecture to fans and players alike. Not surprisingly, the cost of building these facilities has skyrocketed. U.S. Cellular Field, home of MLB’s Chicago White Sox, was built in 1991 for an estimated cost of $167 million.56 Less than thirteen years later, Citizens Bank Ballpark was built in Philadelphia for more than double that price.57 The explosion in cost has not been limited to baseball, as the cost of constructing stadiums for the other major professional sports has increased exponentially during the same time frame.58
Whatever the sport, the cost of upgrading a current facility or building a new one has become prohibitive. A number of British soccer teams have carried out IPOs with the express purpose of generating funds required to improve their existing stadiums or to build new facilities.59 Might owners of a professional sports franchise in the U.S. consider navigating a similar path, conducting an IPO with the explicit purpose of using the funds on construction or maintenance of their facility?
At first glance, it seems as if team owners in the United States are not faced with the same capital needs as the owners of British soccer clubs. Most British soccer teams own their own stadiums and correspondingly pay for construction as well as any upgrades to the facilities.60 By contrast, the majority of professional teams in the United States do not own their own stadiums. Instead, they typically play in venues that have been partially or completely funded by the public. During the twentieth century, approximately $20 billion was spent on such facilities and nearly $15 billion of this came directly from local government subsidies.61 Owners are able to coax these stadiums out of cities through threats of relocation. Owners are generally willing (and able) to pick up and move their franchises to a city that will offer them the most advantageous financial and stadium package, regardless of the degree of local support and fan loyalty they leave behind.62 If owners are generally able to get their stadiums publicly financed with minimal commitment of their own funds, then an IPO in order to raise such funds would be unnecessary.
However, there is some evidence that this gravy train may be slowing down. The prospect of local governments subsidizing the commercial pursuits of wealthy team owners is fostering resistance.63 There is widespread voter antipathy to new taxes implemented to raise money for the building of sports facilities, and in the recent past, voters have defeated such funding initiatives in a number of American cities.64 Perhaps the best evidence that there is some movement away from public financing: Gillette Stadium, home of the NFL’s New England Patriots, was completed in 2002 for an estimated cost of $325 million.65 One hundred percent of the cost of the facility was financed with private funds.66
The lone example of the Patriots does not prove that public funding of stadiums is coming to an end. Indeed, public funding constituted 86% of the financing of the recently constructed Great American Ballpark in Cincinnati.67 However, the Patriots and a few other recent examples do perhaps signal a shifting of the tide.68 Team owners need to seriously consider the possibility that they will have to build their own facilities, or at least pay some of the cost as part of a public/private partnership agreement.69 Raising capital through the sale of equity in a portion of the team may be one strategy an owner faced with this new reality might choose.
ii. Financing Other Team Activities
In addition to financing stadium construction and maintenance, funds from the sale of stock in a professional sports franchise can be used for other team purposes in order to increase the competitive advantage of some teams and keep others from falling behind.
British soccer teams utilize the stock market to raise funds for reasons other than stadium construction, such as financing the purchase of players in order to “buy success” and strengthen their teams.70 The explicit buying of players does not typically occur in the United States because of tight restrictions enacted by the leagues on the sale of players for cash.71 However, the need for cash on hand to pay players still exists for professional teams in the U.S. Teams typically stock their rosters through the draft, trades, and increasingly, through free agency. In the NFL, contracts are typically structured so that a substantial signing bonus is paid up front to players in order to entice them to sign a contract.72
The amount of cash available to pay to a free agent in the form of a signing bonus may be the difference between landing a free agent and watching him sign a contract with another team. Though the NFL has a “salary cap,” the cap is really for accounting purposes only.73 The amount of money spent on payroll (the amount of cash actually paid out in a year from a team to its players) can vary dramatically. During the 2004 season, the Washington Redskins had a total payroll of almost $118 million, while the San Francisco 49ers registered a total payroll of $63 million.74 The reason that the Redskins are able to spend more money on payroll than the 49ers is a direct result of disparity in revenue.75 Simply put, the Redskins have more cash on hand to pay players than the 49ers do. This disparity may come from a number of sources (owner wealth and willingness to spend, team marketing revenue, stadium deals, etc.) but the result may be a long term decrease in competitive balance throughout the league.
A sale of stock to the public may be one strategy through which owners of teams falling behind in revenue have the opportunity to stay competitive in the market for free agents. The Green Bay Packers, though not a stock market team per se, have conducted four stock offerings to the public, with the most recent one taking place in 1997.76 During the 1997 offering, the Packers sold roughly 120,000 shares of stock and took in over $24 million.77 The $24 million influx doubled the team’s financial reserves and virtually assured that the team would remain afloat for the next twenty-five years.78 A similar influx of cash could help lower-revenue teams like the 49ers level the playing field by allowing them to go after free agents more aggressively, thus maintaining the competitive balance that the NFL itself has deemed crucial to the league’s success.79
iii. Making Investment Liquid
Shareholders of any privately-held corporation usually cannot sell their equity readily because of the high transaction costs often involved with finding a suitable purchaser and negotiating satisfactory terms without a market price for shares.80 By going public owners can more easily liquidate at least part of their investment.81
In professional team sports, the same idea would hold true. For owners of professional sports franchises, much of the worth of their investment lies in the overall franchise value, as franchises in most professional sports do not generate significant earnings from operations each year. MLB commissioner Bud Selig testified to Congress that the league’s thirty teams suffered cumulative operating losses of more than $1.4 billion from 1995 through 2001, with only the New York Yankees and the Cleveland Indians making money over that time.82 It is true that wealthy individuals are often motivated to own a professional sports franchise for reasons other than pure investment, such as ego, sense of civic duty, or love of the game.83 Nevertheless, owners may soon be unwilling to blindly subsidize these losses from their own pocket. As the then-head of the sports finance group at Lehman Brothers explained:
A lot of the owners are not as wealthy, not as liquid as they were five years ago. In the past, a lot of owners have been willing to subsidize their teams, but as annual losses rise to $10 million, $20 million, or more, some owners are being stretched to the breaking point.84
Going public may provide owners with additional capital to offset these losses from operations, and give the owners the opportunity to liquidate part of their investment without giving up control of the franchise. The prospect of creating an exit option has helped to foster the public ownership trend in British soccer.85 Owners of British soccer clubs have on numerous occasions relied on the liquidity provided by a move to the stock market in order to cash in a portion of their investment.86
Structured appropriately, franchise owners could receive the influx of capital from a public offering without giving up anything in the way of control over the operations of the team or facing the risk of a hostile takeover. In a sense, a widespread public offering of some portion of a professional sports franchise contains the prospect of “free money” or “early money” for the owner. The public offering of the Cleveland Indians in 1998 provides a constructive example.
In 1998, the Cleveland Indians Baseball Co raised $60 million by selling four million shares at an initial public offering price of $15 per share.87 The company’s shares were then listed for trading on NASDAQ, the “over the counter” stock market operated under the supervision of the National Association of Securities Dealers.88
Each of the four million Class A Common Shares offered for sale to the public were entitled to a single vote concerning company operations.89 Following the offering, Dick Jacobs, the owner of the team, retained beneficial ownership of 2,281,667 Class B Common Shares, each share being entitled to 10,000 votes.90 Consequently, Mr. Jacobs retained 99.88% of the Company’s total voting control. Because he suffered minimal dilution in voting rights over the company, Mr. Jacobs did not expose himself to the risk of a hostile takeover present in most public offerings. Major League Baseball ownership guidelines require that an individual or group of no more than twenty individuals maintain at least a 10% economic interest in the company and a ninety percent voting interest in the company at all times.91 By structuring the offering in this way, Mr. Jacobs complied with MLB guidelines, retained almost complete voting control over the organization, and was able to raise $60 million without the promise of anything in return.92 In this way, Mr. Jacobs was able to realize a portion of the value of his investment without selling his franchise.93
Because Mr. Jacobs sold his ownership of the Indians within a few years of the public offering, the capital he received was better characterized as “early money” rather than “free money.” Without the public offering, the $60 million that Mr. Jacobs received would have been realized by him upon the sale of the team two years later. But with this strategy, Mr. Jacobs was able to get access to the money earlier while giving up no control over his organization. Other owners may view this strategy as a unique source of capital having little downside risk, and attempt to follow suit. For those looking to sell in the short term, the public offering process can offer a chance at “early money,” but for those with no plans to sell (but rather to keep ownership in their family) the public offering process truly represents the prospect of “free money.”
iv. Capturing Market Ownership
Offering a portion of the local professional sports franchise for sale to the members of the community may give rise to an ancillary benefit of increasing the number of loyal fans. Admittedly, there is a bit of chicken-and-egg argument here, as it is arguably only the very committed fans who would buy stock in the team in the first place.94 However, these committed fans may also purchase and give stock as a gift, or pass the stock on to their children, which would allow the network of committed fans to grow.
Despite the fact that little economic value is derived from such acts, owners of stock in all kinds of companies often purchase products from that company as a matter of habit. The owner of fifty shares of Procter & Gamble stock may make sure that Tide (a P&G product) is his detergent of choice. The owners of fifty shares of Home Depot may drive an extra few miles to get to a Home Depot store rather than “supporting” Lowe’s, Home Depot’s strategic competitor. Similarly, ownership of stock in a professional sports franchise may serve to create or deepen the same kind of brand loyalty to the franchise among the fan-investors. This brand loyalty may manifest itself through increased purchase of team merchandise, increased visits to the team website, or a higher season ticket base, all of which serve to increase team revenue.
Admittedly, these effects are uncertain and likely small. Any deepening of brand loyalty would not, by itself, constitute enough of a reason for an owner to conduct a public offering. However, taken on top of the other benefits associated with a public offering, increased brand loyalty may become part of a compelling case for an owner to seriously consider such a strategy.
B. Disadvantages for Current Owners
Despite the many advantages and opportunities offered by a sale of stock to the public, current owners of professional sports franchises would face a number of risks and obligations that may prompt them to seek alternatives to a public offering as a source of additional capital.
i. League Opposition
As noted in Part II, owners seeking to “go public” may face significant objections and hurdles from their leagues and other owners. Some leagues have more stringent policies against public ownership than others. While the NHL reviews the proposals of owners to offer shares to the public, the league has generally proved willing to endorse such plans if the proposal complies with a by-law requiring that one shareholder have ultimate voting control.95 Major League Baseball owners, as discussed in Part II, voted in 1997 to change an existing guideline discouraging public ownership. Under the new regime, up to 49% of a team can be distributed by way of a public offering though voting rights of publicly held shares must be restricted.96 This rule change paved the way for the 1998 public offering of the Cleveland Indians.
The NFL, with its uncodified policy against public share offerings, stands out as being more firmly opposed to public ownership of teams than other leagues.97 As discussed in Part II, there is considerable doubt about the legality of this rule. An owner who wishes to contest this rule on antitrust grounds may very well bring a successful challenge. However, there are costs associated with bringing such a challenge. An owner would certainly have to figure such costs into his calculus of whether he wanted to proceed down this path.
Aside from the legal costs of the challenge, an owner would have to decide whether he wanted to sue the league of which he is part and the other NFL owners who are his colleagues. A sitting owner taking the NFL to court is not unprecedented. Jerry Jones, the owner of the Dallas Cowboys, sued the NFL in 1995 over the signing of separate sponsorship deals for the Cowboys, and Al Davis has sued the NFL on a number of occasions. In 1980, Davis sued the NFL after the league attempted to block the move of his Raiders from Oakland to Los Angeles.98 In each of those instances, the owners decided that the risk of suing the league and alienating both the commissioner and the other team owners was worth the potential reward and proceeded forward. An owner considering a challenge to the NFL’s ban on public ownership would have to make a similar decision, taking into account the strong stance that the league has taken against such a move.
ii. Costs
Despite the possibility that conducting a public offering nets “free money” to the principal owner selling off a share of his equity, there are costs in both time and money associated with conducting a public offering that can significantly cut into the profits generated.
Generally, the expenses of an IPO will amount to 15% or more of the proceeds.99 For the IPO of the Cleveland Indians, though not quite that high, the expenses amounted to $6 million, out of $60 million raised.100 Most of those expenses go to investment bankers who agree to serve as underwriters for the transaction. The underwriters are responsible for the pricing, marketing and selling of the company’s shares and generate a sizable fee for their work.101 Attorneys also play a pivotal role during the process of going public, drafting filings made to the Securities and Exchange Commission and answering the inquiries of the regulators in order to move the process along. Accountants will also be needed to prepare and certify the financial documents that will become part of the company’s filing and prospectus. Legal and accounting fees will contribute significantly to the cost of the IPO.
Apart from the monetary cost of conducting a public offering, there will be a significant cost in terms of the time commitment required of key personnel. During the process of going public, senior executives will need to discuss relevant issues with lawyers, accountants and financial advisers at length. Additionally, the management team usually takes part in meetings, known as “road shows” which are designed to sell the investment community on the company.102 Dealing with these issues takes key personnel away from the day-to-day operations of running the franchise, which may cause them a short-term competitive disadvantage. Typically, the process of going public is not a short one. Before a corporation can carry out a public offering, it must prepare and file the necessary documentation and then wait for approval from the SEC. This delay is rarely less than three months and can exceed six months or more.103 The time cost for management personnel can be just as significant as the monetary cost during the public offering process.
The costs of being a public company do not end once the IPO is complete. The Securities Exchange Act of 1934 governs the regulation of secondary markets. Section 13 of the Exchange Act imposes periodic reporting requirements on publicly traded companies.104 These reporting requirements are normally satisfied in the form of 10-K (annual) and 10-Q (quarterly) reports. The services of lawyers and accountants will again be needed for each of these reports, and they will charge accordingly. Further costs will be borne in setting up annual shareholder meetings, distributing materials to shareholders, soliciting shareholder proxies for voting, and maintaining a registry of shareholders. Management will need an investor relations department in order to deal with shareholders and financial analysts who cover the company’s stock. The costs and headaches of keeping up with SEC disclosure requirements can be significant if management is not prepared. For example, when the Boston Celtics went public, the result was “an expensive administrative nightmare” due to the fact that 90% of shareholders owned ten shares or less, greatly increasing the paperwork involved.105
Franchises considering a public offering may be deterred by the high administrative cost and hassle experienced by the Celtics, or they may learn from the Celtics’ mistakes. In 1997, the Sacramento Kings of the NBA admitted that the team had given serious consideration to a public share offering, but that the idea had been shelved because of the high administrative cost it would have entailed.106 The Kings’ president specifically cited the problem of dealing with so many small stockholders. “The problem is you have 40,000 people each owning one share as souvenirs. The cost associated with that would be incredible.”107 The Florida Panthers, undeterred by the Celtics’ experience, pressed on with a public offering but sought to reduce administrative costs through such measures as a minimum purchase requirement.108
The costs of conducting an IPO and remaining a public franchise may be significant and could be the strongest argument against conducting such an offering in the minds of professional sports team owners. At the end of the day, owners must determine if the capital and other benefits gained outweigh the costs in dollars and human capital that they will incur as part of the process.
iii. Disclosure
The disclosure requirements discussed above may deter an owner of a professional sports team from going public for reasons wholly apart from the costs associated with such disclosure. The prospect of disclosing a wide range of previously confidential information can deter business owners of all kinds from selling shares on the market.109 Public corporations must provide detailed information on numerous components of their business, including their sales and profits, the compensation of top executives, and the activities of certain key shareholders.110
It is understandable that in an age of sports talk radio, internet chat rooms and 24/7 coverage of local sports teams, some franchise owners may be hesitant about making any more information than is necessary available to the public. Making this information publicly available may also harm the franchise at the negotiating table. Disclosure would allow the inspection of team finances by the media, government officials, or players seeking background information for contract negotiations. Owners are generally reluctant to issue stock because they do not want to share financial information about their clubs.111 It would be more difficult for a team owner to cry poverty as a negotiating ploy with a player if the player’s agent could easily find team revenue and operating income information simply by logging on to the SEC website and downloading the company’s latest 10-K. Negotiations with a city on sweetheart stadium deals, a key component in the current sports landscape, would likewise be more contentious if the public was able to see exactly where the team stood financially.
The costs in privacy of conducting an IPO are not to be overlooked. The external scrutiny faced by the franchise would likely increase, as critics would simply have more information with which to work. Some privately-held British soccer teams chose to forgo the stock market and not go public due to their disinterest in dealing with such heavy scrutiny.112 For instance, in 1995 the chairman of the Glasgow Rangers, a very successful Scottish soccer club, refuted speculation that a stock market flotation was imminent by saying “I want to own and run Rangers.”113 The same may hold true for owners of sports franchises in the United States. These privacy costs may be just as significant a deterrent to owners considering an IPO as the actual monetary costs associated with such an offering.
C. The Fans
When a public share offering is likely to fail because of lack of investor interest, any organization in any industry will typically abandon its plans before shares are actually offered to the public. Thus, though the owner is the one ultimately making the decision on whether to offer shares in his franchise to the public, it is important to note the advantages and disadvantages of such a move for fans, in order to accurately gauge whether there would be a market for the shares. Can sports stocks inspire investor confidence?
Some of the most important benefits for a fan-investor are psychic rather than tangible. It is the feeling of ownership of a treasured civic asset, of being part of the history and tradition of the team that they love. As one Boston Celtics fan and stockholder put it, “the stock is about being part of the rock and owning part of your team.”114 Often, there is additional psychic pleasure in being able to pass on that membership to family members and friends. The same fan passed up the t-shirt and game ball when buying his fifteen-year-old son a birthday gift, instead buying him fifteen shares of the Boston Celtics, stating: “I hope he’ll never sell it because it’s sentimental.”115
The right to attend annual meetings is an important tangible benefit to shareholders. At the first annual meeting of shareholders for the Cleveland Indians, around one thousand shareholders showed up at Jacobs Field, the team’s home stadium.116 Not only was each shareholder provided with a proxy statement and an annual report, but they were given a ticket with an actual assigned seat at the ballpark which they needed to gain entry to the shareholder meeting. The Green Bay Packers 2005 annual meeting attracted a crowd of 9,700 and a special, shareholders-only practice held the day before attracted over 14,000 people.117
The argument most commonly invoked against conducting a public offering of shares of a professional sports franchise is that the shares constitute a bad investment.118 Purchasers of these shares are likely to receive little in the way of financial return from their investments. During their initial offering, both the Cleveland Indians and the Florida Panthers made it very clear to potential investors that they did not intend to pay any dividends at all for the foreseeable future.119 Although the Boston Celtics did start out paying dividends to their investors, they offered no dividends after 1998 before they were acquired by private investors in 2002.120 Purchasers of these stocks are also likely to face restrictive voting rights. Though they are owners of the team, they have little or no voice as to how the team and the company are run.
Some have commented that the only real opportunity for a professional sports stock to become more valuable is during the consideration and completion of a sale of the organization.121 This has in fact been the case for some of the previously publicly traded franchises. The Cleveland Indians stock was languishing for a year after its public offering, losing over 60% of its value,122 but the stock rallied on the announcement by team owner Dick Jacobs that he was seeking a buyer. In a single day, the stock price rose 64%, trading ninety times average daily volume.123 After the sale was completed, investors in the Indians ended up making a return on their original $15 per share investment. Based on the evidence, however, the sale of the team was the one and only cause of this return. Generally, the sale of a team is an uncommon occurrence…. Investors purchasing sports stocks with a view towards the sale of the team may have to wait for a long time to realize any investment gains.125
Conventional investors in search of undervalued companies with growth potential or companies with the ability to expand their operations are unlikely to be satisfied with an investment in a professional sports franchise.126 Though the capital influx may result in the production of some competitive advantage, the onus of the transaction is raising capital to make up for a shortfall in revenue, a situation that traditional investors avoid. As the critics note, under all of the traditional tests of what makes a good investment, sports stocks are likely to fail.
What these critics fail to recognize, however, is that most purchasers of stock in a professional sports franchise are not likely interested in the stock as a pure investment, but rather as a memento. These offerings are more or less marketed exclusively to the fan-as-investor rather than to the conventional investor or to the investment community as a whole.127 Sports stocks are better understood as being analogous to the purchase of a team t-shirt or hat rather than an investment on Wall Street.128 Persons willing to invest in sports stocks enter these situations with their eyes wide open. Disclosure rules found in the Securities Act of 1933 and the Exchange Act of 1934 and enforced by the SEC assure that investors have the opportunity to be well informed about the risks inherent in any stock purchase. As financial analyst Jeff Phillips commented, “You can always come up with a better pure (financial) investment. The bigger issue is what are people’s expectations? It’s a memento. If you’re looking at it to put a stock certificate on the wall, then you’re doing it for the right reason.”129
[Ed. Note: Author’s discussion of the structuring of a public offering for a sports franchise is omitted.]
CONCLUSION
Conducting a public offering of stock is only one among a number of alternatives for professional sports team owners with capital needs. The National Basketball Association runs a … credit facility, which makes low interest rate loans available to teams.155 … The facility uses the collective collateral of the league and its teams to negotiate for lower rates than most clubs could secure on their own.156 Similar programs exist in Major League Baseball and the National Football League.157 Alternatively, an owner in need of capital or looking to liquidate part of his investment may have little problem locating a single private investor or small group of private investors to meet such needs.
A public offering of stock, however, offers some clear advantages to owners over these and other alternatives. By financing through equity rather than debt, the owner is not forced to repay with interest the capital he raises. Following the lead of other teams that have gone public in the past, the owner can make it clear to investors that there are no plans to pay dividends at any time in the foreseeable future. Thus, the owner gives up none of the economic rights associated with ownership. As for taking on another private investor, it is unlikely that a single, sophisticated investor or small group of investors would be willing to invest a large chunk of capital under lopsided terms that grant no voting or economic rights, season ticket privileges, or other perks. Thus, despite some obstacles and drawbacks, conducting an IPO of some portion of a franchise may allow an owner to receive an influx of capital without giving up any of the economic control or voting rights associated with ownership. Dick Jacobs did exactly this, pocketing $60 million in 1998 while giving up nothing in terms of control over the Cleveland Indians, and owners may take heed of his example in the future.
From the fan’s perspective, the purchase of stock should be looked at not as a financial investment, but as another way to show support for the team. Disclosure requirements enacted in the Securities Act of 1933 and the Securities Exchange Act of 1934 would force disclosure to fans about the nature of the investment they are making, though there is little evidence that fans would be deterred by the prospect of a poor financial investment. Sports fans are a rabid bunch, willing to shell out money for anything with the team logo on it. The more unique the item, the more they are willing to pay. One Red Sox fan demonstrated the kind of attitude a team contemplating a stock sale would seek in investors:
If somebody wants a census of RSN (Red Sox Nation) Citizens nationwide or measure interest in the Red Sox, just have the Sox offer stock and see how fast it would sell out…. Each season, we RSN Citizens see the Yankees buy more high priced free agents and their payroll climb over $200 million. Theo [Epstein, the team General Manager] wouldn’t have to burn up his calculator wrestling with new contracts versus a budget limitation … or …use the money for a New Fenway? …. Most every Sox fan would really enjoy owning a little piece of their team—even if it’s only 50 or 100 shares, even if there’s never a financial dividend, just as long as the franchise is strong with more latitude to make deals and operate.158
It is this kind of loyalty among the fan population that may make widespread public offerings of professional sports franchises a viable option now and in the future.
Notes
….
7. Martin Wolk, Is Baseball a Bad Business?, http://www.msnbc.msn.com/id/3073502/ (August 11, 2005).
8. Andrew Zimbalist, Baseball and Billions: A Probing Look Inside the Big Business of Our National Pastime, 49 (1992). The Yankees have by far the highest average attendance of any MLB team since 2003. ESPN MLB Attendance Report: 2006, at http://sports.espn.go.com/mlb/attendance (last visited May 15, 2006).
9. Brian R. Cheffins, Playing the Stock Market: “Going Public” and Professional Team Sports, 24 J. Corp. L. 641, 648 (1999).
10. Daniel Kadlec, An Unhittable Pitch, Time, June 15, 1998, at 50.
11. Bill Lubinger, Jacobs & Dolan: How they Haggled on Tribe, Plain Dealer (Cleveland), Jan 7, 2000, at 1A.
12. Cleveland Indians Baseball Co., Proxy Statement 8 (Proxy), at 20 (Jan 5, 2000).
13. Scott Lascari, The Latest Revenue Generator: Stock Sales By Professional Sports Franchises, 9 Marq Sports L.J 445, 454 (1999).
14. Sarah Talalay, Public Ownership Doesn’t Rake in Dough, S. Fla. Sun-Sentinel, July 29, 2001, at 7C.
15. Id.
16. Daniel Kaplan, Public Firms Retreat from Owners Box, Street & Smith’s Sports Bus J., Oct 7–13, 2002, at 1.
17. Cheffins, supra note 9, at 647–48.
18. Paul J. Much, Inside the Ownership of Professional Sports Teams 27–28 (Team Marketing Report, Inc., Chicago 1997).
19. Tribune Company continues to own and operate the Cubs. News Corp sold a controlling interest in the Dodgers to Boston businessman Frank McCourt in January 2004. See Dodgers Team History, http://losangeles.dodgers.mlb.com/NASApp/mlb/la/history/timeline12.jsp (last visited May 15, 2006); Cubs team history, http://chicago.cubs.mlb.com/NASApp/mlb/chc/history/timeline12.jsp (last visited May 15, 2006).
20. Toronto Blue Jays Franchise History, http://en.wikipedia.org/wiki/Toronto_Blue_Jays (last visited May 15, 2006).
21. Cheffins, supra note 9, at 648.
22. Id. In 2003, Disney sold the Anaheim Angels to Arte Moreno, taking ownership out of public hands. Disney completely exited the ownership of pro sports franchises with the 2005 sale of the Anaheim Mighty Ducks. See Mark Whicker, Disney Departs Pro Sports Ownership, Orange County Register, Feb 26, 2005.
23. Green Bay Packers Shareholders, http://www.packers.com/stockholders/ (last visited May 15, 2006).
24. Green Bay Packers Stock & Financial History, http://www.packers.com/history/fast_facts/stock_history/ (last visited May 15, 2006).
25. Id.
26. See Green Bay Packers, Inc. 1997 Common Stock Offering Document (Nov 14, 1997) [hereinafter Packers’ Offering Document].
27. Green Bay Packers Stock & Financial History, supra note 24.
28. See Packers’ Offering Document, supra note 26, at 5. Immediate family refers to the spouse, child, mother, father, brother(s), sister(s), or any lineal descendant of the stockholder. See id.
29. Green Bay Packers Shareholders, supra note 23.
30. Additionally, a number of minor-league teams currently use community based ownership: Toledo Mud Hens, Appleton Timber Rattlers, Harrisburg Senators, Memphis Redbirds, Rochester Red Barons, Syracuse Sky Chiefs. See New Rules Project, http://www.newrules.org/sports/ (last visited May 15, 2006).
31. Lynn Reynolds Hartel, Community-Based Ownership of a National Football League Franchise: The Answer to Relocation and Taxpayer Financing of NFL Teams, 18 Loy. L.A. Ent. L. J. 589, 594 (1998).
32. See id.
33. Brad Smith, How Different Types of Ownership Structures Could Save Major League Baseball Teams from Contraction, J. Int’l Bus. & L. 86, 104 (2003).
34. See Community Ownership of Minnesota Twins, H.F. 1368 (April 6, 2005), available at http://www.house.leg.state.mn.us/hrd/bs/84/hf1368.html (last visited May 15, 2006).
35. H.F. 1368 Bill Summary, available at http://www.house.leg.state.mn.us/hrd/bs/84/hf1368.html (last visited May 15, 2006).
36. Id.
37. Brian R. Cheffins, UK Football Clubs and the Stock Market: Past Developments and Future Prospects: Part I, 18 Comp. Law. 66, 70, n. 3 (1997).
38. See Brian R. Cheffins, Sports Teams and the Stock Market: A Winning Match?, 3 U.B.C. L. Rev. 271, 279 (1998) (citing the NFL’s uncodified policy prohibiting public offerings of shares in NFL clubs).
39. See Sullivan v Nat’l Football League, 34 F.3d 1091, 1095 (1st Cir. 1994).
40. Baseball Owners OK Sale of Stock to Public, The Fort Worth Star Telegram, Sept. 19, 1997 at S5.
41. See Tom Nawrocki, Investing in Diamonds, Sports Illustrated, Sept. 29, 1997 at 18.
42. Kadlec, supra note 9.
43. See Jac MacDonald, Peter Puck is Selling Part of His Empire—Will There Be Any Takers?, Edmonton J. (February 6, 1997); Cheffins, supra note 38, at 279.
44. Cheffins, supra note 38, at 282.
45. Id. at 279.
46. Id.
47. Sullivan v Nat’l Football League, 34 F.3d 1091, 1095 (1st Cir. 1994).
48. Id. (noting that Article 3.5 of the NFL Constitution codifies the policy against public ownership).
49. Id at 1096.
50. Id.
51. Id.
52. See id.
53. Id. (The judge in the trial reduced the verdict through remittur to $17 million. Pursuant to 15 U.S.C. 15, which provides for treble damages for antitrust violations, the court entered a final judgment for Sullivan of $51 million.)
54. Id at 1102.
55. Brian Cheffins, supra note 9, at 649.
56. Ballparks by Munsey & Suppes, http://www.ballparks.com/baseball/index.htm (last visited May 15, 2006).
57. Ballparks by Munsey & Suppes, Citizens Bank Park, http://www.ballparks.com/baseball/national/phibpk.htm (last visited May 15, 2006). Citizens Bank Ballpark is the current home of baseball’s Philadelphia Phillies. The estimated cost to build was $346 million.
58. In the NFL, Invesco Field at Mile High (home of the Denver Broncos) was completed in 2001 at an estimated cost of $364 million. Ballparks by Munsey & Suppes, Invesco Field at Mile High, http://football.ballparks.com/NFL/DenverBroncos/newindex.htm (last visited May 15, 2006). In the NBA, the FedEx Forum (home of the Memphis Grizzlies) was completed in 2004 at an estimated cost of $250 million. Ballparks by Munsey & Suppes, Fed Ex Forum, http://basketball.ballparks.com/NBA/MemphisGrizzlies/index.htm, (last visited May 15, 2006).
59. See Jane Fuller, A Fixture that Sets Even Tougher Goals, Fin. Times (London), April 22, 1991, at 26; Matthew Rowan, Down in the Valley They Keep Their Eye on the Ball, Indep. (London), May 3, 1998, Bus., at 5; Peter Sloane, The Economics of Sport: An Overview, Econ. Affairs, Sept. 1997, at 2, 3; Patrick Tooher, Sunderland Scores on Trading Debut, Indep., Dec. 26, 1996, at 19.
60. Paul Dempsey & Kevan Reilly, Big Money, Beautiful Game 40–43 (1998).
61. Raymond J. Keating, Sports Pork: The Costly Relationship between Major League Sports and Government, Pol’y Analysis, April 5, 1999, at 1, 11–15, available at http://www.cato.org/pubs/pas/pa-339es.html (last visited May 15, 2006).
62. Katherine C. Leone, No Team, No Peace: Franchise Free Agency in the National Football League, 97 Colum. L. Rev. 473, 476–77 (1997); see Adam Teicher, NFL Teams Walk When Money Talks: Cleveland Browns’ Plan to Move Makes Fans Worry About Own Teams, Kan. City Star, Nov. 12, 1995 at A1. When the Cleveland Browns moved to Baltimore, they left behind a legion of loyal and heartbroken fans (including the Author).
63. Cheffins, supra note 9, at 650.
64. Meredith J. Kane, Stadium Financing Increasingly Using Private Fund Sources, N.Y.L.J., Jan. 19, 1999, at S4; Jonathan Rand, Voters Tell Owners to Pay for Stadiums, Kan. City Star, Mar. 29, 1998, at C8; see also Don Bauder, Liberals, Conservatives Gang Up on Team Owners, Copley News Serv., Dec. 8, 1997; Jim Murray, Such Gluttony is Hard to Digest, L.A. Times, Nov. 6, 1997, at C1.
65. Ballparks by Munsey and Suppes, http://football.ballparks.com/NFL/NewEnglandPatriots/newindex.htm (last visited May 15, 2006).
66. Id.
67. Ballparks by Munsey and Suppes, http://www.ballparks.com/baseball/national/cinbpk.htm (last visited May 15, 2006).
68. For example, nearly one-third of the financing for Petco Park in San Diego (opened in 2004) came from private funds while roughly half of the financing for Citizens Bank Ballpark in Philadelphia (opened in 2004) came from private funds. See Ballparks by Munsey and Suppes, http://www.ballparks.com/baseball/national/sdobpk.htm (last visited May 15, 2006); see also Ballparks by Munsey and Suppes, http://www.ballparks.com/baseball/national/phibpk.htm (last visited May 15, 2006).
69. Cheffins, supra note 9, at 651.
70. Brad Smith, How Different Types of Ownership Structures Could Save Major League Baseball Teams from Contraction, J. Int’l Bus. & L. 86, 92–93 (2003).
71. Cheffins, supra note 38, at 276.
72. For instance, the first overall pick in the 2005 NFL Draft, Alex Smith of the University of Utah, signed a contract with the San Francisco 49ers which included over $20m in the form of a signing bonus.
73. The amount of a player’s signing bonus, though paid immediately to the player upon the signing of the contract, is prorated across the length of the contract for salary cap purposes. For example, assume Player A signs a 5 year contract with a $20 million signing bonus and salaries of $1 million for each of the five years. The amount paid to Player A in year 1 is actually $21 million. However, because of the signing bonus proration, the amount that Player A counts against the salary cap is $5 million in year 1.
74. See USA Today Salaries Databases, supra note 1.
75. The Washington Redskins took in $245 million in revenue in 2004, while the San Francisco 49ers took in $151 million. See The Business of Football, Forbes Magazine, January 27, 2005, available at http://www.forbes.com/2004/09/01/04nfland.html (last visited May 15, 2006).
76. Scott C. Lascari, The Latest Revenue Generators: Stock Sales by Professional Sports Franchises, 9 Marq. Sports L.J. 445, 447–8 (1999). Rather than being a stock market team, the Packers are a community-owned non-profit entity. The differences are explored in Part I, supra.
77. Tom Silverstein, Packers Happy with Stock Sale, but 120,000 Shares Sold Falls Short of Goal, Milwaukee J. Sentinel, Mar. 18, 1998, at C1.
78. See id. at C7.
79. See Mackey v Nat’l Football League, 543 F.2d 606, 621 (8th Cir. 1976) (“The destruction of competitive balance would ultimately lead to diminished spectator interest, franchise failures, and perhaps the demise of the NFL, at least as it operates today”).
80. Frank H. Easterbrook & Daniel R. Fischel, The Economic Structure of Corporate Law 230 (1991).
81. Cheffins, supra note 9, at 653.
82. Wolk, supra note 7, http://www.msnbc.msn.com/id/3073502/ (last visited May 15, 2006).
83. Cheffins, supra note 9, at 655.
84. See id.
85. Jimmy Burns, The Transfer Market, Fin. Times (London), Apr. 29, 1997, at 2; Roger Cowe, Float Values Club at More than £150m, Guardian (London), Jan. 17, 1997, at 22.
86. See Cheffins, supra note 37, at 68–69.
87. Kadlec, supra note 10, at 50.
88. Mark Veverka, IPO by Cleveland Indians Not Exactly a Hit With Investors, San. Fran. Chron., June 5, 1998, at B1.
89. Cleveland Indians Baseball Co., Inc., 1998 Prospectus 1, 8 (1998), available at http://www.sec.gov/Archives/edgar/data/1059019/0000950152-98-005093.txt (last visited May 15, 2006) [hereinafter 1998 Prospectus].
90. Lascari, supra note 76, at 460.
91. Id.
92. The Company noted in the 1998 Prospectus that the Company did not intend to pay dividends to holders of either Class A or Class B Common Stock for the foreseeable future, and that all future earnings would be retained for reinvestment into the business. See 1998 Prospectus, supra note 89, at 15.
93. Mr. Jacobs ultimately agreed to sell the Indians in 1999 to Larry Dolan for $320 million. This transaction was structured as a cash-out merger, which meant that all shareholders were required to tender their shares back to the Company for cash consideration of $22.61 per share. When the merger closed in February 2000, the Cleveland Indians ceased to be a publicly traded organization. See Eugene Stroz, Public Ownership of Sports Franchises: Investment, Novelty, or Fraud?, 53 Rutgers L. Rev. 517, 528–29 (2001).
94. Due to, among other things, the fact that compared to other investments, sports franchise stock ownership is likely to yield a much lower return. See Part IIIC, infra.
95. Cheffins, supra note 9, at 657.
97. Cheffins, supra note 9, at 657.
98. Davis was successful in his case, and moved the team. The team has since moved back to Oakland.
99. Gregory M. Kratofil, Jr., Direct Public Offerings Can Fill Business’ Capital Needs, Kansas City Bus. J., June 25, 1999, at D1 (reporting costs of traditional intermediated offering as 15% while costs of a direct disintermediated offering are only 6%); More Companies Than Ever Do Their Own IPOs, Bus. Wire, Apr. 2, 1999 (reporting that the cost of a traditional IPO is usually about 15% of the total amount raised, compared to 3% on a typical $1 million direct public offering).
100. See 1998 Prospectus, supra note 89, at 20.
101. Carl Schneider, Joseph Manko & Robert Kant, Going Public: Practice, Procedure, and Consequences, 27 Vill. L. Rev. 1, 8–9 (1981).
102. Cheffins, supra note 9, at 661.
103. C. Steven Bradford, Transaction Exemptions in the Securities Act of 1933: An Economic Analysis, 45 Emory L.J. 591, 605 (1996).
104. 15 U.S.C.A. 78(m) (2006).
105. Larry Lebowitz, Panthers Stock: $1,000 Minimum, Sun-Sentinel (Fort Lauderdale, Fla.), Sept. 26, 1996, at D1.
106. Cheffins, supra note 9, at 662.
107. Id. (citing Gary Delsohn, Questions and Answers Surrounding the Kings’ Existence in Sacramento, Sacramento Bee, Jan. 23, 1997, at C1).
108. See Lebowitz, supra note 105, at D1.
109. Cheffins, surpa note 38, at 279.
110. Id. at 280.
111. Professional Sports Team Stocks Suddenly Seem to be on a Roll, The Tampa Trib., Feb. 18, 1997, at B7.
112. Cheffins, supra note 38, at 282.
113. Id. (citing John Ivison, Murray Rules Out Suggestions of Share Flotation for Rangers, The Scotsman, Oct. 27, 1995, at 21).
114. Allison Romano, For Fans, Value of Owning Stock Comes in Sentiment, Not Dollars, Chicago Daily Herald, June 9, 1999, at 5.
115. Id.
116. See Leigh Allan, Meeting Passes Mustard for Cleveland Indians’ Stockholders, Dayton Daily News, June 5, 1999, at 1B. A spokesman from a New York Stock Exchange Company interviewed for the same story stated that perhaps 200 of the company’s more than 400,000 investors actually showed up to its annual meeting. Id.
117. Jeff Fedotin, Packers Showcase Practice Skills for Shareholders, July 27, 2005, http://www.packers.com/news/stories/2005/07/27/2/ (last visited May 15, 2006); see also Jeff Fedotin, Packers Deliver Team Report at Annual Shareholders’ Meeting, July 27, 2005 http://www.packers.com/news/stories/2005/07/27/1 (last visited May 15, 2006).
118. See generally Eugene Stroz, Public Ownership of Sports Franchises: Investment, Novelty, or Fraud?, 53 Rutgers L. Rev. .517 (2001).
119. Lascari, supra note 76, at 458.
120. Daniel Kaplan, Public Firms Retreat from the Owners Box, Street & Smith’s Sports Bus. J., Oct. 7–13, 2002, at 1.
121. See Stefan Fatsis, Cleveland Indians Are Put on the Block by Jacobs, and Stock Price Soars 64%, Wall St. J., May 14, 1999, at B (citing comments by Paul Much, consultant with Chicago investment firm Houlihan Lokey Howard & Zukin).
122. See id.
123. Id.
124. Chris Isidore, Firing Team Owners?, CNN Money, December 20, 2004, http://money.cnn.com/2004/12/16/commentary/column_sportsbiz/sportsbiz/ (last visited May 15, 2006). Al Lerner, the owner of the Cleveland Browns, died in 2003 but left the team to his son Randy who has assumed ownership rather than selling the team. Wikipedia, http://en.wikipedia.org/wiki/Cleveland_Browns (last visited May 15, 2006).
125. The example of the Boston Celtics is illustrative of this fact. The Celtics went public in 1986 at a unit price of $18.50. The club was finally sold in 2002, at which time, owners of shares in Boston Celtics LP received $27.00 per share. This represents an annual average return of 2.39% during a time of unprecedented growth in the stock market. See Peter May, New Team Officially in Place, Boston Globe, Jan. 1, 2003, at F3.
126. See Stroz, supra note 118, at 540.
127. Id. at 539.
128. Id. at 54 (quoting Dean Bonham, a noted sports marketing consultant).
129. Sarah Talalay, Public Ownership Doesn’t Rake in the Dough, South Florida Sun-Sentinel (Ft Lauderdale, Fla.), July 29, 2001, at 7C (quoting Jeff Phillips, senior vice president of an investment banking firm which advises sports teams).
155. Daniel Kaplan, Cool with Pool: NBA to Renew Credit Facility, Street & Smith’s Sports Bus. J., May 2, 2005, at 4.
156. Id.
157. Daniel Kaplan, Vikes Get $125m from NFL Pool, Street & Smith’s Sports Bus. J., July 21, 2003, at 5.
158. Quote on Red Sox message board http://bostondirtdogs.boston.com/Headline_Archives/2005/01/barks_bites_1.html (last visited May 15, 2006).
TAX CONSIDERATIONS
TAX REVISIONS OF 2004 AND PRO SPORTS TEAM OWNERSHIP
Edward N. Coulson and Rodney Fort
I. INTRODUCTION
Major League Baseball (MLB) entrepreneur Bill Veeck claims that he convinced the IRS that the roster of players was a depreciable asset following his purchase of the Cleveland Indians in 1946 (Veeck, 1962). Okner’s (1974) assessment of this “roster depreciation allowance” (RDA) first appeared nearly 20 years later. The point of Okner’s work, and subsequent work after nearly another 20 years by Quirk and Fort (1992), was to demonstrate the RDA by example, illuminating its illogical foundations, and highlight its ongoing consequences. Despite these flaws, the RDA has endured. The effects of the most recent change in tax policy governing the RDA under the tax revisions of 2004, effective 2005, is the point of this paper.
Under previous 1976 tax laws, from 1977 to 2004, sports team owners were allowed to treat 50 percent of the team purchase price as an asset depreciable over no more than 5 years, what we refer to as the “50/5 Rule.” The 2004 revision set the RDA at 100 percent of the purchase price depreciable over no more than 15 years, what we will refer to as the “100/15 Rule.” All interested parties agreed that administrative enforcement costs would be driven to zero since, under the lavish percentage and depreciation period of the 100/15 Rule, no real legal challenges would be raised. Controversy over this revision did arise over the impacts on both team owner tax payments and team values.
Congressional supporters argued that owners would pay more taxes. A report by the Congressional Joint Committee on Taxation said the revisions would increase owner tax bills $381 million over 10 years. Industry experts disagreed, stating flatly that the revisions would generally lower tax payments by owners (Wilson, 2004, p. 2). To round out the controversy completely, a lobbyist-spokesman for MLB stated that tax payments would remain unchanged (Wilson, 2004, p. 3).
Turning to franchise values, members of Congress were silent but the same industry experts claimed the RDA revisions would raise the capital values of sports franchises. Lehman Brothers publicly stated that the revisions would add about 5 percent to sports team values across all leagues. Raymond James & Associates more vaguely agreed that team values would “increase” (Wilson, 2004, p. 3).
League officials, their lobbyists, and team owners were much less committal. They agreed there would be some advantages but chose instead to downplay the tax advantages and focus on the issue of owners suffering true net operating losses (Rovell, 2004, p. 1). Both Jeff Smulyan, previous owner of MLB’s Seattle Mariners, and David Samson, President of MLB’s Florida Marlins, voiced that the benefits of depreciation are small consolation for owners facing true operating losses. Ted Leonsis, owner of the NHL’s Washington Capitals, said, “I look forward to the day where (write-offs are) an issue for me.”
While its public statements downplayed the value of the RDA, MLB actively lobbied for the revisions and the National Football League (NFL) also publicly supported them. The National Basketball Association (NBA) and National Hockey League (NHL) remained neutral. Ostensibly, the reason for this lobbying was more about saving on legal fees than on raising franchise values. William H. Schweitzer, a managing partner of the Washington law firm that promoted the revisions for MLB, said they would have a slightly positive impact, varying from club to club. The revisions would eliminate IRS disputes without significantly changing taxes. Indeed, he offered that MLB had not specifically evaluated how the revisions would affect franchise values (Wilson, 2004, p. 3).
We present a model of tax policy and the RDA whose implications allow us to sort through these conflicting opinions, empirically. The model shows the impact of the RDA on team value and the impact of changes in the RDA on team values and taxes paid by owners. We hold all other values of team ownership constant and allow owners to either hold the team or sell it after the expiration of the RDA. Thus, we are able to 1) show the value of the RDA in terms of team operating profits, 2) provide comparative static results for parameters of the RDA, 3) explore the role of the “other values” held constant, and 4) apply our findings to the controversy just detailed.
Our findings suggest that supporters in Congress were qualitatively correct (though we cannot comment quantitatively on their $381 million over 10 years); taxes paid by owners should have increased. In addition, while MLB team values should have increased, outside analysts appear to have under-estimated franchise values by half. Since our model shows that the value of the RDA increased under the 2004 revisions even though taxes increased, it is small wonder that MLB and the NFL lobbied in favour of the 2004 revision.
….
The paper proceeds as follows. In Section II we describe the RDA in more detail. Section III contains our model of the impact of the RDA on team value, including sensitivity of team values to tax policy changes that affect the RDA and other parameters determining team values. Section IV employs actual data on the parameters in our model to show relative team values and tax payments, under each of the ownership approaches, for the case at hand. Assessment of the actual impacts of tax policy governing the RDA is in Section V. Conclusions round out the paper.
II. THE ROSTER DEPRECIATION ALLOWANCE
The purchase of a professional sports franchise consists mainly of the rights to intangible assets. Some derive from league membership (territorial rights, revenue shares from attendance and television, and shares of future expansion fees). Others derive from their relationship with state and local hosts (revenues from tickets, parking, and concessions). Finally, there are “other values” like related business opportunities, accounting costs that are actually profit-taking, revenue-shifting tax advantages from joint ownership, and, the point of this paper, tax advantages through the RDA. Fort (2006) discusses all of these other ownership values in detail, including those from the RDA, and estimates that they might be upwards of 18 percent of actual recent sale values.
Historically, the assignment of value to particular assets evolved arbitrarily. Bill Veeck describes how he wrested the RDA from the IRS after he bought the Cleveland Indians in 1946 (Veeck, 1962; Quirk and Fort, 1992). Essentially, Veeck assigned the bulk of the firm’s value (90 percent) to the intangible player roster asset and devised a depreciation schedule (5 years) to reduce his taxable obligation on the team. A possible parallel is the depreciation of livestock purchased for work, breeding, or dairy purposes but not kept in an inventory account. Apparently, these types of livestock “wear out” in their relative productive roles and the IRS allows them to be treated as depreciable assets for tax purposes.
Okner (1974) and Quirk and Fort (1992) criticize this RDA for three reasons. First, while some players may be in the declining end of their careers, still other players are appreciating in value; it is not at all clear that “the roster” itself depreciates. Second, it is relatively easy to conceive a value in player contracts, but team owners do not own players as breeders own livestock. Third, the depreciation allowance surely involves double counting since the salaries and player development costs that create the asset are already treated as expenses at market determined values. But far from recognizing these inconsistencies, the IRS even changed its treatment of contracts to allow depreciation of individual player contracts, subject to capital gains if held long enough (Ambrose, 1985, p. 173).
There were IRS challenges of subsequent large RDA claims by other owners. One of the more famous involved the current MLB Commissioner, Bud Selig. A group led by Selig bought the bankrupt Seattle Pilots in April of 1970 for $10.8 million and moved them to Milwaukee. The IRS challenged Selig’s claim that 94 percent of the purchase price could be attributed to the player roster and demanded a large tax adjustment. Selig sued and won the case (Selig v. U.S., 565 F. Supp. 524). Eventually, tax reform legislation in 1976 set the 50/5 Rule and revisions in 2004 set the 100/15 Rule. The point of what follows is to assess changes in team values and owner tax bills following the tax policy that implemented the 100/15 Rule.
III. THE MODEL
We assume the team is structured as a pass through (e.g., subchapter S corporation; limited partnership) so that all tax savings occur at the individual income tax rate. In most cases, the size of the depreciation is easily enough to eliminate any taxes that would have been paid on the team’s net operating revenues, and actually to shelter income from other endeavors besides team ownership. We choose to focus on this tax shelter value of the pass-through to the individual tax forms of team owners.
Table 7 Comparative Statics Summary
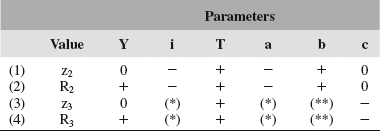
Source: Contemporary Economic Policy. Used with permission.
Notes: Only outcomes for z3 > 0 are calculated. *Negative for sufficiently small values of c. **Positive for sufficiently small values of c.
While the tax-saving value of the RDA is one of the “other values” of ownership mentioned in the last section, there is no reason that changes in the RDA would have any cross-effect on any of the rest of the other values….
Since all other values are held constant, the model is based on the tried-and-true assumption that the fundamental value of the firm is equal to the discounted flow of operating profits and, in the case of the RDA, tax savings on team operations and pass-through shelter of taxable income from other endeavors besides team ownership. In this setting, we further assume net operating revenue, nonroster depreciation, amortization and remaining parameters of the model remain constant over time. We will also assume that net revenue after subtracting nonroster depreciation and amortization is positive, but less than the value of roster depreciation. This assures that the pass-through value of the RDA is positive. Finally, we’ll use simple straight-line depreciation.
Our approach is to define the model first for the case of no RDA and then introduce the RDA to the model under two alternative ownership strategies. We do not model the choice (although we examine it empirically, later), but owners can hold the team into perpetuity after the RDA expires (henceforth, the “hold strategy”) or sell the team after the RDA expires (henceforth, the “sell strategy”).
….
A summary of our model findings is as follows. First, team value increases unambiguously with the RDA under the hold strategy (relative to no RDA), even though taxes paid also will increase. Second, our theory alone cannot dictate if team values or owner tax bills are higher under the sell strategy or not. Data on the parameters of our model are required to settle the issue. Third, all else constant, an increase in the personal income tax rate raises the relative value of the hold strategy and owner tax bills, but increases in the parameters of the RDA, itself, have conflicting effects on both of these. Finally, team value and owner tax bills for the sell strategy with respect to the length of the RDA period and the percentage of purchase price attributed under the RDA are the same as for the hold strategy only for sufficiently small values of the capital gains rate. Settling this last issue also requires attention to the data on the parameters of interest (see Table 7).
IV. THE RELATIVE VALUES OF THE HOLD AND SELL STRATEGIES
To settle the ambiguities detailed in the last section and gain insight into the controversy outlined in the introduction, we turn to data on the interest rate, personal income tax rate, and capital gains tax rate. Given the income levels of owners, we focus only on the rates paid by top income earners. The capital gains rate has been less than the income tax rate except for a brief period when they were equal, 1988–1990. The data (and sources) are shown for representative years in Table 8—the effective date of the 50/5 (1977), halfway between the 50/5 Rule imposition and the 100/15 Rule imposition (1990, also representative of that short period when personal income and capital gains tax rates were equal), the year just prior to the creation of the100/15 Rule (2003), and the effective date of the 100/15 Rule (2005). Lacking verifiable cash flow data, we must examine relative values of the hold and sell strategies. We examine each strategy separately and then compare the two in order to facilitate the policy assessment in the next section. The results are in Table 9 for each of the years in Table 8.
The Hold Strategy
Compared to the codification of the 50/5 Rule effective in 1977, the relative value of the hold strategy was 20.4 percent lower in 1990, 14.8 percent lower in 2003, and returned to within 95 percent of its 1977 value for the codification of the 100/15 Rule effective in 2005.
Table 8 Model Parameters for Various RDA Episodes
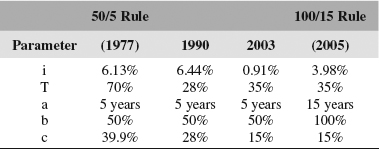
Sources: i = 13-week T-Bill yield index from the Global Financial Data (2008); a and b are known from Quirk and Fort (1992), Rovell (2004), and Wilson (2004); c and T are from the Citizens for Tax Justice (2008); and K is from the text, expression (3). Reproduced from Contemporary Economic Policy. Used with permission.
Notes: All values are actual values except that i and c are averaged over the 1971–76 period (the income tax rate was constant during the period).
Table 9 Team Values Relative to V1, Various RDA Episodes
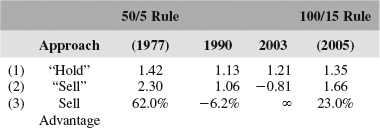
Source: Contemporary Economic Policy. Used with permission.
Notes: Calculated from Expressions (1) through (4) in the text using the parameters in Table 7.
….
For 2003, both the continued decline in the interest rate and the increase in the personal income tax rate raised the relative value of the hold strategy.
Second, the impact of the RDA parameter changes under the 100/15 Rule are in opposite directions (raising the percentage of the purchase price should raise the relative value of the hold strategy but increasing the length of the depreciation period should have an offsetting effect). Further, an increase in the interest rate should decrease the relative value of the hold strategy. For the imposition of the 100/15 Rule, the increase in the percentage of the purchase price must have dominated since the relative value of the hold strategy increased.
The Sell Strategy
Given the data in Table 8 on the relationship between the capital gains tax rate and the personal income tax rate (required since our theoretical implications depend on it), our comparative static results again paint a compelling picture. First, the relative value of the sell strategy should increase with the percentage of the purchase price applied under the RDA. Second, the relative value of the sell strategy should decrease in the interest rate, except for 2003 where it increases in the interest rate. Finally, the relative value of the sell strategy should decrease in the length of the depreciation period under the RDA.
For 1990, the effects of the increased interest rate and decline in the personal income tax rate offset the effects of the decline in the capital gains tax rate since the relative value of the sell strategy declined. To return to a negative value in 2003, the effect of the interest rate had to overcome the effects of an increase in the personal income tax rate and a decline in the capital gains tax rate. Finally, the last decline in the relative value of the sell strategy with the imposition of the 100/15 Rule cannot be attributed solely to the imposition of that rule. One element of the newest rule, increasing the length of the depreciation period under the RDA, should reduce the relative value of the sell strategy, but the other element, increasing the percentage of the purchase price applied under the RDA, should increase the value. Further, increased interest rates would also act to lower the relative value of the sell strategy.
Comparing Hold and Sell
The only exception is 1990, but the results of our model in the last section help explain this outcome. While the increasing interest rate may well have been an important kicker and the relative values of both the hold and sell strategies fell, it is also true that the personal income tax rate and the capital gains tax rate both fell and became equal to each other (Table 8)….
V. POLICY ASSESSMENT
Since we do not model the hold or sell decision, and the impact on team value and owner tax payments depends on it, we cannot address the controversy in the introduction until we examine whether owners actually hold or sell their teams at the expiration of whatever RDA. In Table 10, we compare a variety of statistics on holding periods and the like for all MLB owners purchasing teams during the reign of the 50/5 Rule, 1977–2004, and their predecessor owners. There are insufficient observations for any statements about actual owner choice after the 100/15 Rule. In addition, it is useful to separate expansion team transactions from others since the number of expansion teams is different in each period. Finally, teams that were purchased during the 50/5 Rule period but not sold again to date require special attention (see the notes to Table 10).
Two things are interesting to note in Table 10. First, compared to the preceding 30 years when the RDA was evolving, excluding expansion team transactions, the number of sales increased 7 percent, the holding period declined 39.9 percent, and the vast majority of teams (65.2 percent) were held for a shorter number of years under the 50/5 Rule. Second, the vast majority of teams also were held longer than the duration of the RDA; 22 out of 26 longer than five years (84.6 percent). Other than selling like hotcakes relative to the preceding period (by a factor of 2.75), the story is the same for expansion teams as it is for the rest under the 50/5 Rule. Thus, it is safe to say that owners during this period clearly were not choosing the sell strategy. Indeed only four owners (including 3 expansion team owners) during this period actually did so. If all remaining purchases yet to be resold did so within 5 years of purchase, there would be 8 more but even 15 would be well below a majority of the 49 total sales.
But if teams really were as we have modeled them, owners clearly should be adopting the sell strategy. Our explanation for this behavior is to return to our assumption that all “other values” of ownership were constant. Fort (2006) makes it clear that other values loom large and the results in Table 10 suggest that owners overwhelmingly reject the sell strategy in order to hold on to these other values. This is reasonable since it is highly likely that other values rose during the reign of the 50/5 Rule.
First, there has been a dramatic change in the type of ownership from single individuals to corporations after 1977 and other values should be both larger and easier for corporations to capture. Second, Fort (2006) shows that other values (for our purposes, unfortunately, including the value of the RDA) can represent upwards of 18 percent of recent sale prices. He also documents 5.3 percent and 9.5 percent real rates of growth in team sale prices for average holding periods over the 1970s and 1980s, respectively (relative to 2.5 percent to 3 percent for the economy at large). Finally, Humphreys and Mondello (2008) show that a quality-adjusted index of major league sport franchise prices practically exploded beginning in the late 1970s. But an examination of “typical revenues in MLB” (Fort, 2008) over this period shows an annual real rate of growth around 4.3 percent for 1974–1980. The upshot of all of this is that rest of the explosion in team prices seems reasonably to have been fueled by increases in “other values” held constant in our analysis.
Table 10 Team Holding Statistics, MLB, 1977–2004
| Last Owner | New Owner | |
New Expansion Teams | 4 | |
| Without Expansion Team Transations | ||
Total Purchases | 26 | |
Omitted | 0 | 3 |
Held ≤ 5 Years | 3 | 1 |
Held 6–10 Years | 8 | 11 |
Held >10 Years | 15 | 11 |
Average Years Held | 20.5 | 12.3 |
Sales w/Decreased Hold | 15 | |
% Increase in Sales | 7.0% | |
% Decline in Average Hold | –39.9% | |
% w/Decline in Hold | 65.2% | |
| Expansion Team Transactions | ||
Total Purchases | 15 | |
Omitted | 0 | 5 |
Held ≤ 5 Years | 3 | 3 |
Held 6–10 Years | 4 | 3 |
Held > 10 Years | 8 | 4 |
Average Years Held | 11.9 | 9.1 |
Sales w/Decreased Hold | 6 | |
% Increase in Sales | 275.0% | |
% Decline in Average Hold | –23.5% | |
% w/Decline in Hold | 60.0% |
Sources: Compiled from data in appendices of Quirk and Fort (1992), data at Fort (2008), and the most recent MLB team valuations in Ozanian and Baden hausen (2008). Reproduced from Contemporary Economic Policy. Used with permission.
Notes: There were 27 purchases excluding expansion franchises for 1946–1976, 10 new expansion teams, and 4 expansion team purchases (after the original entry franchise price). Percentage increase in the number of sales is on a per year basis since the earlier period is three years longer. 23 teams had not been resold as of 2004 so that hold durations for new owners were not evident (2 for 1946–1976 and 21 for 1977–2004). If the team had been held longer than 5 years as of 2004, their hold is stated as of 2004 and they are included in subsequent calculations. If the team had been held 5 years or less as of 2004, they are in the “Omitted” category in the table and omitted from subsequent calculations where relevant.
And that brings us finally to our chance to inform the controversy detailed in the introduction. Supposing that the hold strategy continues to dominate during the reign of the new 100/15 Rule, team values and owner tax payments should rise about 11.6 percent (1.21 to 1.35 in Table 9, row 1). So, supporters in Congress were precisely correct; taxes would increase under the 100/15 Rule. Our model does not allow us to cast judgment on the $381 million increase over 10 years since we do not know of any starting values for tax payments. However, even though they were right qualitatively, outside observers were decidedly low in their quantitative estimate of impacts on franchise values; our 11.6 percent calculation is fully 2.3 times their 5 percent claim.
It is small wonder that major leagues were at worst neutral (NBA and NHL) and at best highly supportive (MLB and NFL) of the 2004 revisions. Their costs and benefits are easily isolated looking at what happened immediately to the first crop of team sales in 2005. The 2005 team sales were $600 million for the NFL’s Minnesota Vikings, $375 million for the NBA’s Cleveland Cavaliers, $220 million and $180 million for MLB’s Oakland Athletics and Milwaukee Brewers (respectively), and $75 million for the NHL’s Anaheim Mighty Ducks.
On the cost side, we know of no other data on tax payments than those offered by the Congressional Joint Committee on Taxation cited in the introduction. Their estimate of an additional $381 million in tax revenues over ten years yields 381/10 $38.1 million per year ignoring discounting. That would be an additional $10.0 million for the 32-team NFL, or about $312,500 per owner annually. For the three remaining 30-team leagues, including MLB, each league total is $9.5 million, or about $316,700 per owner annually. These additional average taxes are at least indicative of the cost to the first crop of owners that sold their teams in 2005.
On the benefit side, the predicted 11.6 percent increase would be immediately capitalized into observed sale prices. The 11.6 percent increases are thus $69.6 million for the Vikings owner, $43.5 million for the Cavaliers owner, $25.5 million for the Athletics owner, $20.9 million for the Brewers owner, and $8.7 million for the Mighty Ducks owner. Across all four pro leagues, benefits clearly swamp costs. Indeed, we are left wondering why either the NBA or the NHL remained neutral.
It is tempting to label the downplayed claims by owners and their lobbyist in the introduction as disingenuous. For example, Mr. Leonsis dismisses write-offs like those under the RDA as insignificant to him. He purchased his NHL Washington Capitals in 1999 for a reported $85 million (Ozanian, Badenhausen, and Settimi, 2007), or $99.5 million 2005 dollars. Even if there were no other increase in the team price except an inflation adjustment to 2005, our calculation says that the increase would represent 0.116 × 99.4 = $11.5 million. This increase would have been large enough to recoup 11.5 percent of the $100 million in losses attributed to Leonsis’ ownership to 2004 (Rovell, 2004, p. 1).
Put another way, by the Joint Committee report of additional taxes, the average tax payment for each NHL owner, as stated above, would have increased about $316,700 from 2004 to 2005. If this is the 11.6 percent increase suggested by our results, the average tax bill for NHL operations in 2004 would have been 316,700/.116 $2.7 million. Using 33 percent for the top tax bracket puts average taxable net revenues on operations of 2.7/0.33 $8.2 million in 2004. Since Mr. Leonsis apparently is far below the average, his worst-case franchise value gain of $11.5 million is 40% greater than the average taxable NHL net revenue.
But rather than label them disingenuous, it is perhaps fairer to try to determine what else pro team owners and their advocates might have had in mind. For example, the value of our model parameters beyond the outset of the 100/15 Rule is subject to uncertainty. Expectations about interest rates and personal income tax rates (but probably not capital gains tax rates since the hold strategy seems to be the order of the day) may have been behind their downplayed claims. But even this argument is slightly diversionary. Statements based on expectations about these other parameters are beside the point from the perspective of the RDA! Those other parameters have nothing to do with a statement about changes in either the percentage of purchase price attributed under the RDA or the length of its depreciation period.
As a last general observation in this day and age where preferential economic treatment of wealthy owners is highly criticized, we note the following. Suppose government policies toward the other values enjoyed by owners were so tight that owners viewed their teams as stand-alone assets. In this case, “other values” would be minimal and the value of team ownership would be as we have it modeled. In such a world, it seems safe to say that the sell strategy would dominate. But if so, the imposition of the 100/15 Rule would have had dramatically different impacts!
From Table 9, row 2, the value of the sell strategy would have fallen under the 100/15 Rule (from the anomalous case in 2003 to a smaller value in 2005). But even so, the value of the sell strategy would still be 23 percent higher than the hold strategy (1.66 > 1.35), a fact that generates the following final insight. If “other values” are obtained politically by investment in the welfare of politicians that keep these other values flowing, then these other values must be at least as much as the 23 percent potential gain in Table 10. The opportunity cost to owners of their enjoyed “other values” is the 23 percent increase they could have employing the sell strategy for teams that are more like stand-alone assets. Investment in all types of policy toward sports leagues, not just tax policy, clearly has a payoff.
VI. CONCLUSIONS
The “roster depreciation allowance” (RDA) allows pro sports team owners to count a percentage of their team purchase price as a depreciable asset over a specific number of years. The RDA impacts the value of sports team ownership by reducing team tax obligations and providing pass-through tax shelter of an owner’s income from other endeavors besides team ownership. Tax law revisions of 2004 increased the amount of team purchase price attributed to the RDA from 50 percent to 100 percent and the allowed depreciation period from 5 to 15 years. Supporters claimed this would practically eliminate costly legal oversight by the IRS and increase owner tax bills. Government officials remained silent on team value impacts but outside analysts argued they would rise and both MLB and the NFL lobbied in favour of the revisions.
Modeling the RDA impact on the value of team operations, we investigate this policy change. Holding all “other values” of ownership constant, we formalize the value of operating a sports team and enjoying the financial benefits of the RDA for both a strategy where the team is held after the RDA runs out and a strategy where the team is sold after the RDA runs out. Applying actual data on the parameters of our model suggests that supporters in Congress were absolutely correct. Tax payments by owners should have increased. Those arguing that tax payments would decrease may have expectations about future cash flow, personal income tax rates, and/or interest rates that are different than the levels at the time of the revision in 2004. But none of those pertain to the revisions of the RDA, itself, under the 2004 revisions. Further, outside analysts missed the mark substantially. Increases in team values attributable to the RDA were likely to be just over twice their claims. Even though MLB remained silent on the impact on team values, our findings help explain support for the revisions by MLB and the NFL.
On a closing note, many of the “other values” of team ownership could be reduced by other types of policy intervention. If these interventions rendered teams more as stand-alone assets that do not generate substantial “other values,” owners would be more likely to follow the strategy of selling their team at the expiration of the RDA depreciation period. Interestingly, if such were the case, the value of teams would reasonably have been predicted to fall, instead, under the 2004 revisions. But since returns under the sell policy are 23 percent higher, and owners could reasonably bargain their “other values” politically for this higher return on operations, then “other values” must be worth more than the gain under the sell strategy. Policy toward sports team owners is a remarkably many-splendored thing.
References
Ambrose, J.F. 1985. “The Impact of Tax Policy on Sports.” In A. Johnson and J. Frey (eds.), Government and Sport. Totowa, NJ: Rowman and Allenheld, pp. 171–186.
Citizens for Tax Justice. 2008. “Top Federal Income Tax Rates on Regular Income and Capital Gains since 1916.” Web Page URL (last accessed July 7, 2008): http://www.ctj.org/pdf/regcg.pdf.
Fort, R. 2006. “The Value of Major League Baseball Ownership.” International Journal of Sport Finance 1:9–20.
Fort, R. 2008. Rodney Fort’s Sports Business Data Pages. Web Page URL (last accessed July 7, 2008): www.rodneyfort.com/SportsData/BizFrame.htm.
Global Financial Data. 2008. “CBOE 13-Week U.S. Treasury Bill Yield Index.” Web Page URL (last accessed July 7, 2008): http://www.globalfinancialdata.com/index.php3?action=Search&seriestype=Treasury_Bill_Yields&country=USA&starttime=1000&endtime=3000.
Humphreys, B.R., and Mondello, M. 2008. “Determinants of Franchise Values in North American Professional Sports Leagues: Evidence from a Hedonic Price Model.” International Journal of Sport Finance 3:98–105.
Okner, B.A. 1974. “Taxation and Sports Enterprises.” In R.G. Noll (ed.), Government and the Sports Business. Washington, D.C.: Brookings Institution, pp. 159–184.
Ozanian, M.K., Badenhausen, K., and Settimi, C. 2007. “The Business of Hockey.” Forbes Web Page URL (last accessed July 7, 2008): http://www.forbes.com/2007/11/08/nhl-teamvalues-biz-07nhl_cx_mo_kb_1108nhl_land.html.
Ozanian, M.K., and Badenhausen, K. 2008. “The Business of Baseball.” Forbes Web Page URL (last accessed July 7, 2008): http://www.forbes.com/2008/04/16/baseball-teamvalues-biz-sports-baseball08-cx_mo_kb_0416baseballintro.html.
Quirk, J., and Fort, R.D. 1992. Pay Dirt: The Business of Professional Team Sports. Princeton, NJ: Princeton University Press.
Rovell, D. 2004. “New Owners’ Tax Break Losing Value.” ESPN.com, April 15, 2004. Web Page URL (last accessed July 7, 2008): http://sports.espn.go.com/espn/sportsbusiness/news/story?id=1782953.
Veeck, B. (with E. Linn). 1962. The Hustler’s Handbook. New York, NY: G.P. Putnam’s Sons.
Wilson, D. 2004. “Bill would Raise Franchise Value of Sports Teams.” New York Times, August 2, 2004. Web Page URL (last accessed July 7, 2008): http://www.nytimes.com/2004/08/02/sports/02tax.final.html.
Discussion Questions
1. What is the likely view of public ownership by league commissioners? By existing owners?
2. Why do small investors buy shares of sports franchise stocks?
3. What are the unique characteristics of the Green Bay Packers public ownership structure?
4. Do you think public ownership of sports franchises will continue to increase?
5. How does sports franchise ownership differ from corporate ownership?
6. Is sports franchise ownership profitable?
7. Are sports franchise owners still “sportsmen”?
8. Which sports are the most profitable? Why?
9. What single factor has proven to be the most important in the “boom” of professional sports?
10. Discuss the difference in importance in winning hockey and baseball games versus football and basket ball games. What are the major reasons for this difference?
11. Is the bottom-line motivation of most owners bad for sports?
12. Bill Veeck asserted that a club’s players were depreciable assets. What would be a viable counterargument to his claim?
13. What are the potential advantages/disadvantages to owners of selling minority interests in a public offering?
14. If you were running a sports league, would you allow for public ownership of franchises (either majority or minority interest)?
15. Irrespective of whether it is good public policy, is it good for sports leagues to have myriad tax shelters available to owners? Does it free up money for owners to invest in their teams, or does it draw ownership groups that are interested in the ancillary tax benefits rather than the good of the club?
16. Is there a speculative bubble for sports franchises? What are the arguments for or against?
17. How can you determine whether an owner is a profit-maximizer or a win-maximizer, or some combination of both?
18. How do we reconcile the prolonged, substantial increase in franchise values across sports with the slim, or sometimes negative, profit margins reported by many clubs?
19. If such figures were publicly available, could you get a true picture of a franchise’s value from the club’s profit/loss statement?
20. Do you agree with the contention that selling off 49% to the public while retaining controlling interest is a (relatively) cost-free way of injecting liquidity into a club/franchise?
21. What are the potential advantages/disadvantages of selling minority interests in a public offering?