![]()
When we need to represent data or qualitative structures graphically in order to show a relationship—to make a comparison or highlight a trend—we make use of charts. A chart is a graphic structure consisting of symbols, such as lines, in a line chart; bars, in a bar chart; or slices, in a pie chart. Charts serve as valid tools that can help us discern and understand the relationships underlying large quantities of data. It is easier for humans to read graphic representations, such as a chart, than raw numeric data. Nowadays, use of charts has become common practice in a wide variety of professional fields as well as in many other aspects of daily life. For this reason, charts have come to take on many forms, depending on the stucture of the data and the phenomenon that is being highlighted. For example, if you have data separated into different groups and want to represent the percentage of each, with respect to the total, you usually display these groups of data in a pie chart or a bar chart. In contrast, if you want to show the trend of a variable over time, a line chart is typically the best choice.
In this book, you will learn how to create, draw, and adapt charts to your needs, using various technologies based on JavaScript. Before you start using JavaScript to develop charts, however, it is important that you understand the basic concepts that will be covered in the chapters of this book. In this chapter, I will provide a brief overview of these concepts.
First, I will show you how to recognize the most common elements that make up a chart. Knowledge of these elements will prove helpful, because you will find them in the form of components, variables, and objects defined within the specialized JavaScript libraries created for the realization of charts.
Next, I will present a list of the most common types of charts. The greater your knowledge of charts and their features, the easier it will be to choose the right representation for your data. Making the right choice is essential if you are to underline the relationships you want to represent, and just reading the data will not be sufficent. Only when you have become familiar with the most common types of charts will you be able to choose which is the most suitable for your purposes.
Once you have become familiar with these concepts, you will need to learn how it is possible to realize them via the Web and what the current technologies are that can help you achieve this aim. Thus, in the second part of the chapter, I will discuss these technical aspects, presenting one by one the technologies involved in the development of the examples provided in this book.
Finally, given that all our work will focus on the development of code in JavaScript, I thought it would be helpful to provide a brief description of certain types of data. Those who are not familiar with JavaScript can benefit from this quick reference source on the forms that the data will take within the code. However, I strongly recommend that the reader research in greater depth the concepts and technologies discussed in this chapter.
Elements in a Chart
As you will soon see, charts can assume a variety of forms. In a chart the data take on graphic structure through the use of symbols specific to the type of chart; there are, however, some features that are common to all charts.
Generally, every chart has a title, appearing at the top, that provides a short description of the data. Less frequently, subtitles or footnotes are used to supply additional descriptions (mostly data-related information, such as references, places, dates, and notes).
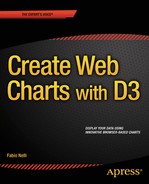
Charts often have axes—two perpendicular lines that allow the user to refer to the values of the coordinates (x, y) for each data point P(x, y), as shown in Figure 1-1. The horizontal line usually represents the x axis, and the vertical line, the y axis.
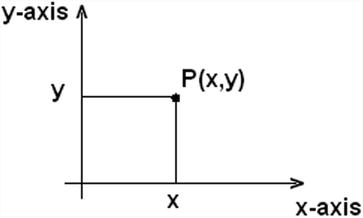
Figure 1-1. A two-dimensional chart
A scale is defined on each axis. The scale can be either numerical or categorical. Each axis is divided into segments corresponding to the particular range of values represented by the scale. The boundaries between one segment and the next are called ticks. Each tick reports the value of the scale associated with that axis. Generally, call these tick labels.
Figure 1-2 shows four axes with different scales. Axes a and b have numerical scales, with a being a linear scale, and b, a logarithmic scale. Axes c and d have categorical scales, with c being ordinal and therefore following an ascending order, whereas d is only a sequence of categories without any particular order.
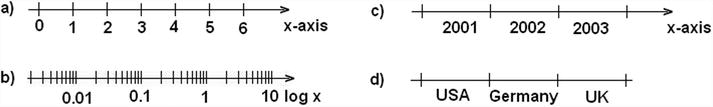
Figure 1-2. Four axes with different scales
Along with each axis, it is good practice to display a label briefly describing the dimension represented; these are called axis labels. If the scale is numerical, the label should show the units of measure in brackets. For instance, if you had an x axis reporting the timing for a set of data, you might write “time” as an axis label, with the second unit (in this case, seconds) in square brackets as [s] (see Figure 1-3).
![]()
Figure 1-3. An axis label
In the drawing area displaying the chart, a line grid may be included to aid in the visual alignment of data. Figure 1-4 shows a grid for a chart with a linear time scale on the x axis and a logarithmic scale on the y axis.

Figure 1-4. A chart with two different scales
You have seen how data can be represented symbolically. However, text labels can also be used to highlight specific data points. Point labels provide values in a chart right at the corresponding points in a chart, whereas tool tips are small frames that appear dynamically, when you pass the mouse over a given point. These two types of labels are shown in Figure 1-5.
Figure 1-5. The point label and the tooltip of a data point
Data are often grouped in several series, and in order to represent these in the same chart, they must be distinguishable. The most common approach is to assign a different color to each series. In other cases, for example, with line charts, the line stroke (dashed, dotted, and so on) can also be used to distinguish different series. Once you have established a sequence of colors (or strokes), it is necessary to add a table demonstrating the correspondence between colors and groups. This table is called the legend and is shown in Figure 1-6.
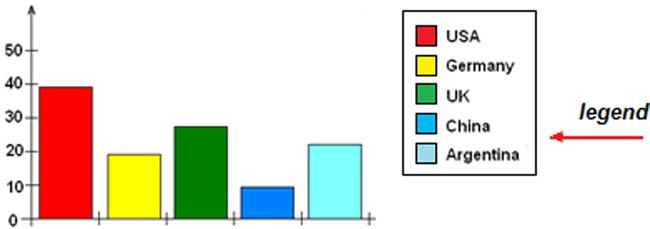
Figure 1-6. A legend
Although it may seem trivial to discuss the concepts covered in this section, it is important to define the terminology of the elements that I will be referring to throughout the book. They form the building blocks with which you will be building your charts. You will also see how JavaScript libraries specializing in the representation of charts use these terms, associating them with editing and setting components (see the section “Inserting Options” in Chapter 8).
Most Common Charts
This section contains a brief overview of the most common types of charts. These charts will each be described more thoroughly in the following chapters of the book.
- Histogram: Adjacent rectangles erected on the x axis, split into discrete intervals (bins) and with an area proportional to the frequency of the observation for that bin (see Figure 1-7).
- Bar chart: Similar in shape to a histogram, but different in essence, this is a chart with rectangular bars of a length proportional to the values they represent. Each bar identifies a group of data (see Figure 1-7).
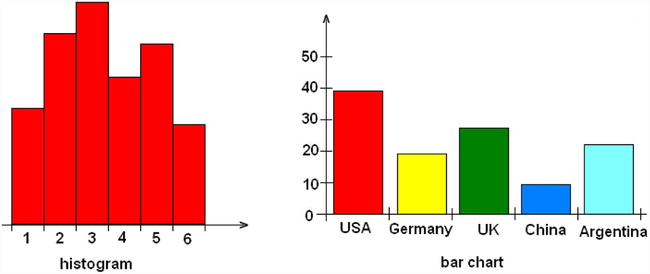
Figure 1-7. A histogram and a bar chart
- Line chart: A sequence of ordered data points connected by a line. Data points P(x, y) are reported in the chart, representing the scales of two axes, x and y (see Figure 1-8).
- Pie chart: A circle (pie) divided into segments (slices). Each slice represents a group of data, and its size is proportional to the percentage value (see Figure 1-8).
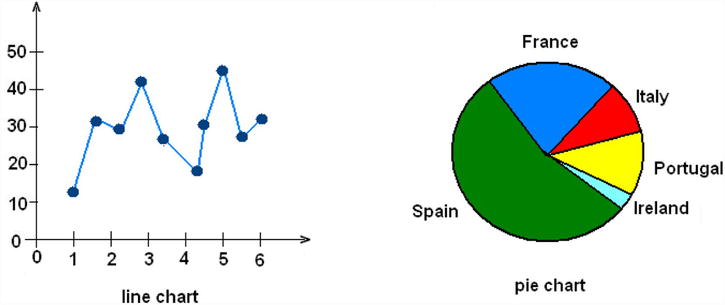
Figure 1-8. A line chart and a pie chart
- Bubble chart: A two-dimensional scatterplot in which a third variable is represented by the size of the data points (see Figure 1-9).
- Radar chart: A chart in which a series of data is represented on many axes, starting radially from a point of origin at the center of the chart. This chart often takes on the appearance of a spiderweb (see Figure 1-9).
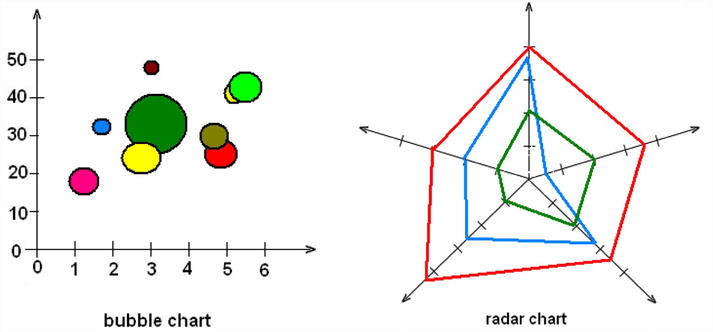
Figure 1-9. A bubble chart and a radar chart
- Candlestick chart: A type of chart specifically used to describe price trends over time. Each data point consists of four values, generally known as open-high-low-close (OHLC) values, and assumes a shape resembling a candlestick (see Figure 1-10).
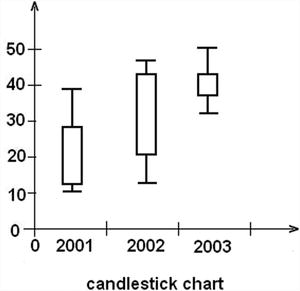
Figure 1-10. A candlestick chart
![]() Note Open-high-low-close (OHLC) are four numeric values typically used to illustrate movement in the price of a financial instrument over time.
Note Open-high-low-close (OHLC) are four numeric values typically used to illustrate movement in the price of a financial instrument over time.
How to Realize Charts on the Web
Now that I have described the most common types of charts and the elements that compose them, the next step is to take a quick look at the technologies available today that will allow you to realize your chart.
Nowadays, web technologies are in constant flux: each day, new solutions are proposed, solving problems that only a short time ago would have proven to be quite complex. These innovations will afford you the possibility to realize highly interactive charts, with eye-catching graphics, all by writing only a few lines of JavaScript code. The whole thing can be done fast and easily, as most of the work is done for you, by the JavaScript libraries, which are highly specialized in chart representation. These libraries are now to be found all over the network.
In this book, you will work with the D3 library, which is currently the most widely used library and which can provide general solutions to practically any problem that may arise in the process of chart realization.
But, before stepping through theis library (which you will do in later chapters), you must first survey all the technologies that constitute the basis for chart development in JavaScript, as these will accompany you throughout the rest of the book.
Recently, there has been a lot of talk about HTML5, which is practically revolutionizing the way in which web applications are developed. Before its advent, if you wanted to introduce interactive graphical content, the use of applications such as Adobe Flash was pretty much the obligatory path. But, dealing with Flash or similar applications for developing charts or other graphic representations on the Web involves an obvious limitation: dependency on a plug-in, to be installed on the end user’s machine. In addition, these kinds of applications are not supported on smartphones. Thanks to HTML5, developers can now create advanced graphics and animation without relying on Flash.
As you read through this book, you will see how HTML5 has also led to the birth of many other technologies, some new, others old but renewed, such as JavaScript. In fact, as a language, JavaScript is experiencing a rebirth, as a result of the new libraries developed precicely to take advantage of the innovations introduced by HTML5. HTML5 has many new syntactical features, including the <canvas> elements and the integration of scalar vector graphics (SVG) content. Owing to these elements, it will be very easy to integrate multimedia and graphical content on the Web without using Flash.
In Flash’s place, you will be using the D3 library. Currently, this is the most widespread and complete library available for the realization tasks such as the graphic visualization of data. The world of web technologies is constantly evolving, however; on the Internet, you can always find new libraries, with characteristics similar to the D3 library.
Among all the possible graphic applications that can be implemented with the new technologies introduced by HTML5, I will focus on the representation and visualization of data through charts. Using JavaScript as a programming language, we can now take advantage of the powerful rendering engines embedded in new browsers. As the basis of the new capabilities of this language, I will refer to the HTML5 canvas and SVG. Instead of drawing static images on the server and then downloading them into the browser, SVG and canvas allow you to develop fully interactive charts and thus to enrich your graphic representations with built-in animation, transitions, and tool tips. This is because SVG and canvas content is drawn in the browser, and so the graphic elements that make up the chart can be transformed without refreshing the page. This feature is essential for visualizing real-time data, which require that the chart be continually updated, as the data change. Operating in this way will ensure a true client-side charting. In fact, by making use of these technologies, charts are actually drawn on the client and only require that the data be passed from the server. This aspect affords a considerable number of advantages, the foremost being elimination of the need for large graphics files to be downloaded from the server.
Canvas vs SVG
Both HTML5 canvas and SVG are web technologies that allow you to create rich graphics in the browser, but they are fundamentally different. Throughout this text, you will see mainly how D3 makes use of the SVG technology. Other libraries similar to D3 (i.e. jqPlot and Highcharts), instead, make use of the HTML5 <canvas> element to draw its charts. In contrast, D3 does not make use of canvas; it relies on SVG technology for graphic representations.
SVG is an XML-based vector graphic format. SVG content can be static, dynamic, interactive, or animated, which makes it very flexible. You can also style the SVG elements with Cascading Style Sheets (CSS) and add dynamic behavior to them, using the application programming interface (API) methods provided by the SVG document object model (DOM). In choosing this format, you can, therefore, obtain much more than simple vector graphics and animation: you can develop highly interactive web applications, with scripting, advanced animation, events, filters, and almost anything else your imagination might suggest.
The HTML5 canvas specification is a versatile JavaScript API, allowing you to code programmatic drawing operations. Canvas, by itself, lets you define a canvas context object, shown as a <canvas> element on your HTML page. This element can then be drawn inside, using either a two-dimensional or three-dimensional drawing context, with Web Graphics Library (WebGL).
The advantages of canvas, compared with SVG, are high drawing performance and faster graphics and image editing. Whenever it is necessary to work at the pixel level, canvas is preferable. However, with canvas, not having DOM nodes on which to work can be a disadvantage, especially if you do not use a JavaScript framework. Another disadvantage is poor text-rendering capabilities.
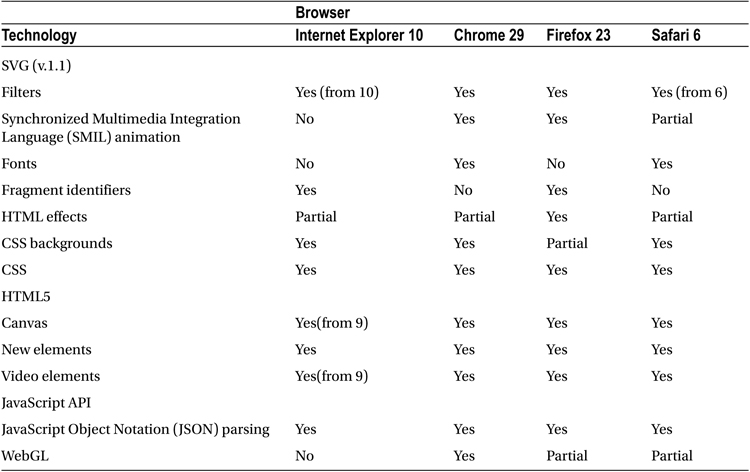
The advantages of SVG, compared with canvas, are resolution independence, good support for animation, and the ability to animate elements, using a declarative syntax.Most important, though, is having full control over each element, using the SVG DOM API in JavaScript. Yet, when complexity increases, slow rendering can be a problem, but browser providers are working hard to make browsers faster (see Tables 1-1 and 1-2).
Table 1-1. Web Browsers and Engines
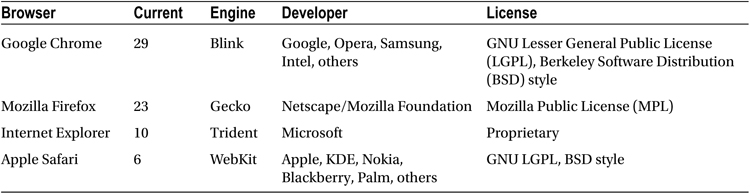
Table 1-2. Web Technology Support: Comparison of Web Browsers
Working with libraries that act at the level of the structural elements of an HTML page, we cannot avoid talking about the DOM. I will be referring to this concept often, as it is the basic structure underlying every web page. The World Wide Web Consortium (W3C) felt the need, and rightly so, to create an official standard for the representation of structured documents, so as to develop guidelines for all programming languages and platforms.The tree structure of HTML documents, as well as those of XML, follows the guidelines developed by this standard perfectly. Following is an example of an HTML document:
<HTML>
    <HEAD>
      <TITLE>A title</TITLE>
    </HEAD>
    <BODY>
      Hello
      <BR>
    </BODY>
</HTML>
The DOM tree of this document can be represented as shown in Figure 1-11.
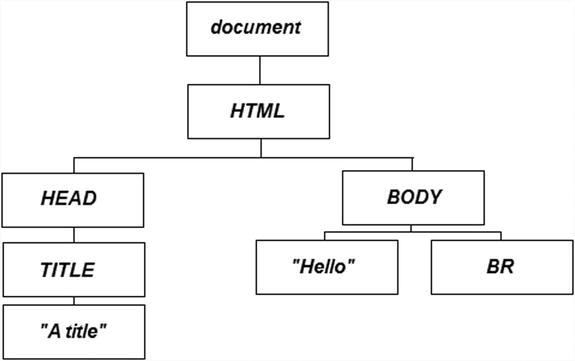
Figure 1-11. An example of tree structure of the DOM
But, the DOM standard is not limited to developing guidelines on how the DOM should be structured in a document; the standard also defines a number of features designed to act on the elements that compose a document. Thus, any action pertaining to a document (creating, inserting, deleting) should follow the DOM standard. As a result, regardless of the programming language that you are using or the platform on which you are working, you will always find the same functionality expressed by this standard. Often, the term DOM also applies to the API, which manages all the elements of a web page.
All this is important, because anyone choosing to read this book is interested in developing charts that not only use the DOM, but that are also part of it and whose every aspect can be inspected and manipulated in JavaScript. Throughout the book, you will learn how to make the best use of the D3 library. Thanks to this JavaScript library, you can access every chart element, such as changing the color and position of objects.
Although it is likely that most people who have chosen to read this book already have a good knowledge of JavaScript, this may not in fact be the case. For this reason, I have structured the book in a practical way, giving step-by-step examples and providing all the code that must be written in the examples. As such, this book offers newcomers an opportunity to study the language and those who have not used it for some time a chance to refresh their memories.
To start working with the JavaScript libraries that you will be using to develop your charts, it is necessary to prepare a development environment. It is true that to develop JavaScript code, you could simply use a text editor, such as Notepad (or, even better, Notepad++), but developers generally prefer to use specialized applications, usually called integrated development enviroments (IDEs), to develop code. As well as providing a text editor with differentiated colors corresponding to the keywords used in the code, such applications also contain a set of tools designed to facilitate the work. These applications can check if there are any errors in the code, supply debugging tools, make it easy to manage files, and assist in deployment on the server, among many other operations.
Nowadays, there are many JavaScript IDEs on the network, but some of the most prominent are Aptana Studio (see Figure 1-12); Eclipse Web Developer, with the JavaScript test driver (JSTD) plug-in installed; and NetBeans. These editors also allow you to develop Hypertext Preprocessor (PHP), CSS, and HTML (for information on how to use the Aptana Studio IDE to set up a workspace in which to implement the code for this book, see Appendix A, or use the source code accompanying the book directly; you can find the code samples in the Source Code/Download area of the Apress web site [www.apress.com]).
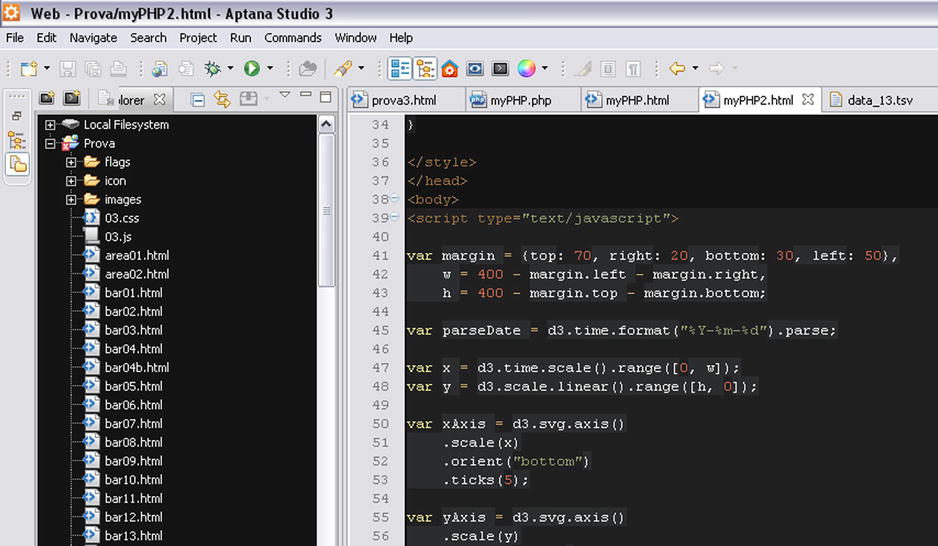
Figure 1-12. The Aptana Studio 3 IDE
For those who prefer not to install too many applications on their computer, there are online JavaScript IDEs. These allow users to edit JavaScript code in a web page working as an IDE and to check their result directly from the same web page. Unfortunately, many of these IDEs charge a fee. However, jsFiddle (http://jsfiddle.net) is an online IDE that requires no payment and that, in addition to editing, provides code sharing and the option of adding libraries, such as jQuery and D3.(see Figure 1-13).

Figure 1-13. The online IDE jsFiddle
jsFiddle can prove very useful. As well as letting the user include many JavaScript libraries (see Figure 1-14), it offers the respective different versions released, thus allowing him or her to test any incompatibilities in real time.
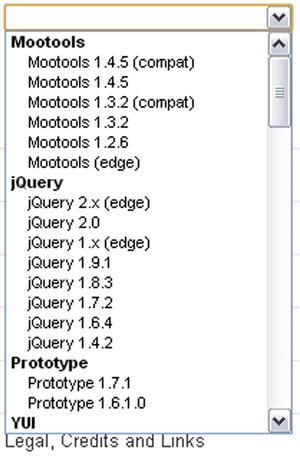
Figure 1-14. jsFiddle offers a set of the most popular JavaScript libraries
Running and Debugging JavaScript
JavaScript, if we want to define it in a client–server framework, is a completely client-side programming language. It is not subject to compilation, and parts of the code, apart from HTML documents, can be found in many other types of files that are specific to other languages, such as .JSP or .PHP.
These code fragments pass unaffected through the application servers without ever being processed. Only the browser is responsible for running the JavaScript code. Therefore, JavaScript code is run only when a web page is downloaded or afterward, in response to an event. If the JavaScript code is of a considerable size or might be useful subsequently, it can be defined externally in a .JS file; here, you will find all the JavaScript libraries and frameworks that will be mentioned throughout this text. Regardless of its form, however, JavaScript runs directly from the browser.
So, even if you do not use a real IDE for the development and debugging of JavaScript code, you can simply insert the code in an empty HTML file and then load this file directly in a browser (Chrome, Internet Explorer, and Firefox are the most common). To distinguish it from the rest of the text on the page, you must separate the code by putting it inside the <script></scripts> tags:
<script type="text/javascript">
// JavaScript code
</script>
If the JavaScript code resides in an external file, then it will be necessary to include it in the HTML page, writing
<script type="text/javascript" src="library.js"></script>
Therefore, as long as the execution of JavaScript is not required for the purpose of installing something, you have everything you need. Who does not have a web browser on his or her operating system?
Data Types in JavaScript
As mentioned earlier, this book will neither explain the rules and syntax for the programming of good JavaScript code nor will it linger too long on programming details. Nevertheless, the code that we are going to develop is centered on charts, or rather the processing of data and how to display them. Let us start with the simplest case. The smallest building block of all data structures is the variable (when it contains a single value). In handling the types of data, JavaScript is very different from other programming languages. , You do not have to specify the type of value (int, string, float, boolean, and so on) when you want to store JavaScript in a variable; you need only define it with the var keyword.
In Java or C a variable containing an integer value is declared differently from one containing a text:
int value = 3;
String text = "This is a string value";
In JavaScript the type of stored value does not matter. Everything is declared with var, so the same declarations are
var value = 3;
var text = "This is a string value";
Thus, in JavaScript we can think of variables as containers for storing any type of value.
For the sake of simplicity, here the variables are seen as containers of a single value, thus representing the simplest data structure. Actually, however, variables may also contain types of data that are more complex: arrays and objects.
![]() Note The use of variables in JavaScript is actually a bit more complicated. You can also use a variable without ever declaring it with the var keyword. The var keyword will declare the variable within the current scope. If var is missing, JavaScript will search for a variable with the same name declared at an upper level of scope. If JavaScript does not find this variable, a new one is declared; otherwise, JavaScript will use the values in the variable found. As a result, an incorrect use of variables can sometimes lead to errors that are difficult to detect.
Note The use of variables in JavaScript is actually a bit more complicated. You can also use a variable without ever declaring it with the var keyword. The var keyword will declare the variable within the current scope. If var is missing, JavaScript will search for a variable with the same name declared at an upper level of scope. If JavaScript does not find this variable, a new one is declared; otherwise, JavaScript will use the values in the variable found. As a result, an incorrect use of variables can sometimes lead to errors that are difficult to detect.
Arrays
An array is a sequence of values separated by a comma and enclosed in square brackets [ ]:
var array = [ 1, 6, 3, 8, 2, 4 ];
Arrays are the simplest and most widely used data structure in JavaScript, so you should become very familiar with them. It is possible to access any value in an array by specifying its index (position in the array) in the brackets, immediately following the name of the array. In JavaScript the indexes start from 0:
array[3] //returns 8
Arrays can contain any type of data, not just integers:
var fruits = [ "banana", "apple", "peach" ];
There are a many functions that can help us handle this kind of object. Because of its usefulness, I will be using this object frequently throughout the book, and it therefore seems proper to give it a quick look.
It is possible to know the number of the values in an array by writing
fruits.length //returns 3
Or, if you know the values, you can get the corresponding index with
fruits.indexOf("apple") //returns 1
Moreover, there is a set of functions that allow us to add and remove items in an array. push() and pop() functions add and remove the last element in an array, whereas shift() and unshift() functions add and remove the first element in an array:
fruits.push("strawberry");
// Now the array is ["banana", "apple", "peach", "strawberry"];
fruits.pop();   //returns "strawberry"
// Now the array is ["banana", "apple", "peach"];
fruits.unshift("orange", "pear");
// Now the array is ["orange", "pear", "banana", "apple", "peach"];
fruits.shift(); //returns "orange"
// Now the array is ["pear", "banana", "apple", "peach"];
Sometimes, it is necessary to make a loop through every value in an array in order to perform some action with it. An approach that is widely used in other programming languages is the use of the function for(). For example, to calculate the sum of the values in an array, you would write
var sum = 0;
for (var i = 0; i < array.length; i++) {
    sum += array[i];
}
But, in JavaScript it is more common to use the forEach() function, where d assumes the values in the array, one by one, following the sequence:
var sum = 0;
array.forEach(function(d) {
     sum += d;
});
Arrays are useful for simple lists of values, but if you want structured data, you need to define an object. An object is a custom data structure whose properties and values you define. You can define an object by enclosing its properties between two curly brackets { }; every property is defined by a name followed by a colon (:) and the assigned value, and commas separate each property/value pair:
var animal = {
    species: "lion",
    class: "mammalia",
    order: "carnivora",
    extinct: false,
    number: 123456
};
In JavaScript code, dot notation refers to each value, specifying the name of the property:
animal.species //Returns "lion"
Now that you have learned about both objects and arrays, you can see how it is possible to combine them in order to get more complex data structures in JavaScript. You can create arrays of objects or objects of arrays, or even objects of objects. Square brackets are used to indicate an array, curly brackets, an object. For example, let us define an array of objects in this way:
var animals = [
    {
        species: "lion",
        class: "mammalia",
        order: "carnivora",
        extinct: false,
        number: 123456
    },
    {
        species: "gorilla",
        class: "mammalia",
        order: "primates",
        extinct: false,
        number: 555234
    },
    {
        species: "octopus",
        class: "cephalopoda",
        order: "octopoda",
        extinct: false,
        number: 333421
    }
];
To get the values of these data structures, you need to use both the square brackets with the index and the name of the property:
animals[0].extinct //return false
animals[2].species //return "octopus"
To debug, if you are using an IDE, you can easily make use of the various debugging tools that are included with it. If you do not have access to an IDE, however, you can still avail yourself of external tools. Think of the browser as a development environment, where debugging tools can be integrated through plug-ins that are downloadable from Internet. There are many tools currently available on the Internet, but the one I want to propose is Firebug, a web development tool for those who prefer to use the browser Mozilla Firefox. Firebug is an add-in that integrates seamlessly into the Firefox browser, as demonstrated in Figure 1-15.
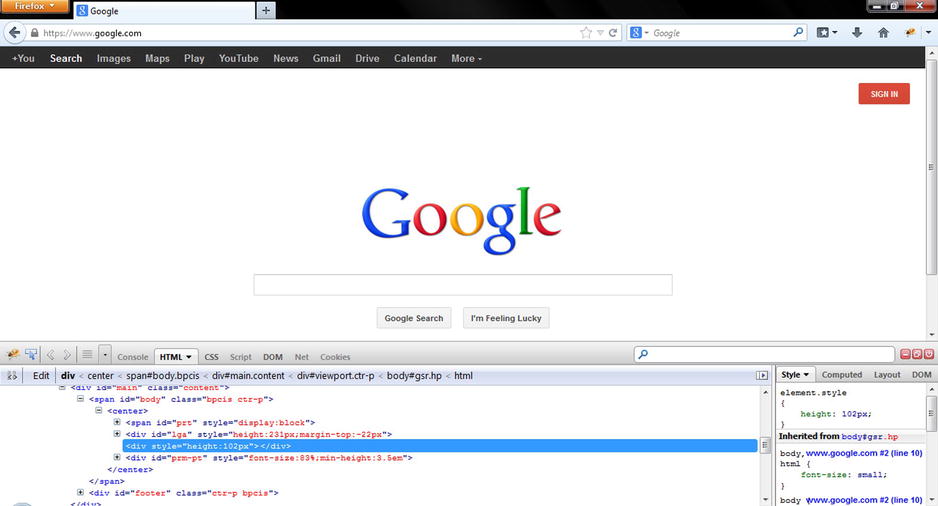
Figure 1-15. Firebug is an extention of Mozilla Firefox and is fully integrated into the browser
Firebug will prove a very useful tool throughout, especially when using use the jQuery and D3 libraries, which require that the structure of the DOM always be kept under control. This tool will allow you to monitor the structure of the DOM directly.
For those who prefer to use Google Chrome, however, there is DevTools, which is already integrated into the browser (see Figure 1-16). To access this tool, simply click the button at the top-right corner of the browser.
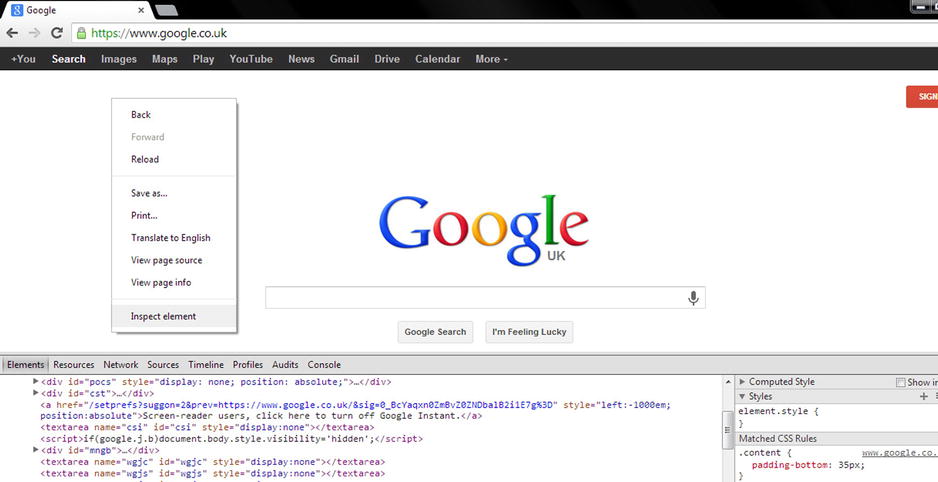
Figure 1-16. With DevTools it is possible to monitor a lot of information about your web page
Next, select Tools ![]() Developer Tools, or simply right-click any page element, and then select Inspect element in the context menu.
Developer Tools, or simply right-click any page element, and then select Inspect element in the context menu.
With these two tools, you can easily inspect not only each element of the DOM—its attributes and their values—but also the CSS styles applied to them. You can also input changes to these values to observe the effects in real time without having to modify the code on file and save it every time. Firebug and DevTools also include various tools for monitoring the performance of the page, for both rendering and networking.
With DevTools, particular attention should be paid to the use of the console as well. Through it, you can access diagnostic information, using methods such as console.log(). This method is frequently used to display the values of many variables through the console, passing the name of the variable as an argument, with the addition of text as an indication:
var x = 3;
console.log("The value of x is " + x); // The value of x is 3
It is also possible to enter commands and perform interactions with the document, using methods such as $() or profile(). For further information on these methods, see the documentation regarding the Console API (https://developers.google.com/chrome-developer-tools/docs/console-api) and the Command Line API (https://developers.google.com/chrome-developer-tools/docs/commandline-api).
JSON is a specific syntax for organizing data as JavaScript objects. This format is generally used in browser-based code, especially in JavaScript. JSON represents a valid alternative to XML for organizing data. Both are independent from the programming language, but JSON is faster and easier to parse with JavaScript than XML, which is a full-markup language. Moreover, D3 works well with JSON. Its structure follows perfectly the rules that we have seen for objects and arrays defined in JavaScript:
var company = {
    "name": "Elusive Dinamics",
    "location": "France",
    "sites": 2,
    "employees": 234,
    "updated": true
};
Summary
This first chapter has introduced you to many of the fundamental concepts that will accompany you throughout the book. First, you examined the most common types of charts and the elements that compose them. You also took a quick look at many of the technical aspects you need to know when setting about developing a chart on the Web. Finally, you briefly explored the types of data used in the JavaScript examples in this book.
I mentioned that the majority of your work will be done by a specialized JavaScript library. The next chapter will cover the highlights of the D3 library. Through a series of examples, you will see how to manipulate DOM elements by changing their attributes, and by creating new ones when needed. In the second part of the chapter, you will learn what the main object of manipulations with the D3 library is: SVG elements.