
Total Productive Maintenance Through Visible Control
The first industrial revolution liberated human beings and domestic animals from burdensome physical labor. … countries around the world are facing a second industrial revolution, one goal of which is to free human beings from monotonous and repetitive manual work …
This second industrial revolution … was … triggered by severe competition, primarily among Japanese manufacturers producing small pocket calculators. The subsequent explosion of the demand for semi-conductors resulted in the rapid progress of relevant technologies and the spread of microelectronic consumer goods …
This same trend makes it possible for manufacturers to apply micro-electronic technologies, such as sophisticated sensors, microcomputers, numerical controls … etc. … In keeping with this development, Japanese manufacturers, including large companies and more serous small organizations … are applying automation to repetitive manual work …
—Tajiri and Gotoh (1992, p. xv)
The single reason why the implementation of a JIT system is so difficult relates to the significant difficulty in achieving Zero Defects. …
In order to achieve Zero Defects, Zero Breakdowns must be realized as an absolute prerequisite. Zero Accidents, in turn, are not attainable without Zero Breakdowns and Zero Defects. … Herein lies the reason why Japanese automobile manufacturers and their parts suppliers are developing TPM activities.
—Tajiri and Gotoh (1992, p. xvii)
Maintenance actions can be classified by whether they are reactive or proactive. Reactive maintenance responds to the breakdowns after they have occurred, which is too late to prevent capacity losses. Proactive maintenance seeks to avoid losses through preventive maintenance activities (e.g., think of changing the oil and the filters on your car). Predictive maintenance—an important part of proactive maintenance actions—makes the status of the components of machines visible in order to predict when they will need to be repaired (e.g., a clean, white floor under a machine will show any oil leaks, and a vibration sensor on the machine will indicate when a bearing is failing). Thus predictive maintenance is talking to the parts. Predictive and proactive maintenance help avoid capacity losses. Another question is who will perform the proactive activities. To make proactive activities more affordable, many are assigned to the equipment operator. While this requires empowerment of the worker to do the task it allows for assessing the worker’s tacit knowledge about the machine. The process of doing this is typically included within a program called Total Productive Maintenance (TPM).
TPM is essential when there is equipment within the operating system. Lean operations cannot perform well if there are equipment break-downs. Remember, that variance introduces problems into a process, which hurts both productivity and quality. TPM changes the roles of the machine operators, maintenance technicians, engineers, and front-line managers in order to eliminate variance that results from inadequate—in term of timeliness and size of response—maintenance.
The Big Six Losses: The capacity that a firm is purchasing when it purchases equipment and machines can be lost if the firm does not maintain the equipment and machines. To help visualize and reduce these losses, they are often classified into three categories with two losses in each category—The BIG SIX losses! The BIG SIX are:
Downtime Losses
- Breakdown losses
- Setup and adjustment losses
- Minor stoppage losses
- Speed losses
Quality Losses
- Quality defect and rework losses
- Start-up and yield losses
These losses can be found everywhere—Figure 2.1!
Downtime losses reduce the availability of the equipment. Downtime losses consist of both breakdown losses and setup and adjustment losses. The breakdown loss is the most obvious of the SIX BIG losses, because the machine cannot function until it is repaired. Maintenance is often trained to respond to breakdowns as a top priority and to get the machine up and running again as soon as possible because of scheduled due dates and so on. While getting the machine running again as soon as possible is important, one should not forget to analyze the cause of the breakdown to proactively avoid it the next time.
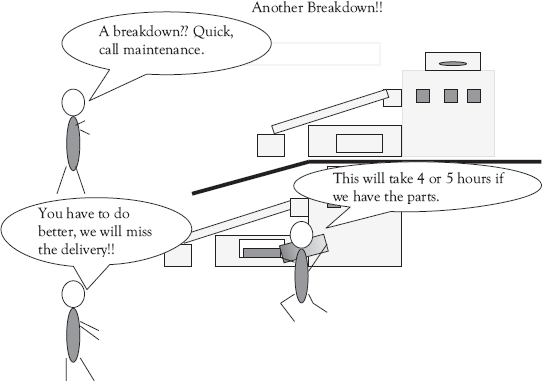
Figure 2.1 A typical workplace?: Another breakdown!!!
Supervisor never had time to make improvements or do preventative maintenance on their lines … they had to spend all their time just trying to keep the line going, but this meant it was always in a state of flux, which in turn, caused them to want to hold lots of protective inventory, because everything was so unpredictable. A quality problem might not be discovered until we had produced a pile of defective parts. This of course meant we didn’t have time to figure out why the problem happened in the first place, since we were now really behind our production schedule. It was a kind of snowball effect that just kept getting worse. (Repenning and Sterman 2001, p. 71)
The equipment setup and adjustment losses are also considered to be downtime losses, because the machine is not producing as it switches from producing one product to another. Often after these switches or setups there are minor adjustments that have to be made to ensure the machine is producing a good product.
Example: In a factory producing gears, as a machine is switched from producing one size gear to another size gear, a press that affects the size of the gear teeth has to be adjusted for each size of gear. The time to replace the dies used for one size may take 15 minutes. To ensure that it is correctly placed the operator may produce one gear and carry it to the quality control office where it is checked against standards to ensure it meets specifications. This may take 20 minutes and then adjustments based on the feedback from the quality control office may take another 10 minutes. So the total time for setup and adjustments is 45 minutes. During this time, the machine is not producing any product.
The second group of losses affects the performance rate of the machine when it is actually running and producing parts. These two speed losses are minor stoppage losses (which includes idling) and reduced speed losses. One example of idling and minor stoppage losses occurs during the operation of the machine when the machine has to be paused to clean debris away from the surface or to remove debris from a waste chute. Another example could occur when the operator notices a loose bolt or wire and pauses the machine while this is adjusted. The speed losses occur when the machine is operated at a lower speed to ensure that the quality is good or to prevent a machine breakdown. For example, if a lathe is supposed to turn at 5,000 RPM but the machine operator was instructed to operate at 3,000 RPM because the output at 5,000 RPM did not meet specifications, there would be a speed loss of 2,000 RPM.
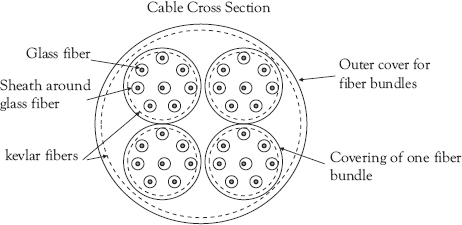
Example: A machine gathers four small fiber bundles, combines them with Kevlar fiber, and then puts an outer cover onto a bundle of fiber optic cables. (See figure below). This cable needs the Kevlar fibers to have the strength to be strung between transmission towers. The machine should cover 100 m of fiber an hour. If the operator has to stop once every 5 minutes to adjust the feed of the Kevlar fibers into the bundle, because they are getting stuck in the feed chute, the idling, while this adjustment is made, is a minor stoppage. If the supervisor instructs the machine operator to reduce the rate of production from 100 m an hour to 80 m an hour so that the wrapping with Kevlar fibers will be more uniform, this loss of 20 m an hour is a speed loss.
The third group of losses is the quality losses. This consists of losses due to quality defects, rework losses, and start-up yield losses. When a process produces bad parts there is a loss if these parts are thrown away. In the example above of gear production, if a gear that is produced does not have the correct angle on the gear tooth, then it will be scrapped as unusable and the cost is a quality defect loss. Not only is there a cost of the material that is being thrown away, the loss also includes the lost output of the machine. If a gear that is produced has the correct angle on it, but the surface is bundle blemished, it may be possible to rework it and eliminate the blemish. The need to rework creates a cost of labor and machine time to do it again. The start-up yield losses are also considered quality losses. It refers to the products, which do not meet quality specifications and were produced between the last good preceding product and the first good new product when changing over a machine and are mainly due to fine tuning requirements. For example, when producing fibers to be used in rug production, there is a start-up loss when the machine is starting because the machine may not be at the correct temperature and some fiber being extruded and then spun may be too cold and so it does not reach the correct diameter. Consequently, it may have to be sold as seconds, so the firm suffers a yield loss.
Example: At the Eis-Sahne Ice Cream Shop, if the counter clerk who takes an order records it wrong, there will either be a quality defect or a rework loss. An order for: “double scoop of chocolate in a waffle cone with gummy bears on top” written as: “double scoop of vanilla in a cup with chocolate pieces on top” will be a quality defect, if it is produced and rejected by the customer. If the clerk reads it back to the customer first and discovers the problem, then the time to rework the order slip will be a rework loss. If the chocolate ice cream has to come out of a brand new 20 gallon tub of ice cream, and the worker cannot get it open easily and so the top is cut off with a large knife, which also takes out one or two scoops of ice cream that is thrown into the trash along with the top, then this lost yield (i.e., two scoops of ice cream) is a start-up yield loss.
Overall Equipment Effectiveness
It should indeed be an invariable practice to supply managers with clear and common measurements in all key areas of a business. These measurements need not be rigidly quantitative; nor need they be exact. But they have to be clear, simple and rational. They have to be relevant and direct attention and efforts where they should go. (Drucker 1954, p. 131)
Overall equipment effectiveness (OEE) is a measure of the health of the equipment. It provides managers, and all employees involved, who use the equipment, with a clear metric to measure the health of their equipment. To measure OEE in a meaningful way, all the different losses have to be recorded in the same units. To do this, they are all converted to rates and multiplied together (see Figure 2.2).
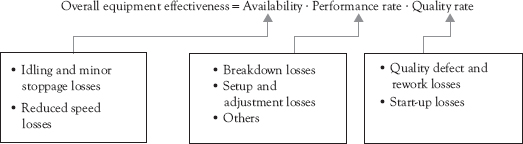
Figure 2.2 Overall equipment effectiveness
The downtime losses are converted to rates by subtracting the recorded downtime from the scheduled time available and then dividing by the scheduling time available. For example, if a machine was scheduled to be available 420 minutes (i.e., its scheduled loading time was 420 minutes) during a 480 minute day and the downtime losses were 30 minutes, the availability of the machine was 390 minutes = 420 − 30 minutes. Dividing this difference by 420, we have (420 − 30)/ (420) = 0.929, converting the availability into a proportion. To convert the speed losses into a proportion, the performance rate is calculated using the net operation time found by subtracting the downtime losses from scheduled available time. In the example above this would be 390 minutes. If in this example the machine should produce one part every 10 minutes, but because it had minor stoppage losses and operated at a throughput rate lower than the recommended one, the machine only produced 25 parts. So the performance rate is (10 minutes/part × 25 parts)/390 minutes = 0.641. If the raw material yield was 100 percent, but one part had to be reworked, the total yield rate or quality rate is (25 − 1)/25 = 0.96. The OEE is the product of these three terms— availability, performance rate, and total yield. In this example, OEE = 0.929 × 0.641 × 0.96 = 0.572 (57.2%). This means 40 percent of the machine’s capacity was lost.
By measuring OEE as the product of the three terms it is clear that all of the terms have to be at a high level of reliability for the OEE to be high. For example, if each is at 90 percent, then the product is
0.9 × 0.9 × 0.9 = 0.729 or 73%
If two of the measures are at 95 percent and one is at 80 percent, the product is
0.95 × 0.95 × 0.8 = 0.722 or 72%
The reason for introducing TPM and using the OEE measure to drive improvement is to first eliminate the costs of breakdowns and second to reduce the other chronic costs, such as speed losses that are in the system. This is illustrated in Figure 2.3.
In Figure 2.3 there are three major costs. First, there is the ongoing cost of the maintenance department, which is a budgeted cost. Second, there is the cost of overtime worked by the department in order to return critical machines to production. Third, there are the chronic or hidden costs of capacity due to performance rate and quality rate losses.
TPM aims at improving existing plant conditions and at increasing the knowledge and skills of frontline personnel in order to achieve Zero Accidents, Zero Defects, and Zero Breakdowns. In all factories of any country, all problems recurring on the manufacturing shopfloor result from the insufficient technical expertise of and the inadequate routine supervision by frontline managers and engineers. (Tajiri and Gotoh 1992, p. xix)
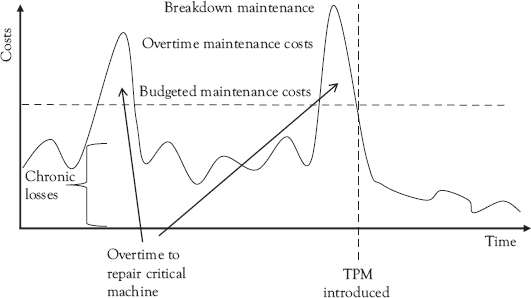
Figure 2.3 Maintenance costs
Teams for Total Productive Maintenance
To implement TPM, companies may initially start to measure OEE regularly on the key equipment. Then they need to create a structure so that the tasks needed to achieve improvement are accomplished. Both cross-functional and self-directed work teams may have to be assigned tasks to make improvements. The self-directed work teams can assume responsibility for performing maintenance tasks that are appropriate for the operators’ skill level and for obtaining training to improve the operators’ skill level. The purpose of the cross-functional teams is to bring in horizontal knowledge and to coordinate goals across departments so that improvement does not disintegrate into one department fighting another department.
The self-directed work teams are assigned the simpler TPM maintenance activities. The operators are in a position to detect minor equipment problems before the maintenance technicians or the engineers. The machine operators need to be trained to recognize sounds, smells, and vibrations as symptoms of problems, and they need to have a means of having reliable communication with the maintenance technicians. By involving the machine operators in the simple maintenance tasks, such as lubrication, cleaning, and checking the settings, the machine operator becomes more aware of the machine and more invested in caring for the machine. This ensures that machine reliability becomes “our” job and not “their” job.
… supervisors who defer preventive maintenance often experience a “grace period” in which they reap the benefits of increased output (by avoiding scheduled downtime) and save on maintenance costs. Only later, as equipment ages and wears do they begin to experience lower yields and lower uptimes …. (Repenning and Sterman 2001, p. 72)
The TPM team needs to set standards so that the technicians know “what should be” the performance level of each machine component. As new components wear over time, what is the acceptable deterioration limit? When will wear in a component lead to minor defects? While minor defects may not in themselves seem to do any harm and so the technician may choose to not repair them, minor defects actually do hurt machine performance. An accumulation of minor defects can actually become a primary cause of machine failures.
The TPM team shares this information about minor defects and establishes the standards. The first step for each TPM team with a machine is to study it by cleaning it (this may be integrated as part of a 5S project as discussed in Chapter 1). This removes the contamination and reduces machine wear and it also ensures that the machine components are carefully inspected by the team members. This engages all the team members’ senses as they feel the part even as they visually inspect it.
An organizational communication tool has to be created to share information across all of the workers on different shifts and with different responsibilities. This creates a structure that ensures that the required maintenance actions take place. This structure must identify the role of the machine operator and the maintenance technician in preventing losses. An example is given in Table 2.1.
This checklist (which is a form for structured communication) is very similar to the checklist that car manufacturers give to everyone purchasing their car to help maintain the car. The checklist establishes the operator’s role in the daily cleaning of the machine, which complements the 5S program discussed earlier.
The checklist also includes regular checking of the fluids and other operating parameters of the machine such as the temperature (Table 2.2). The checklist also has room for the operator to list any strange sounds or smells or other abnormal events providing a communication channel for the worker from the shop floor to the management. The maintenance department retains responsibility for the readiness of the machines. Maintenance does this through the routine application of the preventive maintenance activities and through the use of predictive maintenance capabilities.
Table 2.1 Operator maintenance checklist
Machine: Cable sheathing maintenance instructions for machine operators |
1. Preparation step |
a. What to turn off? b. What to close? |
2. Accessing areas within the machine |
|
3. Completing tasks to return machine to operation |
|
TPM Checklist for machine |
||||
Item |
Description |
Specifications |
Part numbers |
Reference |
1 |
Check all lubrication points |
Pump until grease visible at joint, clean |
N.A. |
See machine diagram for locations |
2 |
Check hydraulic fluid levels |
AT or above normal operating range |
N.A. |
See machine diagram for locations |
Problem solving in maintenance is conducted the same way that it is in total quality management. This is discussed later in the book. There is a clear link between 5S from Chapter 1 and TPM. You will remember your mother not only telling you to clean and order your room but also to maintain your books and so on. As for 5S, TPM also requires an investment in time and capacity to implement and maintain it. Yet again, as for 5S, benefits should more than offset this investment for three reasons.
- First, increasing the OEE increases the average available capacity, which allows for more throughput.
- Second, TPM reduces the variance introduced by unforeseen machine stoppages.
- Third, TPM prolongs the lifetime of the equipment, which reduces equipment investment cost.
Just as with 5S, there needs to be infrastructure support. Typically, there is a steering committee or a TPM management team. To maintain TPM, the team needs to arrange regular audits and measure TPM performance. This includes not only radar charts such as those found in the 5S chapter but also Pareto diagrams to identify the reasons for machine capacity loss. The OEE measurement is the key measurement to check whether improvement is being made and sustained over time.
Summarizing, 5S and TPM should go hand in hand. Both provide important tools to reduce the variance in the system and thus to improve performance.
References
Drucker, P.F. 1954. The Practice of Management. New York: Harper.
Repenning, N.P., and J.D. Sterman. 2001. “Nobody Ever Gets Credit for Fixing a Problem that Never Happened.” California Management Review 43, no. 4, pp. 64–88.
Tajiri, M., and F. Gotoh. 1992. TPM Implementation: A Japanese Approach. 1st ed. New York: McGraw-Hill, Inc.