
The Expectation-Maximization (EM) algorithm is a probabilistic approach for determining a clustering model that fits the supplied training data. This algorithm determines the Maximum Likelihood Estimate (MLE) of the parameters of a formulated clustering model (for more information, refer to Maximum likelihood theory and applications for distributions generated when observing a function of an exponential family variable).
Suppose we want to determine the probability of a coin toss being a head or a tail. If we flip the coin ![]() times, we end up with
times, we end up with ![]() occurrences of heads and
occurrences of heads and ![]() occurrences of tails. We can estimate the actual probability of occurrence of a head
occurrences of tails. We can estimate the actual probability of occurrence of a head ![]() as the ratio of the number of occurrences of a head to the total number of coin tosses performed, using the following equation:
as the ratio of the number of occurrences of a head to the total number of coin tosses performed, using the following equation:
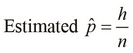
The probability ![]() defined in the preceding equation is the MLE of the probability
defined in the preceding equation is the MLE of the probability ![]() . In the context of machine learning, the MLE can be maximized to determine the probability of occurrence of a given class or category. However, this estimated probability may not be statistically distributed in a well-defined way over the available training data, which makes it hard to determine the MLE efficiently. The problem is simplified by introducing a set of hidden values to account for the unobserved values in the training data. The hidden values are not directly measured from the data, but are determined from factors that influence the data. The likelihood function of the parameters
. In the context of machine learning, the MLE can be maximized to determine the probability of occurrence of a given class or category. However, this estimated probability may not be statistically distributed in a well-defined way over the available training data, which makes it hard to determine the MLE efficiently. The problem is simplified by introducing a set of hidden values to account for the unobserved values in the training data. The hidden values are not directly measured from the data, but are determined from factors that influence the data. The likelihood function of the parameters ![]() for a given set of observed values
for a given set of observed values ![]() and a set of hidden values
and a set of hidden values ![]() is defined as the probability of occurrence of
is defined as the probability of occurrence of ![]() and
and ![]() for a given set of parameters
for a given set of parameters ![]() . The likelihood is mathematically written as
. The likelihood is mathematically written as ![]() , and can be expressed as follows:
, and can be expressed as follows:
The EM algorithm comprises two steps—the expectation step and the maximization step. In the expectation step, we calculate the expected value of the log likelihood function. This step determines a metric ![]() , which must be maximized in the next step, that is, the maximization step of the algorithm. These two steps can be formally summarized as follows:
, which must be maximized in the next step, that is, the maximization step of the algorithm. These two steps can be formally summarized as follows:
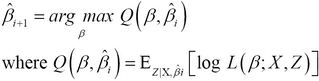
In the preceding equation, the value of ![]() that maximizes the value of the function Q is iteratively calculated until it converges to a particular value. The term
that maximizes the value of the function Q is iteratively calculated until it converges to a particular value. The term ![]() represents the estimated parameters in the
represents the estimated parameters in the ![]() iteration of the algorithm. Also, the term
iteration of the algorithm. Also, the term ![]() is the expected value of the log likelihood function.
is the expected value of the log likelihood function.
The clj-ml library also provides an EM clusterer. We can create an EM clusterer using the make-clusterer function with the :expectation-maximization keyword as its argument, as shown in the following code:
(def em-clusterer (make-clusterer :expectation-maximization
                                  {:number-clusters 3}))
Note that we must also specify the number of clusters to produce as an option to the make-clusterer function.
We can train the clusterer defined by the em-clusterer variable in the preceding code using the train-clusterer function and iris-dataset dataset, which we had previously defined, as follows:
user> (train-clusterer em-clusterer iris-dataset)
#<EM
EM
==

Number of clusters: 3


               Cluster
Attribute            0       1       2
                (0.41)  (0.25)  (0.33)
=======================================
Sepal.Length
  mean           5.9275  6.8085   5.006
  std. dev.      0.4817  0.5339  0.3489

Sepal.Width
  mean           2.7503  3.0709   3.428
  std. dev.      0.2956  0.2867  0.3753

Petal.Length
  mean           4.4057  5.7233   1.462
  std. dev.      0.5254  0.4991  0.1719

Petal.Width
  mean           1.4131  2.1055   0.246
  std. dev.      0.2627  0.2456  0.1043
As shown in the preceding output, the EM clusterer partitions the given dataset into three clusters in which the clusters are distributed as approximately 41 percent, 25 percent, and 35 percent of the samples in the training data.