
Logs are used to record error and backend processes that are running in the organization. They store the following process information:
- Workflow and approval processes
- Assignment rules
- Escalation rules
- Auto-response rules
- Apex Script errors
- Resources used by Apex Script
- Debug logs
- System logs
We use the debug log to debug and troubleshoot workflows and approval.
Debug logs are stored separately and can be retained. They are stored on the basis of particular users only. We can download, view, and manage the debug log for users when Debug Logs are enabled for a user from the Setup menu. The next 20 actions will be logged, each resulting in a log file. An action may load a URL, such as clicking on a tab or clicking on a button. So, for example, if a user navigates to the Account tab, clicks on the New button, then clicks on the Save button, three logs will have been generated and the counter will have reduced from 20 to 17. Once all are exhausted, the administrator simply needs to enable logging for that user again. All of the validation rules, workflow rules, field updates, Apex, and so on that occur in response to page loads or button clicks are included in the Debug Log file generated. There is a limit of 2 MB per log and 50 MB per organization.
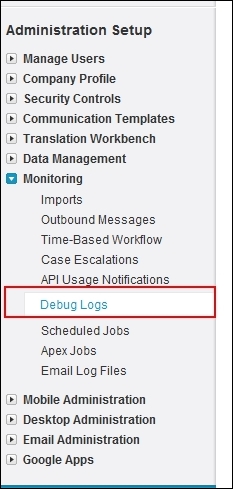
To set up a debug log, navigate to Setup | Administration Setup | Monitoring | Debug Logs:
Click on New and add the user name to monitor in the box:

The Developer Console auto-enables Debug Logging for the current user and makes it easy to reference the generated log files in the Logs tab of the Developer Console. As long as the Developer Console is open, the logs will continue to be collected regardless of the 20-log limit normally imposed when enabled via the Setup menu.
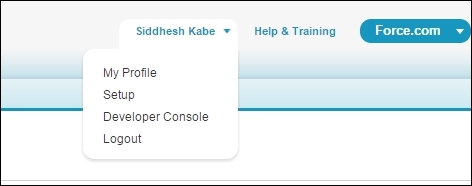
To start the system log, navigate to Your name | Developer Console in the top header of the page. The advanced developer console provides you with good tools to monitor and modify your system from the backend:
The system log will pop up on the screen. The system log will monitor processes as long as they are open, whereas the debug log will record 20 logs irrespective of whether it is opened or not.