
We can use the joined report that can display two separate tabular reports. The joined report is created in blocks with each block representing a separate report. We can have different filters for each report as well as common fields to summarize them. For example, we can compare the List of Open Opportunities by the Type of Account.
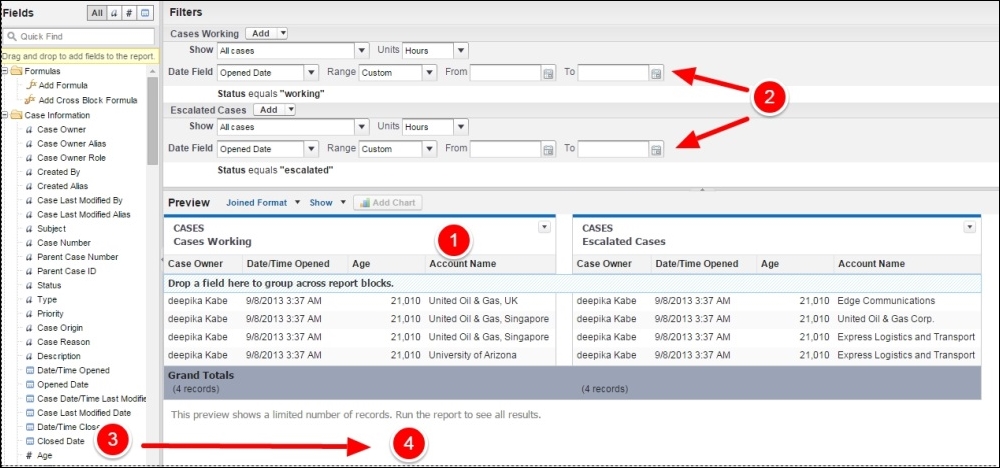
- On the preview pane marked by number 1, we can see different blocks. The first block is the original report that was a summary report. We can label different blocks in the header (1).
- Each block comes with a separate filter, which is useful to compare data. Here, in the example, we need to set filters for Working Cases and Escalated Cases (2).
- To add new blocks, we drag the field from the sidebar onto the preview pane outside the existing blocks (3 and 4).
- We can also summarize both the reports based on a common Summary field.
We can add custom charts to the Summary, Matrix, and Joint Reports using the Add Chart button, as shown in the following screenshot:
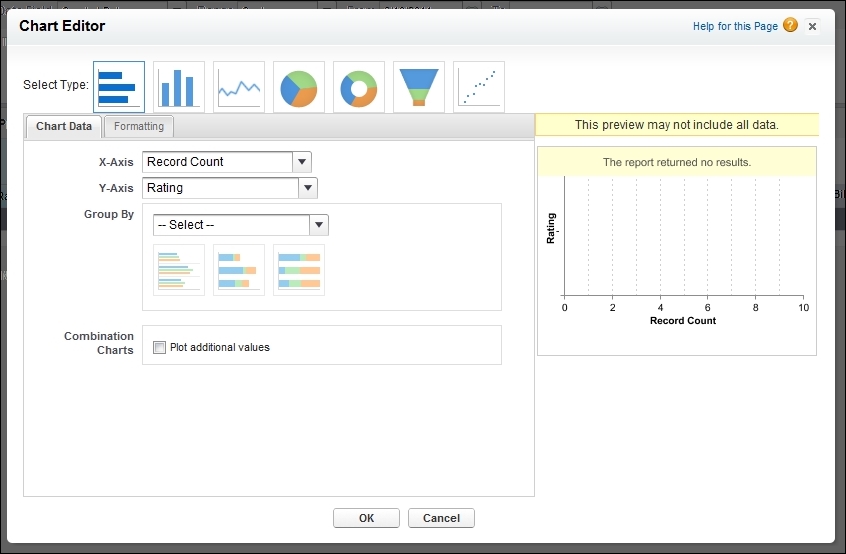
We will take a look at the options used to customize charts while creating dashboards in the next section. One final thing remaining at this point is to run the report and watch it go live.
Remember that the preview of the report does not contain live values, and we won't get a proper report until the report is run.
Once the report is generated, we get the following options:
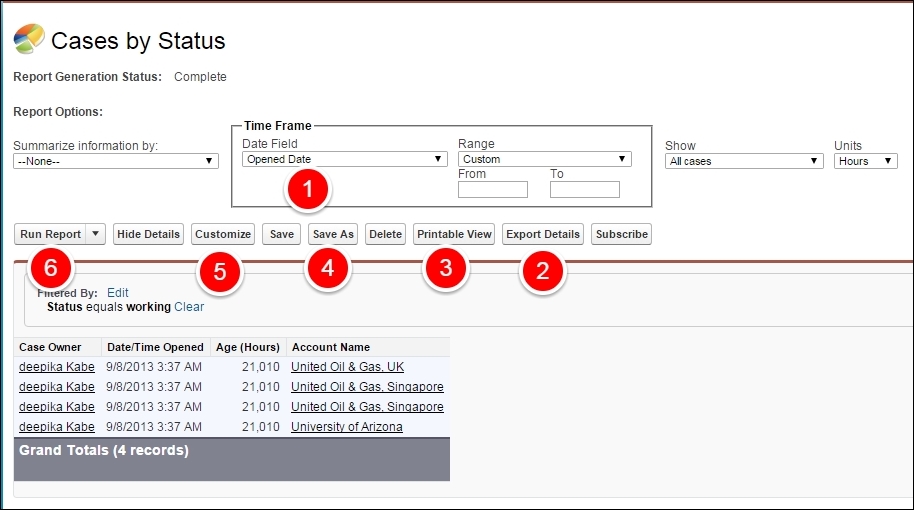
When we save the report, there are a few more options available to drill down and summarize the data. The numbers correspond to the numbers on the previous screenshot:
- Changing the time frame: We can change the time frame once the report is generated. This overrides the time frame set while customizing the report.
- We can export and download the report once it is generated.
- The report is generated as a plain text output using printable view.
- The report can be saved as a copy using the Save As option.
- Customize opens the report builder again.
- When we select Run Report, it caches the data that was available in the system. Whenever there is a change in the data or after a particular period, we can run the report again to recalculate the value.
We can schedule the report to run at a particular time and e-mail it to the participants. The report once scheduled will run automatically at the time and recalculate the values without the need for manual intervention.
To schedule a report, first follow all the steps and generate a report. On the report page, as shown in the following screenshot, select the arrow beside the run report. In the drop-down menu, select the Schedule Future Runs… option.
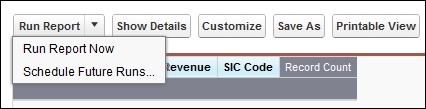
If the report is not saved, it will open the save report dialog box. Save it and continue. If the report is saved, it will open the next page, as shown in the following screenshot:
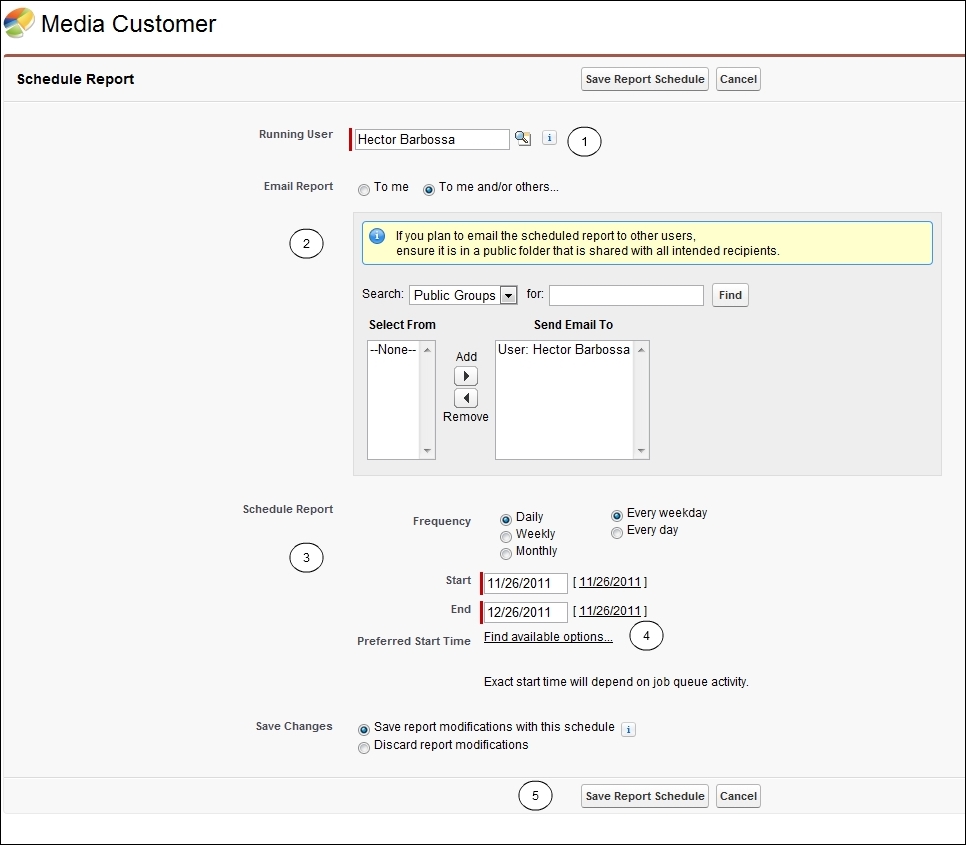
Let's take a look at the numbers marked on the preceding screenshot in detail:
- Select a user to run the report. The report will be filtered on the basis of the data access to this user. If the user is at the top of the hierarchy than the recipient, they can view the data not accessible to them. Hence, we have to exercise caution when selecting the user so that we don't provide unauthorized access.
- Select the appropriate users to e-mail this report to. If more than one user is in the delivery list or it is sent to a public group, we need to save this report in the public folder where all the recipients will have access to it.
- Select the date and schedule for the report.
- The time depends on other scheduled reports queued by other users. The exact time is also determined by the availability of bulk queues.
- Save the schedule report.
The report will run at the specified time and we will receive an e-mail containing the report.
Standard report types are automatically included with standard objects and custom objects. Standard report types cannot be customized and automatically include standard and custom fields for each object within the report type. However, using a custom report type, we can specify which objects and fields to use.
Generally speaking, most organizational requirements are solved using standard report types. For example, a custom report type is useful to add fields from lookup relationships, and even fields from lookup relationships from those fields.
To set up a custom report type, we execute the following steps:
- Navigate to Setup | App Setup | Create | Report Types, and click on new Custom Report Type:
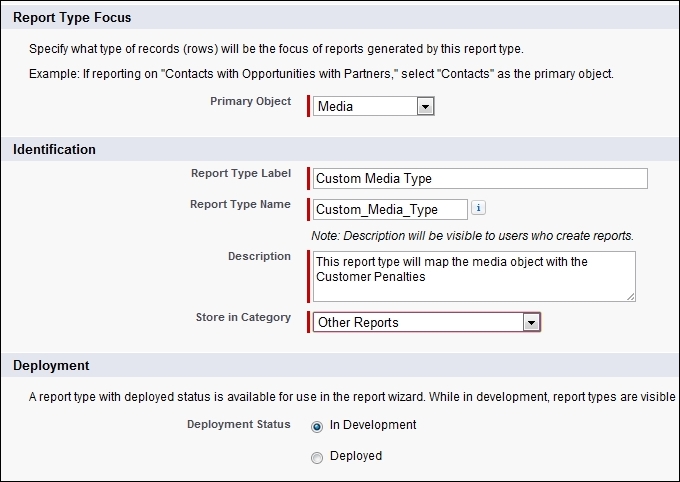
- Define a custom report type by
name,description,primary object,developmentstatus, and thecategoryto store it in, as shown in the following screenshot, and click on Next.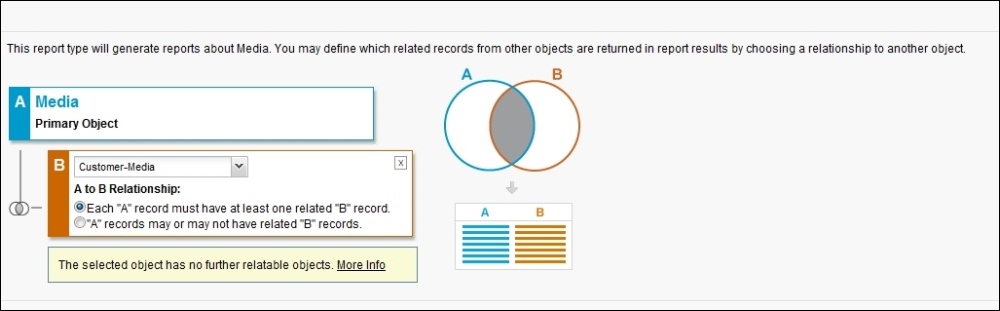
- Choose the objects for the custom report type. The objects are available on the basis of the primary object's relationships with the other objects. Only the objects with a lookup or
master–childrelationship with the primary object are seen in the list. Save the relationship.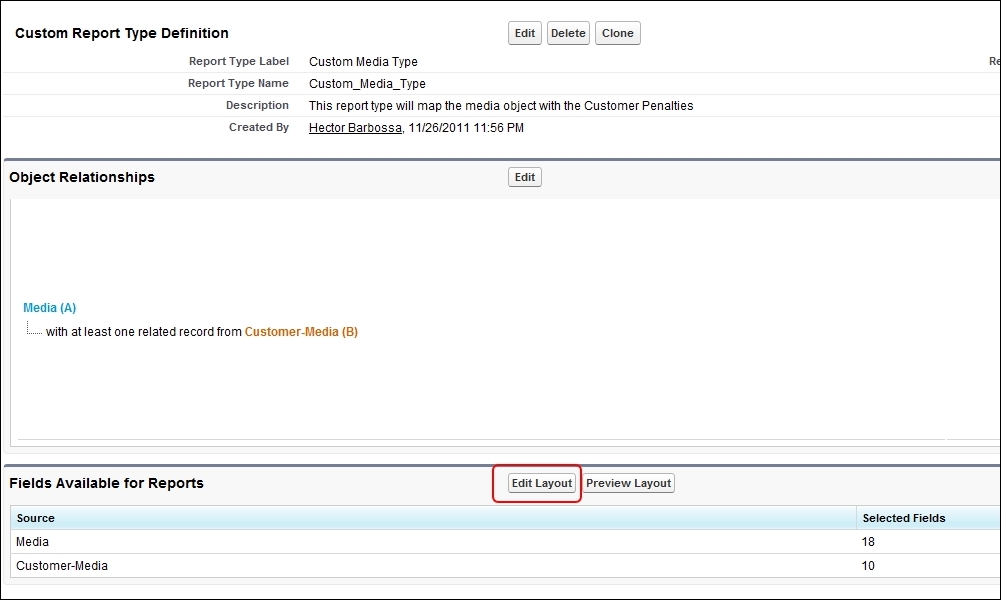
- On the custom report type page layout related list, click on the Edit Layout button, to view the same as in the following screenshot:
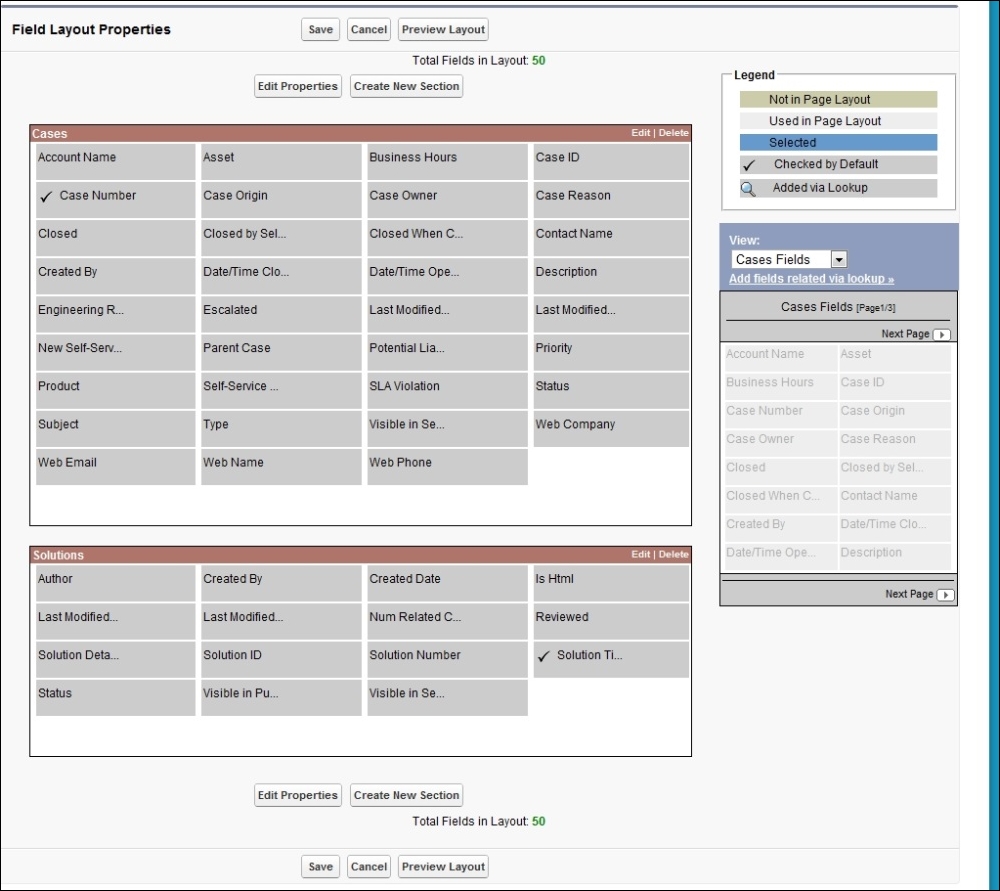
- On the edit layout, we can specify which standard and custom fields a report can display when created or run from the custom report type. Once added, select Preview Layout to check whether the correct fields are added.
- The custom record type will be available in the report type while creating reports.
The general library needs to get an inventory check of all the media items that are available presently in the library and are scheduled to be returned by the end of the week. The availability of the item is determined by a checkout on the media object. The report should be grouped by the type of the media item (books or movies). Generate the report for it.
We have already seen how to create a report in the previous section. Refer to the section on report builder to create a report.
The librarian would like the report to be generated at the end of every working day and e-mailed to her. Schedule the report prepared in the previous exercise to be e-mailed every day at 5 p.m.
The general library needs to generate a report of all the defaulters to be displayed on their bulletin board. The report should contain the name of the defaulter and the item that the customer has borrowed. It should be grouped by the media resource (books and movies).