In this chapter, we will implement the capacity-monitoring solution we discussed in Chapter 5, Capacity Monitoring. We will cover each service tier from compute, storage, and network components. Due to the similarity in the approach, we can cover them in the following sequence:
- Tier 1 compute
- Tier 2 and 3 compute
- Storage (common for all service tiers)
- Network (common for all service tiers)
This will cover IaaS capacity monitoring. As overprovisioned VMs are a common problem, we will also cover VM rightsizing. We will cover both downsizing and upsizing scenarios.
Let's recap from Chapter 5, Capacity Monitoring, what we need to produce to monitor capacity in tier 1 compute:
- A line chart showing the total number of vCPUs left in the cluster
- A line chart showing the total number of vRAM left in the cluster
- A line chart showing the total number of VMs left in the cluster
Let's look at the first line chart. The number of vCPUs left is essentially supply and demand. The supply and demand can be defined as the following:
- Supply = (The total physical cores of all ESXi hosts) - (HA buffer)
- Demand = The total vCPUs for all the VMs
On the supply side, we can choose physical cores or physical threads. One will be conservative while the other will be aggressive. The ideal number is 1.5 times the physical core, as that's the estimated performance improvement from Hyper-Threading.
My recommendation is to count the cores, not the threads. There are two reasons for this:
- This is tier 1, your highest and best tier. If you are counting the threads, or using a 1.5x multiplier, you can no longer promise it is as good as physical. Contractually, you should also adjust your SLA accordingly from 1 percent CPU contention to perhaps 2-3 percent.
- The vmkernel itself takes up CPU, albeit minimal. It will take up more if you are running kernel modules such as VMware VSAN and VMware NSX. If you are counting the cores, you have more than enough buffer.
That's it for the supply side.
The demand side is simpler. It is simply the sum of all the vCPUs in all the VMs in the cluster.
Count the ESXi agent VMs too. This includes basic VMs such as a Nutanix Controller Virtual Machine (CVM) or Trend Micro Deep Security VM. Regardless of their functionality, they are consuming CPU resources.
If you are using virtual threads in your VM, then count them as if they are full vCPUs. For example, a VM with two vCPUs and two threads per core should be counted as four vCPUs.
In logic, the super metric formula is:
- Supply = (Number of Physical Cores in the cluster) - (HA buffer)
- Demand = Number of running vCPUs in the cluster
vRealize Operations has a metric that takes HA into account. You do not need to manually build the formula any more.
The following screenshot shows the actual super metric formula:

Super metric – Number of vCPUs left in a tier-1 cluster
Since we need to apply the formula to the vSphere cluster in question, we need to use the THIS option. Click on the little blue icon above the formula bar, as shown in the following diagram, then double-click on the formula you want to use:
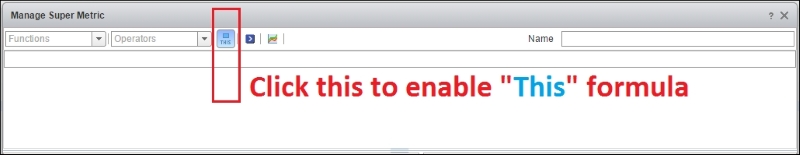
Super metric – enabling the THIS formula
The actual formula is as follows:
Avg(${this, attribute=cpu|alloc|object.capacity}) - Avg(${this, attribute=summary|number_running_vcpus})We've covered CPU. RAM follows a similar logic. The amount of vRAM left is also based on supply and demand, where:
- Supply = (The total physical RAM of all ESXi hosts) - (HA buffer)
- Demand = The total vRAM for all the VMs
There is no need to include ESXi vmkernel RAM as it is small enough to ignore. In addition, almost no VM uses its configured RAM, and you have Transparent Page Sharing. These two reasons are also why we do not see the need to add a threshold.
If you need to include one, review Chapter 13, Memory Counters.
If you are using VSAN and NSX, you can add some buffer if you think that's necessary. For VSAN 6.1, Cormac Hogan explains this at http://cormachogan.com/2015/11/10/vsan-design-sizing-memory-overhead-considerations/. In most cases, we can ignore both NSX and VSAN overhead.
You do not need to include virtual appliances as they take the form of a VM; hence, they will be included in the demand.
If you find the formula complex, you can actually split them into two super metrics first. Work out supply, then work out demand.

Super metric – Number of vRAM left in a tier-1 cluster
The actual formula is as follows:
(Avg(${this, attribute=mem|alloc|object.capacity}) – Sum (${adapterkind=VMWARE, resourcekind=VirtualMachine, attribute=mem|guest_provisioned, depth=2}) )/1000/1000The third line chart we need to display shows the total number of VMs left in the cluster. While the first two line charts come from the Performance Policy, this comes from the Availability Policy.
Normally, availability is associated with the ESXi host. For example, you keep the maximum number of VMs in a given ESXi host. The logic here is that if any ESXi goes down, you're capping the number of affected VMs.
We apply the Availability Policy at the cluster level since it makes more sense. Applying it at the ESXi host level is less relevant due to HA. Yes, the chance of a host going down is higher than that of the entire cluster going down. However, HA will reboot the VMs, and VM owners may not notice. On the other hand, if a cluster goes down, it's a major issue.
The supply and demand can be defined as follows:
- Supply = The maximum number of allowed VMs in one cluster (taking into account the HA buffer)
- Demand = The total number of VMs in the cluster
Can you notice a limitation in the formula?
It assumes that your tier-1 cluster size does not vary. This is a fair assumption as you should keep things consistent in tier 1. If, for some reason, you have multiple cluster sizes (for example, 8, 10, or 12), then you have one super metric per size.
The following screenshot shows the super metric formula for the total number of VMs left in the cluster:

Super metric – the number of VMs left in a tier-1 cluster
We have hardcoded the maximum number that we allow. While you can do away with hardcoding to some extent, it is acceptable as policy changes require agreement from the business.
The actual formula is this:
100 - Avg(${this, attribute=summary|number_running_vms})In the beginning of this chapter, we recapped that we needed to produce three line charts. Look at the line charts in the previous three subsections as one group. Take the one with the lowest number as the determining factor that you're running out of capacity.
You've got the supply and demand. You know when the number will reach zero.
The question is: when do you buy new hardware?
Because this is tier 1 and you promise identical specifications, this could mean a new cluster. Buying a cluster can be a substantial commitment, so it has to be planned properly.
If you manage a very large environment and are buying clusters quarterly, you can set a threshold. For example, when you are down to the 10 percent capacity, you can trigger a new cluster purchase.
You do not have to build your threshold (which is your buffer, actually) into the super metric formula as it is dynamic. Once it's hard-coded in the super metric, changing it does not change the history.
It is dynamic because it depends on the business situation. If there is a large project going live in a few weeks, then your buffer needs to cater to it. This is why we need to stay close to the business. It's also something you should know, based on your actual experience in your company. You have that gut feeling and estimate.
For an emergency, temporary solution, you can still deploy VMs while waiting for your new cluster to arrive. This is because you have an HA buffer. ESXi hosts are known for their high uptime.