The management pack for IBM DB2 is one of the major databases represented in our vROps Database Solution. This management pack is key for any VMware administrator who wants to ensure their databases are healthy, available, and unaffected by performance degradation. It also provides in-depth metrics down to the query level, which allow users to ensure the actual database's health as well as the underlying infrastructure's:
The DB2 on VM dashboard
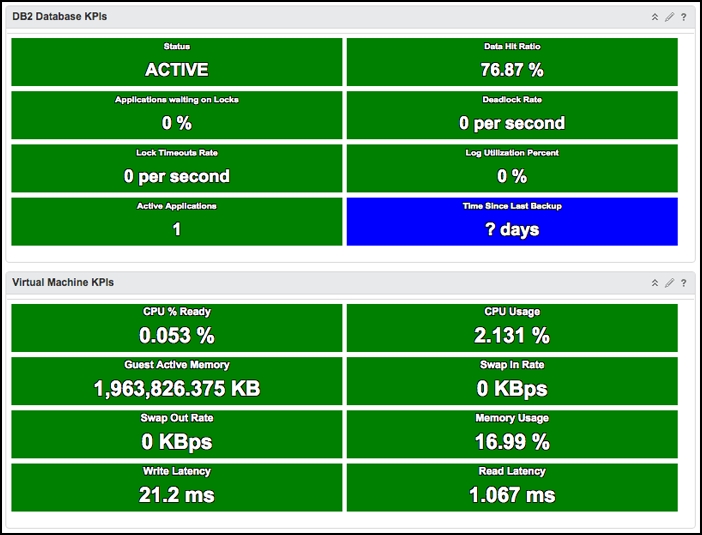
When looking at performance, there are two primary dashboards that the administrator can use. The first is the DB2 on VM dashboard. This dashboard helps give the administrator a view of any DB2 database that they are virtualizing. Like the dashboard shown in the management pack for MS SQL, this dashboard's primary feature is that it shows this product and how it relates to VMware. The ability to see both these metrics side by side allows us to quickly diagnose the root cause of any issue.
In the left-hand side of this dashboard, we have two selectors. When we select a DB2 database from the top, the Virtual Machine it is running on will automatically get selected below. Once these objects are selected, the widgets on the right will immediately start to be populated with key metrics about each. For the database, metrics about locks, deadlocks, and hit ratios will be displayed. As for the VM, CPU, memory, swap, and write/read latency are the primary focus areas. If there is any issue with the database, we can quickly identify whether it is related to the Virtual Machine:
The DB2 Top-N Queries dashboard
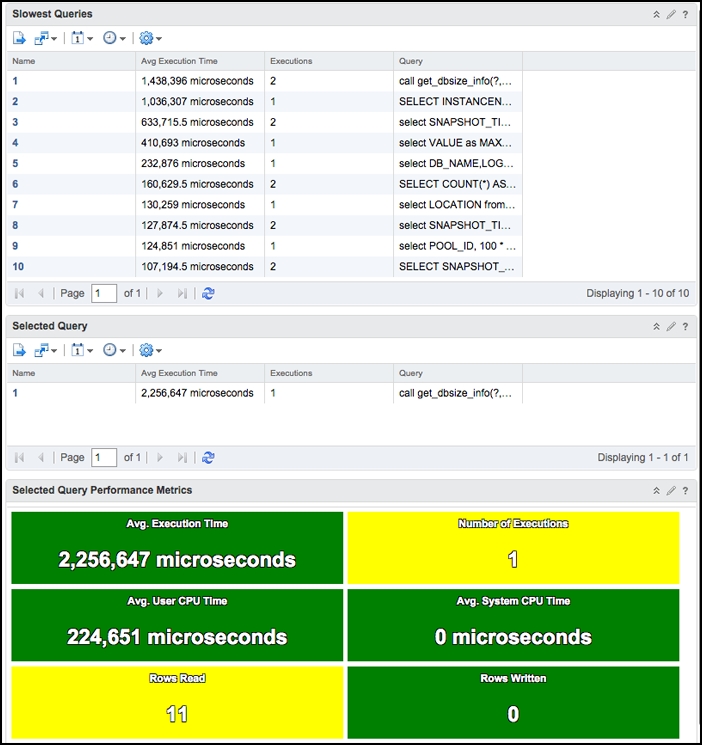
When the administrator wants to dig in deeper and show important metrics about the database, they should start with the DB2 Top-N Queries dashboard. This dashboard allows the administrator to see all of the top metrics by query execution time. Let's start by looking at the top half of the dashboard. In the top left, there is a selector that allows us to select any database we have promoted. When a database is selected, the top 10 slowest queries we be populated in the widget next to it. This widget will show data about the average execution time, the number of times the query has been run, and the actual text of the query.
The bottom half gives us even more detail, focused on query information. On the left, we have a heatmap that also acts as a selector. We can select this heatmap to show data based on query execution time, user CPU time, or system CPU time. Because this data is formatted in a heatmap, it helps us quickly identify any outliers. Once the administrator selects the query in the heatmap, they can see information on that individual query on the widget to the right. We can see data such as how many times it was run, the average execution time, and how many rows were read.
The configuration of this management pack is simple. We do not need to worry about resource flooding or advanced configuration. Everything simply works! However, to ensure that all metrics are being collected, ensure the following is enabled on the DB2 side:
- The
HEALTH_MONDB2 configuration parameter - The switch for monitoring statements
- Permissions for the management pack to query the lock waits in the administrative view
- Table monitoring (
DFT_MON_TABLE) for the database being monitored
This is well documented in our installation guide, which has commands on how to activate each of these properties. Once the administrator has everything set up, all of the management pack's metrics can be collected.