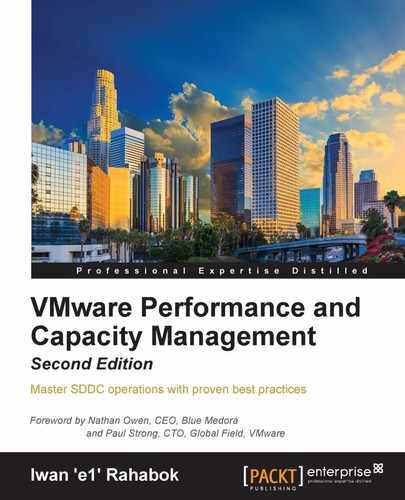
vCenter 6.0 Update 1 provides 28 counters for RAM in order to track the various features of VM memory management. Compared to physical servers, where you normally just monitor the memory utilization and swapping, these are a lot counters. All the counters are shown in the next screenshot. With 28 counters per VM, a vSphere environment with 1,000 VMs will have 28,000 counters just for VM RAM!
It is certainly too many to be monitored as part of overall management. The latter part of this chapter will share the three key counters you need to track to manage performance and capacity.
VM – RAM counters
At the ESXi level, vCenter provides 33 counters. As you can expect, some of the counters at the ESXi level are essentially the sum of associated counters of all VMs running in the host, plus vmkernel's own memory counters (since it also consumes memory). This aggregation is useful as VMs do move around within the cluster. Since there are a lot of counters, let's compare the differences first.
The following counters are unique to VM monitoring and they do not exist at the ESXi level:
- Entitlement: This makes sense, since entitlement is a property of a VM.
- Overhead touched
- Reserved overhead
- Zipped memory
- Memory saved by zipping (KB): The compression ratio is either 2x or 4x, so this counter tracks the total memory saved. With the availability of other counters, we have yet to find a use case for it.
- Balloon target: If you see a nonzero value in this counter, it means that the hypervisor has asked this VM to give back memory via the VM balloon driver. This does not necessarily indicate a reduction of performance, as it depends upon whether the memory page released by the balloon driver is a free one or not. If it is from the free memory, then the Guest OS does not need to perform a page out to meet the request of its balloon driver. If it is not, then the Guest OS will page out, and this can impact performance. A page out happens when the Guest OS is running high on memory. This means that it is acceptable to see some ballooning so long as both the Consumed and Active counters are low.
- Swap target: This is different from ballooning, as the hypervisor has no knowledge of the free memory inside the Guest OS. It is important to note that this is a target, meaning it may not be achieved. The hypervisor is clever enough to do compression instead, if it can compress at least 2x (meaning a 4-KB block becomes less than 2 KB). If it cannot, logically, the choice is to swap out. As a result, any value in this counter indicates that the host is unable to satisfy the VM memory requirement. Use vMotion on one or more VMs out of the host until the Swap target counter hits zero.
You may notice that there is no compression target. We have a balloon target and swap target, so we should expect a compression target too. Does this sound logical?
Not really. Because both swap and compression work together to meet the swap target counter, the counter should actually be called Compression or Swap target.
We looked at counters that do not exist on ESXi. Let's now look at counters that exist so that you can make a comparison. The following counters exist in ESXi but do not exist at the VM level:
- Used by vmkernel
- Heap
- State
- Low free threshold
- Reserved capacity
- Unreserved
- Total capacity
- Swap in from host cache
- Swap out from host cache
- Shared common
The Used by vmkernel counter is obviously not applicable to a VM. With ESXi sporting around 256 GB of RAM these days, the memory consumed by the hypervisor is very small compared to the total RAM. This is even after kernel-module functionalities from NSX and VSAN.
Before we dive into the details of key counters, let's quickly cover what is not available. There is no counter for large pages. This means that you cannot tell whether VM memory is being backed by large pages or not. At the ESXi level, you cannot tell how many gigabytes of the RAM is made up of large pages. A topic on large pages merits a discussion by itself, as there are many levels to check (ESXi, Guest OS, and application) and factors to consider (performance, cost, and manageability). You should enable a large page in use cases where performance matters the most (that is, in clusters where there will be no oversubscription) and disable it where cost matters the most (that is, where you want to have heavy oversubscription). There is also another useful counter that is missing. It exists for CPU but not for RAM.
Go back and look at the list. Can you spot it?
We will talk about it when we cover utilization. Right now, we need to cover contention. We will use the same approach we used for CPU counters, which is starting with contention, followed by utilization, and ending with other counters.
As expected, vCenter Server does not provide a counter for memory contention. You can certainly check for signs of contention, such as the existence of balloon, swapped, or compressed memory. A nonzero value in any of these counters indicates ESXi had or has memory pressure and it may impact this VM.
Can you guess why I use the word "may" instead of "will"?
It's because it does not always mean that the VM performance is affected. If the page being swapped out is a free page and the VM does not use it, then there is no performance hit. The performance issue happens when the Guest OS wants to access that page, because the hypervisor has to bring the page back to the physical DIMM first. Certainly, the higher the value is for balloon, swapped, and compressed, the higher the chance of a performance hit happening in the future if the data is requested. The severity of the impact depends on the VM memory shares, reservation, and limit. It also depends upon the size of the VM's configured RAM. A 10-MB ballooning will likely have more impact on a VM with 0.5 GB of RAM than on one with 128 GB.
It is also possible to have balloon showing a zero value while compressed or swapped are showing nonzero values—even though in the order of ESXi memory reclamation techniques, ballooning occurs before compression. This indicates that the VM did have memory pressure in the past that caused ballooning, compression, and swapping then, but it no longer has the memory pressure. Data that was compressed or swapped out is not retrieved unless requested, because doing so takes CPU cycles. The balloon driver, on the other hand, will be proactively deflated when memory pressure is relieved.
Without an SSD as a cache, swapped memory would mean severe memory performance degradation. If your use case requires high ESXi memory utilization and regular swapping is likely, then you should consider implementing SSDs as a cache. For a VM, retrieving swapped pages from a host-side SSD is much faster than from a spinning disk.
Note
Check out the write-up by Duncan Epping at http://www.yellow-bricks.com/2011/08/18/swap-to-host-cache-aka-swap-to-ssd/.
Once you enable the host cache, you should also track the host cache used for swapping, the swap out rate to host cache, and the swap in rate to host cache counters.
There is also a counter called Latency (%) that tracks the percentage of time for which the VM is waiting as it is accessing swapped or compressed memory.
This is certainly useful. Just because a VM has a portion of its memory compressed does not mean that it is accessing that compressed memory. Therefore, it is acceptable to see Balloon or Compressed or Swap as long as Latency is 0.
You should also check Entitlement and make sure it is not capping the Demand value or Consumed value. It is possible for a VM to not have its memory swapped, compressed, or ballooned, but still not get what it demands. Check whether there are reservations on other VMs and limits on this VM. This is why you should not set these two counters (Reservation and Limit) and use Share instead.
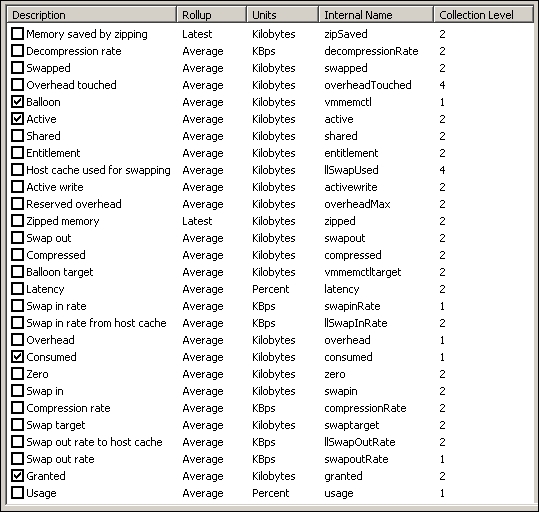
The following chart shows a healthy environment. This VM's Consumed Memory is consistently lower than its Entitlement Memory.
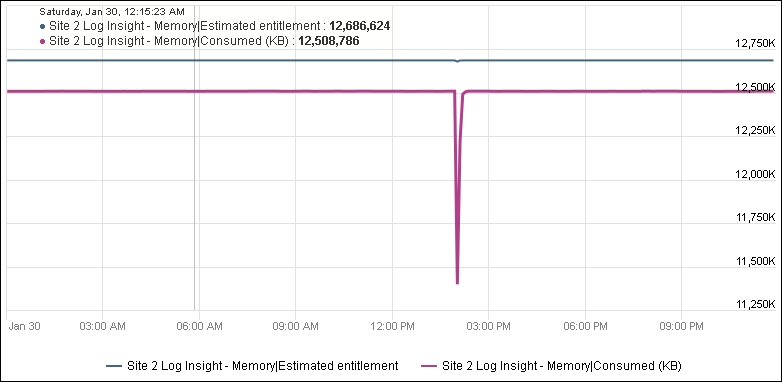
It is tedious to check every VM one by one. With vRealize Operations, you can create a super metric that tracks Entitlement/Demand or Entitlement/Consumed. You need to use the This Resource icon, so the formula is applied to the VM itself:
You should expect a value of 1 or higher. A value between 0 and 1 means Demand is greater than Entitlement, which is not what you want. In a healthy environment, all your VMs will give you a value greater than 1. You can create a heatmap that shows all VMs. If you choose a range between 0.8 and 1.0, where 0.8 is red and 1.0 is green, then a small percentage of contention will result in a color change, making it visible. For a test/dev cluster where you deliberately drive for a higher utilization, adjust the range beyond 1.
As you can tell from the preceding part, it is difficult to check contention as there are many counters and factors to consider.
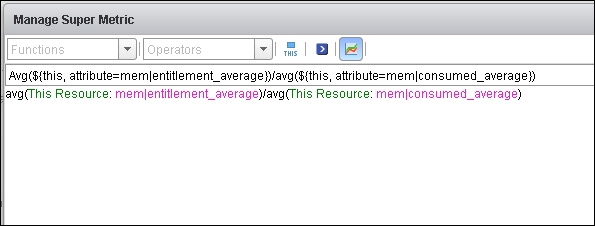
This is where the Contention (%) metric in vRealize Operations is useful. It is actually derived from the CPU Swap Wait (ms) counter, as shown in the next screenshot. The following VM has four vCPUs. If you divide 16,539 by 4, you will get 4,134. Then, 4,134 ms over 20,000 ms is 20.67 percent.
Chapter 4, Performance Monitoring, provides an example of the threshold you should set.
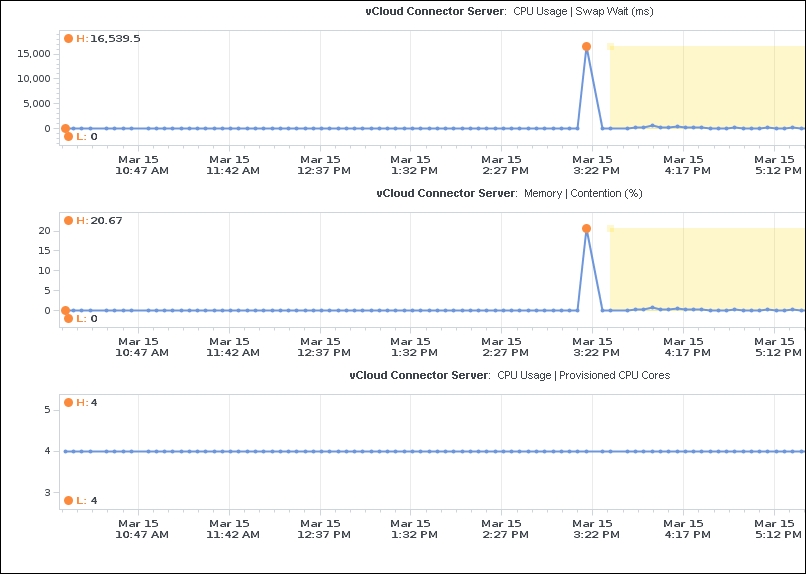
Memory Contention is CPU Swap Wait
Let's look at another example of Memory | Contention (%) in action. This time, there were no VMware tools in the VM (the balloon driver relies on VM tools being installed). The VM experienced both Swapped and Compression. About 33 MB was swapped and 24 MB was zipped, which are low amounts of contention as the VM has 6 GB of RAM. The Contention (%) went up to around 0.2 percent, reflecting the low amount of contention. The counter then dropped even though the swapped and zipped counters remained where they were.
Can you figure out why Contention dropped?
The answer is CPU Swap Wait. The CPU Swap Wait went down, because the VM did not access those pages anymore:
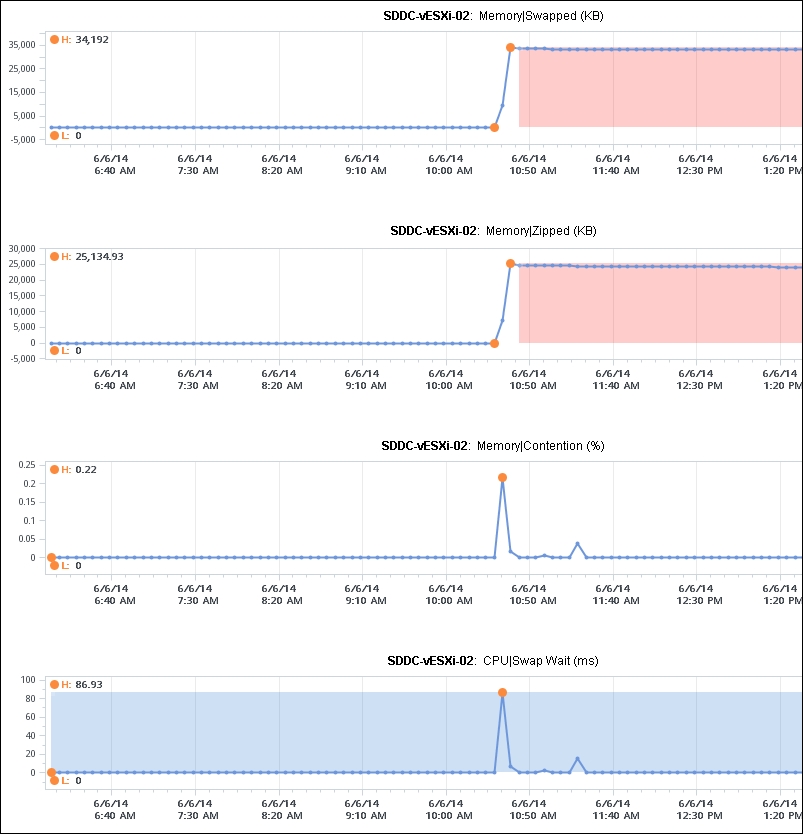
Memory Contention is CPU Swap Wait
For utilization, vCenter provides Active (KB), Active Write (KB), Consumed (KB), Granted (KB), and Usage (%). Because you will have VMs with different vRAM sizes, it is easier to use the Usage (%) counter.
Pay special attention to the Usage counter. It has different formulas depending on the object:
- For VMs, it is mapped to Active
- For ESXi, it is mapped to Consumed
- For clusters, it is mapped to Consumed and Memory overhead
The effect of this formula is that you will see ESXi usage as much higher than your VM usage. For example, if all the VMs have the same size of RAM and their usage is about the same, you will notice your ESXi usage is higher than VM usage.
Technically speaking, mapping usage to active for VM and consumed for ESXi makes sense, due to the two-level memory hierarchy in virtualization. Operationally, this can create some confusion, as it is not a consistent mapping.
At the VM level, we use active as it shows what the VM is actually consuming (related to performance). At the host and cluster levels, we use consumed because it is related to what the Guest OS has claimed (related to capacity management).
The blog post by Mark Achtemichuk shared earlier explains that using Active (KB) alone will normally result in aggressive sizing. For an application that manages its own memory (for example, JVM and database), this can result in poor performance for the application. These applications have their own sets of working memory and the Guest OS does not understand this. Performing ballooning in this situation may result in a hard page fault as far as the application is concerned, because the Guest OS does not know how the application uses memory. In some situations, it might be better for the application to be given less memory to begin with.
You should use consumed as a guide for such applications. Because it is application dependent, you should consider deploying vRealize Infrastructure Navigator, which is a component of vRealize Operations. As shown in Chapter 2, Software-Defined Data Centers, it can tell you whether you have databases and application servers.
Does this mean we can just give a VM whatever resources the VM owner asks? This is not a wise policy. From experience, I know that applications tend to be oversized if I do not apply a sanity check. This is a common practice for physical servers, as the server comes with a standard RAM configuration. We also know that there are cases where applications simply ask for memory and then never use it again.
Oversizing, as you probably have experienced first-hand, can lead to poorer performance. It also takes longer to boot and to use vMotion for a larger VM—more does not always mean better when the underlying platform is virtualized.
Reducing a VM's memory requires both the application developer and infrastructure engineer to discuss and agree upon the sizing. However, this is not always possible: in a global organization with thousands of VMs, it may not be practical to install agents. What metric do you use then?
As a workaround in such a scenario, vRealize Operations provides the Demand metric. It uses Active as a starting point. The Demand counter takes into account that an OS needs a minimum amount of RAM to function properly. The range is typically 64 MB to 512 MB, depending upon the size of configured RAM and active memory. It also takes into account memory contention.
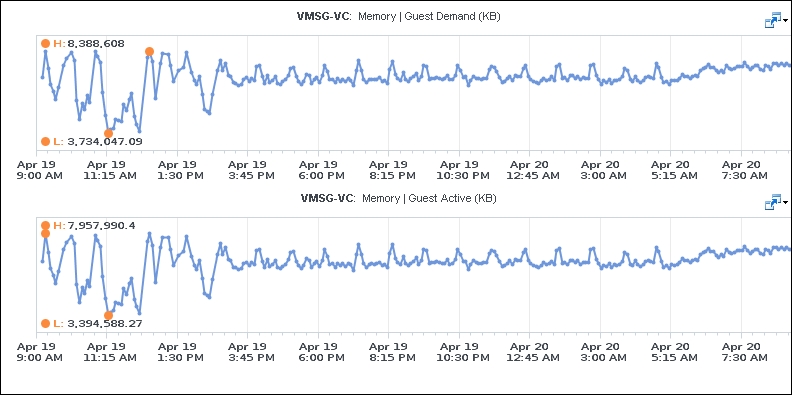
VM Memory counters – Demand versus Active
In an environment where there is little memory contention, you will see a pattern like the one shown in the preceding screenshot. Without checking the Consumed and Configured counters, you cannot tell whether Demand is high enough. This is because the Demand metric is not shown as a percentage. This is where Workload (%) comes in. Because it is a percentage, you can also make a relative comparison among VMs of different sizes.
The Demand (KB) counter, because the unit is an absolute amount (instead of a percentage), can be useful when combined with the use of a dynamic group. Let's say your environment has a lot of large VMs mixing with many small VMs in the same cluster. In this situation, you want to know the impact that these large VMs have in your cluster. For that, you need to know whether they are using the memory given to them, as large VMs tend to be over-configured. A VM may be configured with 128 GB of RAM, but does it actually use that much RAM?
You can create a dynamic group in vRealize Operations whose members are VMs with more than 24 GB of vRAM, then create a super metric that is applied to that dynamic group and tracks the maximum value of Demand (KB) memory. You divide the number by 1,024 x 1,024 to get the value in terms of GB.
If the super metric shows a small number most of the time, then you know that these large VMs are over-configured and not really impacting your cluster. You can then start looking from the biggest VMs, as they provide the biggest downsizing potential.
If the super metric shows a large number, then you need to check for signs of contention in your cluster, hosts, and VMs.
The shared memory counter is not applicable at the VM level, as each VM believes it is alone with the underlying physical resources to match its configured size. The shared memory counter is naturally read-only, as a write from any VM will make the page different and therefore no longer shared. If you have a uniform set of VMs and yet the shared memory counter is low, it could be that the Guest OS writes a lot to its pages.
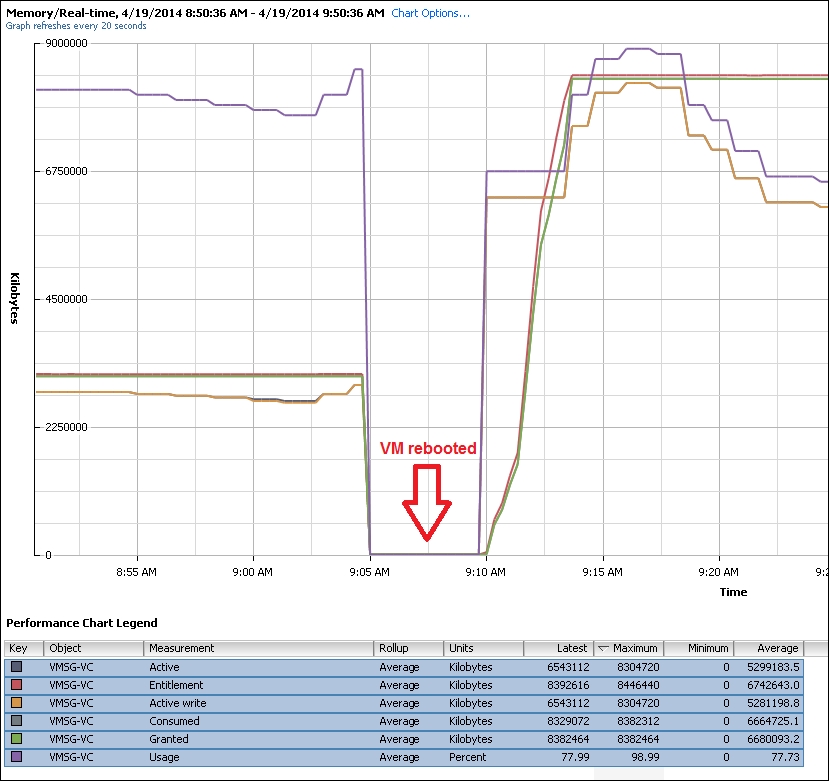
The Overhead touched, Reserved overhead, and Overhead counters can generally be ignored as their values are low. The following screenshot shows that their values are barely visible. The following VM has 10 GB of RAM. I rebooted the VM towards the middle of the timeline (see the red arrow), just to be sure the counters were behaving properly.
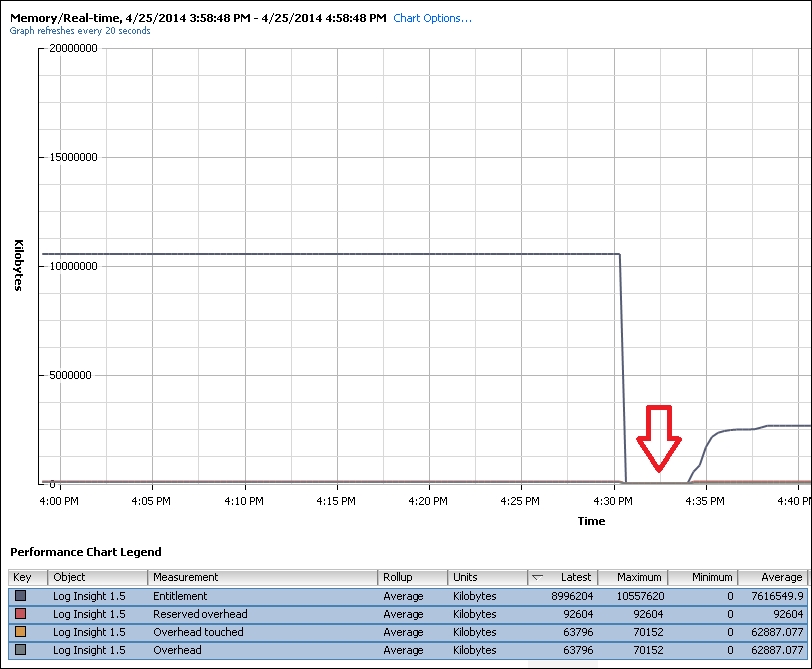
VM memory – secondary counters
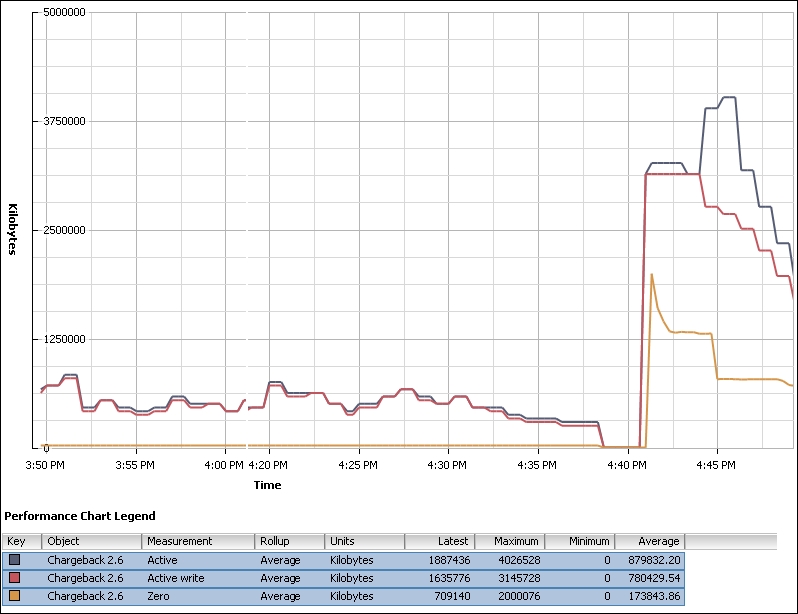
Let's now take an example to see how all the VM-level counters relate, using a vCenter 5.5 Linux appliance as an example. Logically, there are differences in memory behavior between the Linux appliance and vCenter installed on Windows.
For this example, the VM is configured with 3 GB of vRAM and rebooted to ensure we have a clean start. The recommended size for a vCenter appliance is 8 GB, so this is well below the default value.
The following chart shows that it has hit a steady state after the initial boot. The highest line is the Entitlement line, as it is Granted + Overhead. The hypervisor has entitled the VM to the entire 3 GB of RAM as the host has plenty of memory. The Granted and Consumed counters are practically identical. The lines are in fact overlapping, with the Consumed line overwriting the Granted line. It is a flat line, meaning all the pages the VM asked for are backed by physical DIMMs.
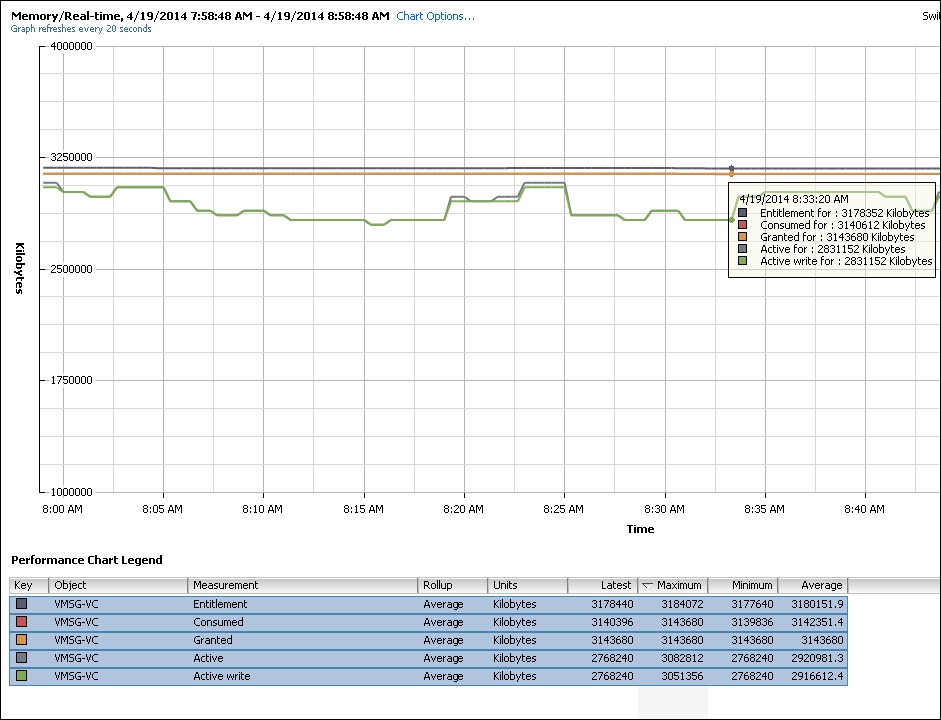
VM Memory counters
It is good to see that the Consumed value is both high and flat. As we know, Consumed goes up when the Guest OS asks for the memory, which means the Guest OS is writing to its physical memory pages (which in turn are backed by hypervisor physical memory). If the VM no longer needs it but ESXi does not use the page, ESXi keeps the pages just in case they are required in the future.
You probably noticed that both the Active and Active Write counters are high. These values are close to the Consumed value. This indicates the Guest OS is actively using most of its consumed memory. In fact, the value of Active write is almost identical to the value of Active. The green line is practically covering the gray line. This behavior is specific to vCenter, meaning not all VMs will have Active write identical to Active.
If we look at the vRealize Operations 5.8 appliance, for example, the pattern is very different. As you can see in the next screenshot, Active write is definitely lower than Active, and both are much lower than Consumed:
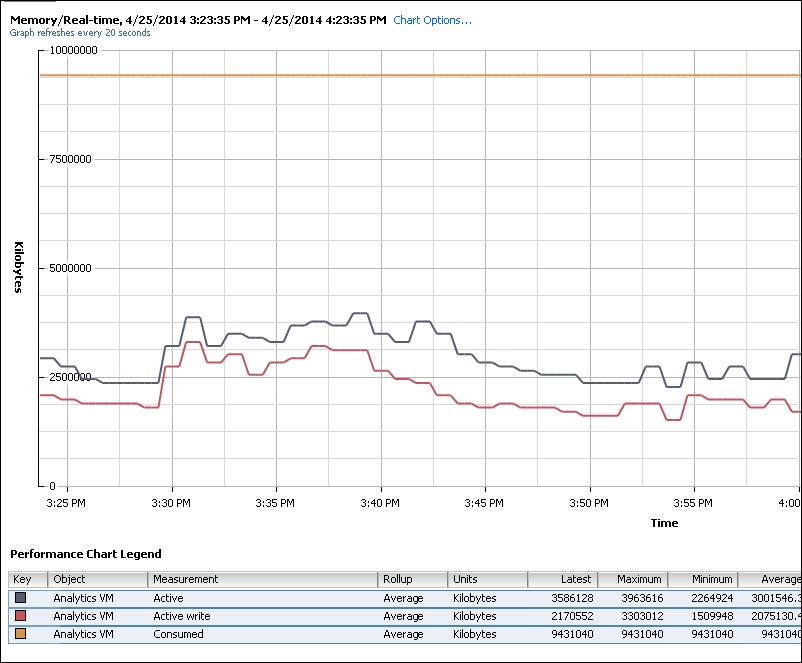
VM Memory counters
Let's now add the Usage counter as follows. I have removed some counters to make the following chart easier to interpret and added the Balloon counter. The Usage counter tracks the Active counter closely. The Usage counter shows that the VM has very high memory utilization, averaging at 93 percent in the past hour, which triggers a vCenter alert.
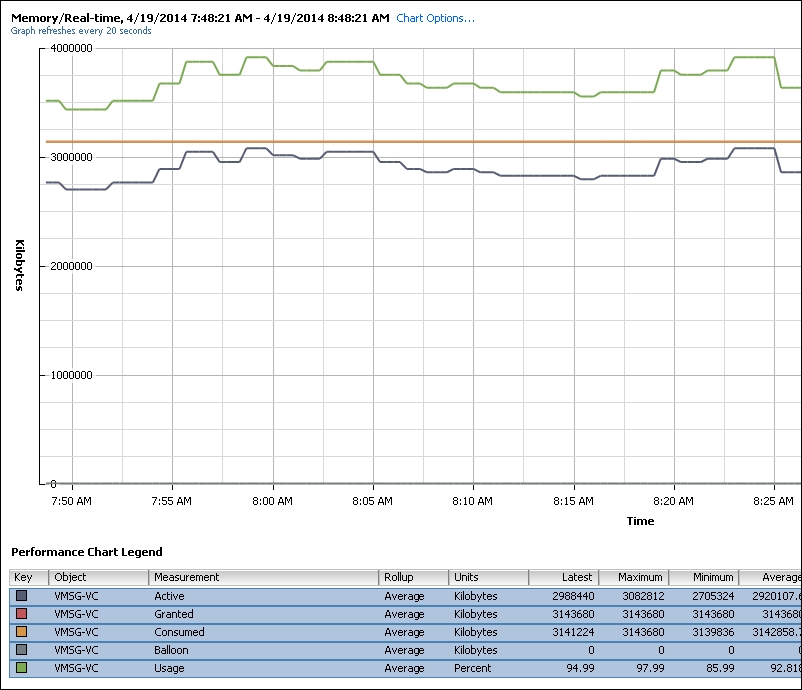
VM Memory counters
The Balloon counter is 0 for the entire duration, indicating there is no memory pressure at all. Let's look at the remaining counters that measure contention. As you can see from the following chart, they are all zeroes. We can deduce that latency should be zero too.
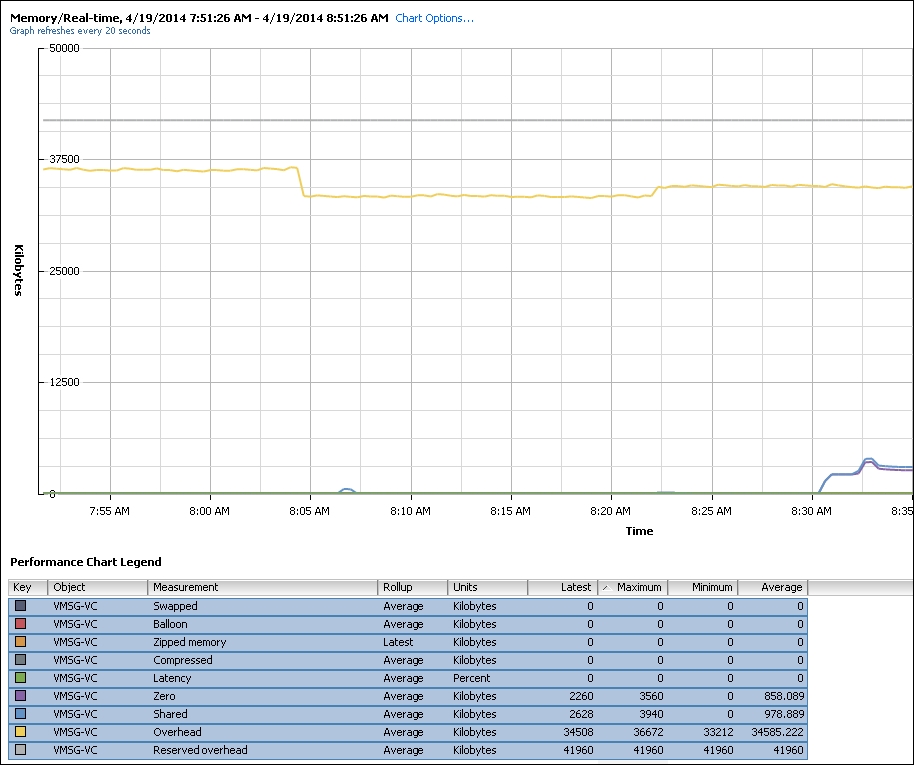
VM Memory counters
You can also see the Overhead and Reserved overhead counters. As expected, their value is insignificant as the memory overhead in vSphere is low. The Reserved overhead is the thin and flat gray line at the top, while the yellow line below it is the Overhead counter.
The Zero counter tracks all pages with just zeroes on them (unused pages). As expected, the value is low as this is a Linux OS—Linux does not touch any pages until they are actively used. In Windows 2008, you will see a high spike during boot, as Windows initializes all the pages available to it on startup. After a while, it will taper off as this is just part of the initial boot. The next screenshot shows that. The Active write counter is identical to Active as this is the period where Windows was writing zeroes.
VM Memory counters
I was curious to see how the VM memory utilization counter, as reported by the hypervisor, would change if I give the VM more RAM. I shut down the VM and increased the RAM to 8 GB. You can see from the following chart that Usage went up. The Usage counter will look different if you are using the metric from inside the Guest OS.
VM Memory counters
It is interesting to note that Active and Active write shoots up ahead of Entitlement and Granted during boot. Testing with another VM (VMware Log Insight 1.5, which is also based on SuSE Linux) led to the same behavior. This is not due to writing to the VM swap file, as the VM RAM reservation was set to maximum. This is normal behavior during VM boot, as the values drop after that to below Entitlement and Granted.
For Windows, you may see that Consumed shoots up ahead of Granted. As mentioned previously, Windows writes zeroes as it initializes the pages and vmkernel is smart enough to do a copy-on-write, so all the pages are pointing to the same physical page. This can result in the Consumed counter being higher than the Granted counter, as Granted only counts the physical page once. After a while, as the pages are replaced with actual data, the Granted counter will go up as each of the new pages is backed by large pages (common in Windows 2008 and Windows 7). The Granted counter tends to have a stable value as it only goes down if the host is under memory pressure.
We have talked about contention and utilization being the main areas you need to check. The following table summarizes the counters you should monitor:
|
Purpose |
vCenter |
vRealize Operations |
Description |
|---|---|---|---|
|
Contention |
CPU Swap Wait |
Contention (%) |
Memory Contention is based on CPU Swap Wait. |
|
Utilization (Cost Effective) |
Usage (%) |
In Use |
If you do not have EP Agent, use Workload (%) as the "lower" threshold and Consumed (KB) as the "upper" threshold. |
|
Utilization (Performance Optimized) |
Consumed (KB) |
In Use + Cache |
For the "upper" threshold. There is no Usage/Usable (%) metric at the VM level. |