Chapter 5, Capacity Monitoring, explains that VDI scope is wider than server workload. Besides the IaaS component, you need to monitor Windows VMs and the VDI servers. VDI is more than vSphere + Horizon. Here are the common areas that you need to monitor:

Components to monitor in VMware Horizon
This results in more dashboards and the need for additional monitoring tools and adapters. Let's look at two common use cases in this book.
vRealize Operations provides in-Guest visibility and application-specific counters for VDI. This enables you to track performance at more points. In fact, there are 12 metrics you can check to ensure that your DaaS platform is indeed serving the VDI user well.
The article at http://virtual-red-dot.info/12-kpis-for-high-performance-vdi covers the details, so we will summarize them here.
The 12 metrics used as KPIs are as follows:
|
Component |
Metric |
Threshold |
|---|---|---|
|
CPU |
Contention |
2% |
|
CPU |
Workload |
70% |
|
CPU |
Run Queue |
<3 |
|
RAM |
Available RAM |
500 MB |
|
RAM |
Committed RAM |
70% |
|
RAM |
Contention |
0% |
|
Network |
PCoIP latency |
200 ms |
|
Network |
PCoIP TX packet loss PCoIP RX packet loss |
1% |
|
Network |
PCoIP latency variance |
50 ms |
|
Disk |
Read latency Write latency |
15 ms |
|
Disk |
Queue length |
2 |
You are right to say that the table has 13 counters. vRealize Operations is not able to measure the Disk Queue Length yet.
Let's discuss some of the counters so that you know how they are used.
Let's look at the VM CPU workload. The pattern matches a typical office pattern. CPU was low from before 6:30 am until around 8 am.

VM CPU workload
At around 8 am, the CPU usage started to rise. A typical conclusion is that the user has logged in to the desktop and started doing some work. The CPU usage then had a short spike to less than 50 percent before 10 am. The user never demands a lot of CPU. The capacity we give to the user is sufficient.
But what about performance? Did we deliver the capacity that was asked?
We need to turn to VM CPU Contention to answer the question. The following screenshot shows the VM CPU Contention counter:

VM CPU Contention
The counter was low from around 6 am to around 9 am, as the user was not using the desktop yet. At around 9 am, the CPU Contention started to rise. It actually breached the performance SLA that you promised. Looking at this counter alone, you know that the VM was not served well in terms of CPU. At around 9:45 am, the VM was only asking for about 60% CPU, and yet, the Desktop as a Service (DaaS) was not able to deliver it. You need to reduce demand or increase physical capacity, as there is obviously a performance gap.
Let's now see an example where the DaaS is delivering its promised SLA. We will use memory in this example. The following screenshot shows the VM Memory Contention counter:

VM Memory Contention
The value is 0, indicating no contention. This is what we expect in an environment where the ESXi host is not under memory pressure. If you do not overcommit memory, the ESXi host will never have memory contention as there is enough for every VM.
It's a good thing that the DaaS platform is able to deliver its promise to the VM. But does the VM itself need more? We need to look inside Windows for that. One of the Windows counters is Committed RAM.
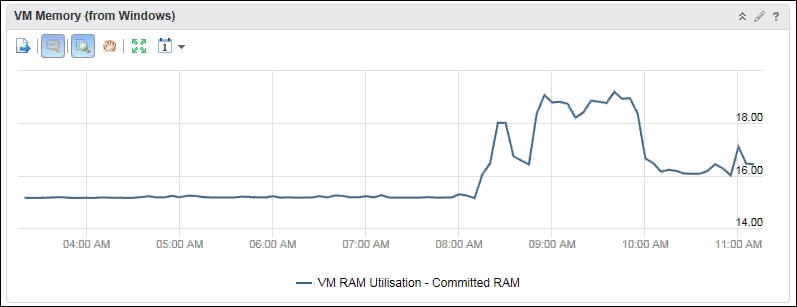
VM RAM Utilization
As we can see from the preceding graph, Windows did not need more than what was configured. We expected the number to hover around 50 to 70 percent, indicating that the configured RAM was sufficient.
Let's turn to storage now. Again, we see a similar usage pattern. We probably can conclude by now that the user started to use the VDI around 8 am. The disk latency was low before 8 am and started to rise afterwards. The good news is it remains healthy. It did exceed 10 milliseconds for 5 minutes for write latency, but the read was much lower at that time. So the overall latency is still below 10 milliseconds.

VM Disk Latency
Lastly, let's look at network. Chapter 4, Performance Monitoring, explains that we should monitor at the application layer (PCoIP in VDI case) and not the infrastructure layer (Windows or vSphere).
The following chart shows that both PCoIP Received and Transmit packet loss are within the healthy range. Healthy data at the application layer means there is no need to look at the infrastructure layer:
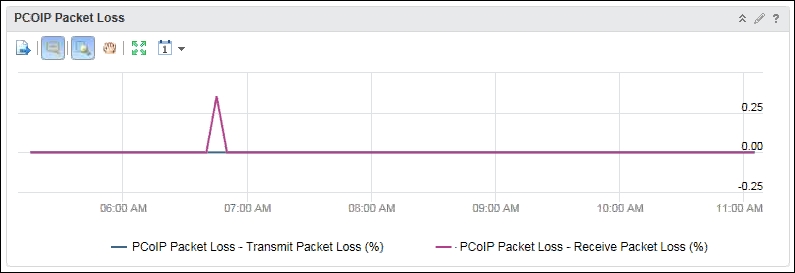
VM PCoIP packet loss
To complete the check, we should also look at the PCoIP latency. The number is again within the healthy range.

VM PCoIP latency
If there is a performance issue, the above 12-point check should give you the ability to narrow down where the issue is.
Chapter 7, Capacity-Monitoring Dashboards, explains how you can downsize large VMs that are overprovisioned. Let's now look at the opposite use case. We will also use VDI workload, as VDI starts with the minimum configuration and upsizes accordingly. VDI workload also differs from server workload.
Chapter 5, Capacity Monitoring, explains that RAM has different behavior than CPU. As a result, we need different counters for CPU and RAM.
Horizon View gives you visibility inside the Guest as it comes with an agent out of the box. The vRealize Operations agent for Horizon has been integrated into the base Horizon View agent.
The article at http://virtual-red-dot.info/which-vdi-user-needs-more-cpu-or-ram/ has the details for both CPU and RAM. The following is an example of the result. The View widget shows the users along with the key RAM metrics.

VM memory usage
You need to know when to use this View widget. In a VDI environment, there are regular non-user-generated workloads that impact all users. Examples are full AV scans and Windows patches. You should manually exclude the time, as it impacts the result. For example, you typically run the full scans and perform Windows patches on weekends. If you run the preceding list on a Friday, you can go back 5 days but no longer than that.