
vCenter does not provide a lot of memory counters at the cluster level. From the following performance chart dialog box, you can see that the number of counters drops to just five. Counters related to contention, such as Compression, Swap, and Latency, are no longer available. The Latency counter would be especially useful to track at the cluster level if you had a large environment.

Cluster memory counters in vCenter
The data is not available in real time. This means the data granularity is at 5-minute intervals, not 20 seconds. As the rollup is an average, it means any spike within a 5-minute period may not be visible. In practice, however, most performance problems would still likely be detectable with 5-minute data points.
The counters do not take HA into account. For example, the Total counter sums all the host physical memory.
The Consumed memory does not take into account the host memory. So the memory used by vmkernel is not included. This is practically negligible as most ESXi hosts sport more than 128 GB of RAM.
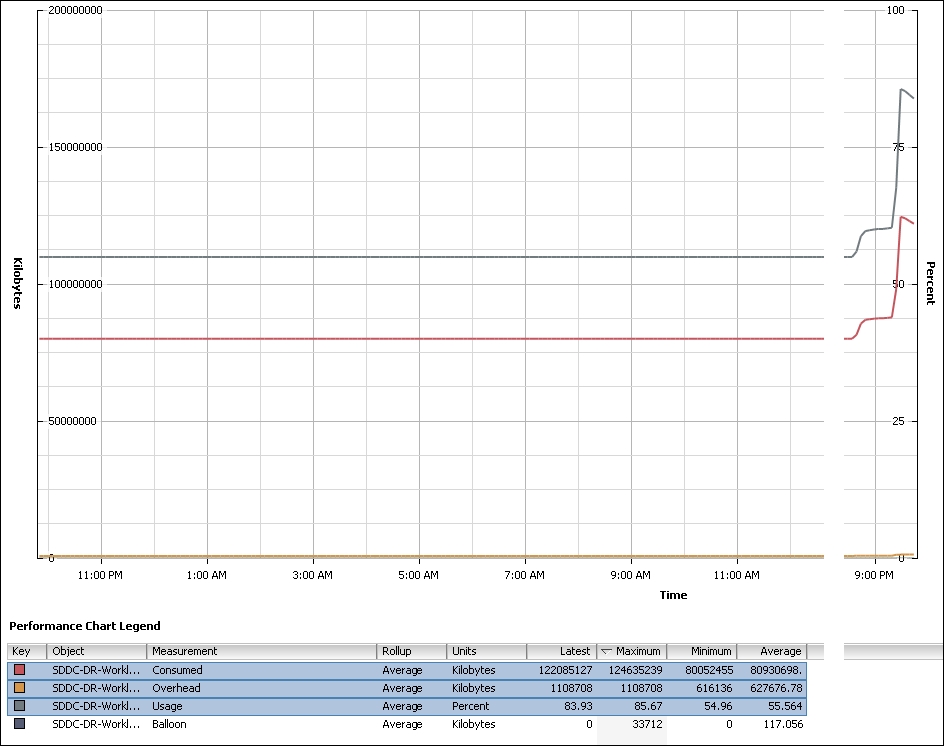
Cluster memory counters in vCenter
Unlike the other counters, which just sum up each host in the cluster, the Usage counter is an average of all hosts. So if a large cluster (more than eight nodes) has an unbalanced RAM utilization, you may not see a high value. You can create a super metric that tracks the maximum RAM among all the hosts in the cluster. You can then plot this chart together with the Cluster average chart. This will give you both the average and the peak.
The Usage (%) and Usage/Usable (%) counters provide the same data. The following screenshot shows that they are identical over a period of one week:
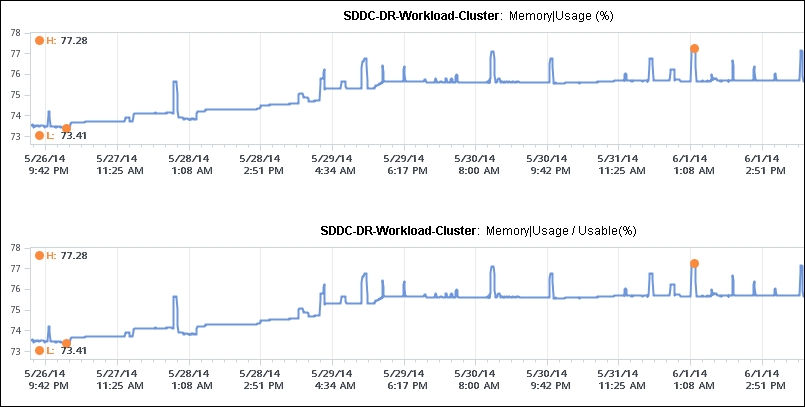
Cluster memory – Usage versus Usage/Usable
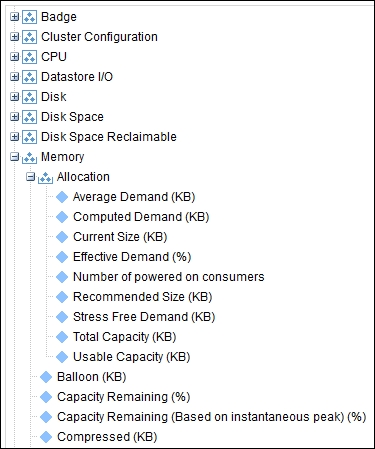
vRealize Operations provides a richer set of counters at the cluster level. Refer to Chapter 11, SDDC Key Counters, as the approach is similar for memory. The following table lists the key counters.
The Workload counter uses active memory, while the Usage counter uses consumed memory. Therefore, we consider them to be the lower and upper limits, respectively:
|
Purpose |
Counters |
Roll up |
Description |
|---|---|---|---|
|
Contention |
Contention (%) |
Average |
As it is an average, you should complement it with a super metric that is based on the peak contention of a member host |
|
Utilization |
Workload (%) |
Average |
For the "lower" threshold |
|
Utilization |
Usage/Usable (%) |
Average |
For the "upper" threshold |
We perform capacity management at the vSphere Cluster level. vRealize Operations provides metrics that help you in determining the cluster capacity. For example, you normally exclude the HA buffer in your capacity calculation. This can be a challenge if you have more than one HA policy. vRealize Operations provide a counter that tracks the usable memory after taking into account HA. The counter is named Usable Capacity (KB). Its value is in KB, so you need to convert to GB.
vRealize Operations also provides the total capacity available. In the following example, I have plotted both counters. This is a four-node cluster, where each host has 192 GB of RAM. We have set the cluster HA settings to the popular 1 host.
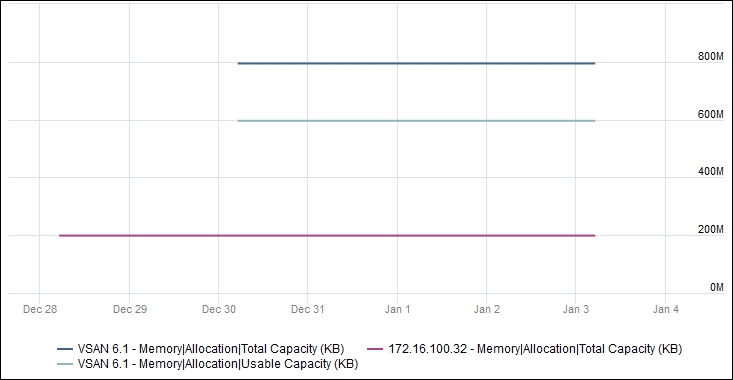
To see the actual value, we list the individual metrics. Do you notice that the numbers are a little different?
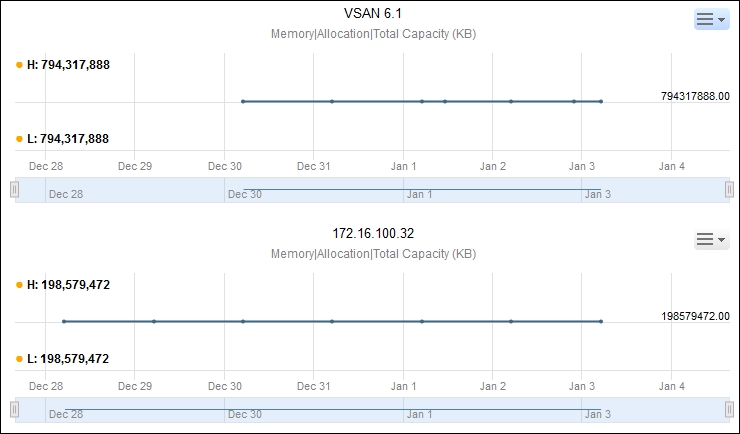
198,579,472 KB is not exactly 192 GB. It is around 189 GB. That small amount of memory is not considered. I checked the values on ESXi hosts ranging from 36 GB to 192 GB. For a small ESXi with 36 GB of RAM, the value is less than 1 GB. For a 64-GB ESXi, the value is 1.3 GB.