vCenter 6.0 Update 1 provides even more counters at the ESXi level: 38 counters for RAM plus 11 for vmkernel RAM. The vmkernel has around 50 processes that are tracked. As a result, a cluster of 8 ESXi can have over 800 counters just for ESXi RAM!
The counters are shown in the next screenshot. Most of them are not shown as a percentage, making it difficult to compare across ESXi hosts with different memory sizes.
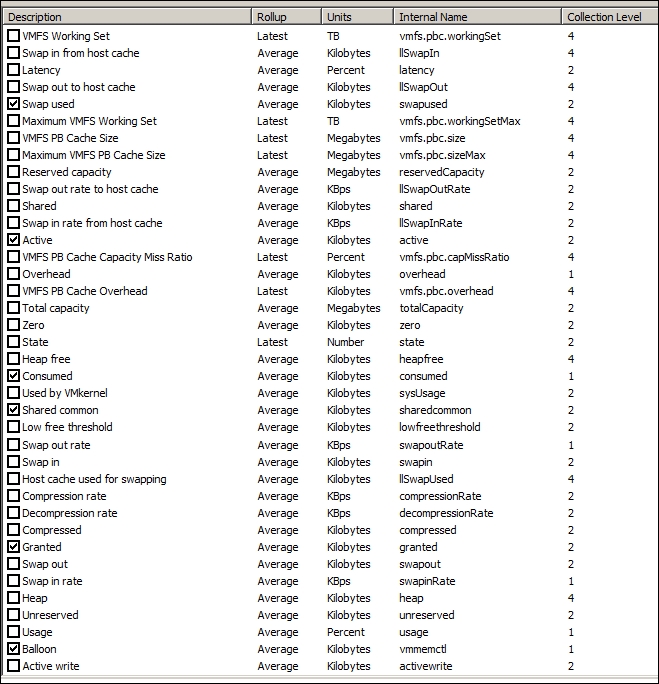
ESXi – RAM counters
As for the vmkernel processes, they are not shown under the Memory group, but under the System group. In most cases, you do not need to track the CPU or RAM consumed by the kernel processes. We have covered them in Chapter 13, Memory Counters, so we will not repeat that here. From the following chart, you can see that the vmkernel takes up negligible memory:
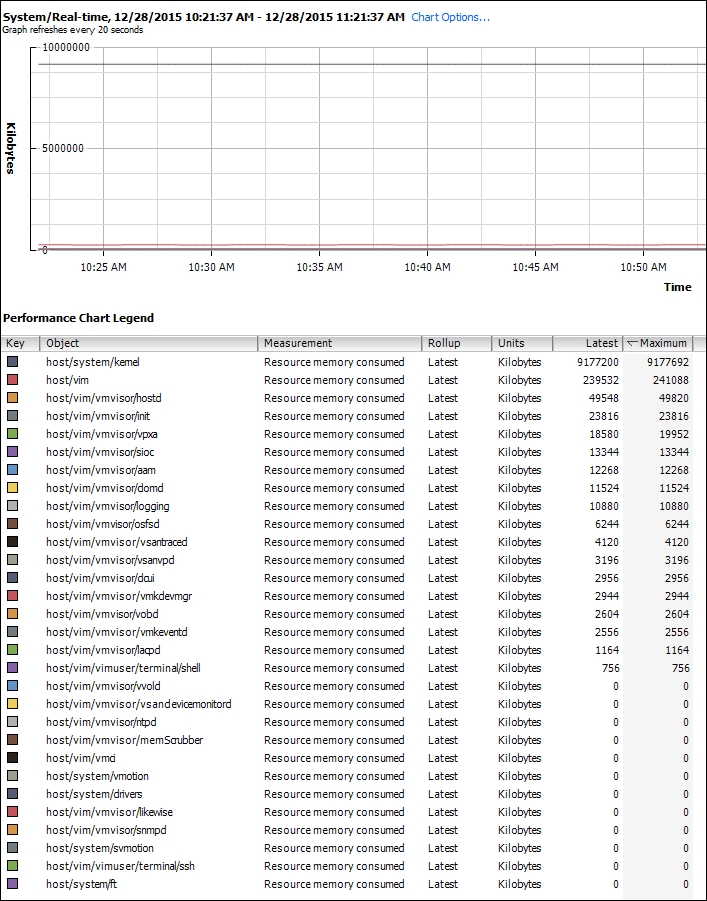
ESXi kernel memory utilization
If you need to track the memory consumption of vmkernel, vRealize Operations provides two counters, as shown next:
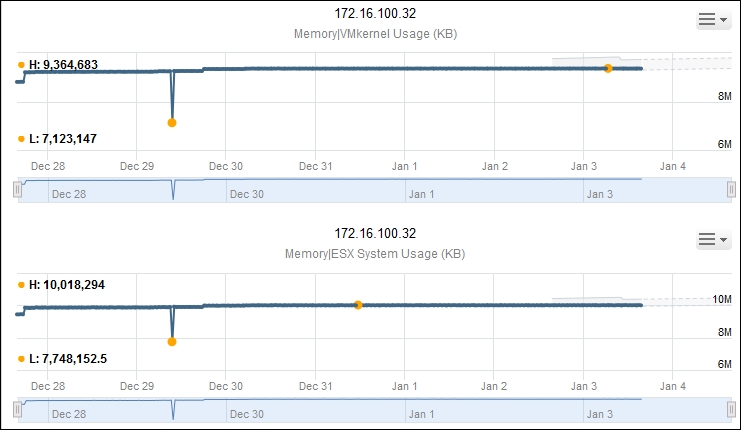
VMkernel Usage and ESX System Usage track kernel utilization.
Just like in the case of VM, vCenter Server does not provide a counter for Contention for ESXi. You check the same set of counters for a sign of contention, which are Balloon, Swapped, Compression, and Latency. You should also check for CPU Swap Wait, as that counter tracks when the CPU is waiting for memory.
We know that contention happens at the hypervisor level, not at the VM level. The VM is feeling the side effects of the contention, and the degree of contention depends on each VM's shares, reservation, and utilization. ESXi begins taking action if it is running low on free memory. This is tracked by a counter called State. The State counter has five states:
- High
- Clear
- Soft
- Hard
- Low
ESXi uses this to trigger when it reclaims memory from VM. Unless you are deliberately aiming for high utilization, all the ESXi hosts should be in the high state. The spare host you add to cater for HA or maintenance mode will help in lowering the overall ESXi utilization. The value of the high state is 0, so you can create a super metric that tracks the maximum value of all the hosts across your entire data center.
Having said that, just because the host is low on free physical RAM does not mean that the VMs are performing poorly. Even the presence of swapping out does not mean VMs are performing poorly when the swapped memory is not being accessed by the OS.
Poor VM performance only happens when the VM experiences swap in or decompression. The State counter indicates that free memory is running low on the host, and the host is proactively making free more physical RAM to reallocate as requested by the VMs.
The Low free threshold (KB) counter provides information on the actual level below which ESXi will begin reclaiming memory from VM. This value varies in hosts with different RAM configurations. Check this value only if you suspect that ESXi triggers ballooning too early. You should not be seeing this behavior with the changes in ESXi 5.0 onwards. It uses an algorithm that results in a lower threshold on ESXi hosts with large RAM configurations. Without this, an ESXi with 256 GB of RAM would see the occurrence of ballooning when 15.3 GB (6 percent) of RAM is still available. With this sliding scale, the threshold would be around 3.3 GB, a more reasonable number.
In the next screenshot, the threshold is sitting at around 1 GB for an ESXi with 48 GB of RAM.
Note
For more information, check out this post by Frank Denneman http://blogs.vmware.com/vsphere/2012/05/memminfreepct-sliding-scale-function.html.
The screenshot also shows 0 ballooning, which is a sign that the ESXi host has no memory pressure. Latency is also 0, which means it has not accessed memory that is swapped or compressed.
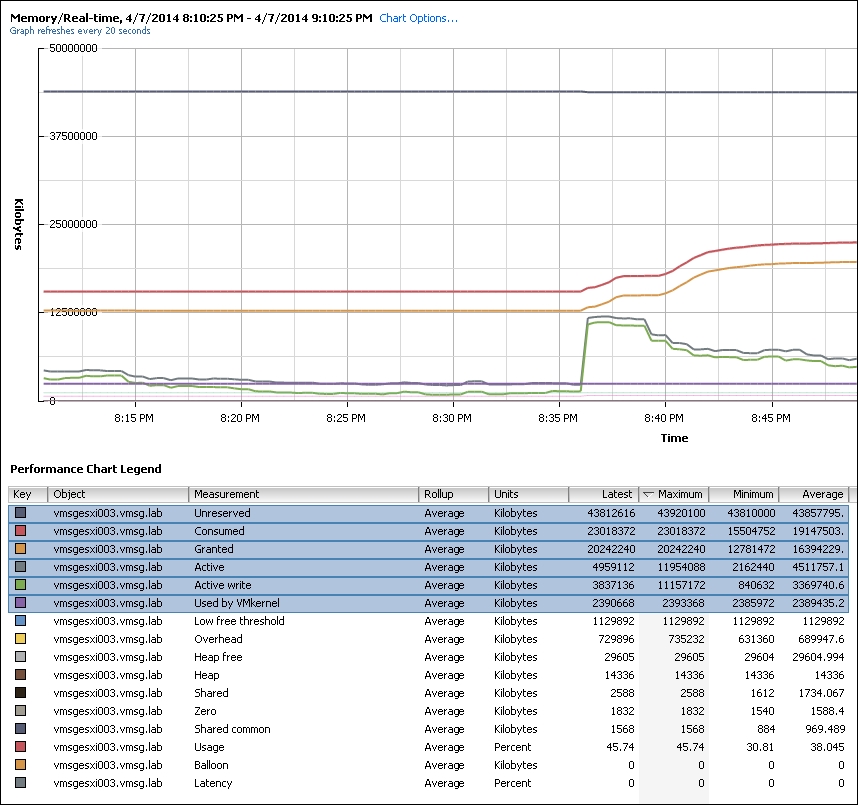
ESXi Memory counters
At the ESXi level, Contention (%) is the aggregate of all its VM Contention (%) counters. The next screenshot shows this relationship. In this ESXi host, the only VM experiencing contention is the SDDC-vESXi-02 VM. No other VMs are experiencing contention. So, the pattern reflects this at the ESXi level, with a much lower value at the ESXi level. To complete the picture, the contention happened because ESXi had high memory utilization. The usage suddenly went up from a stable 88 percent to 92.52 percent, triggering ESXi to free up memory:
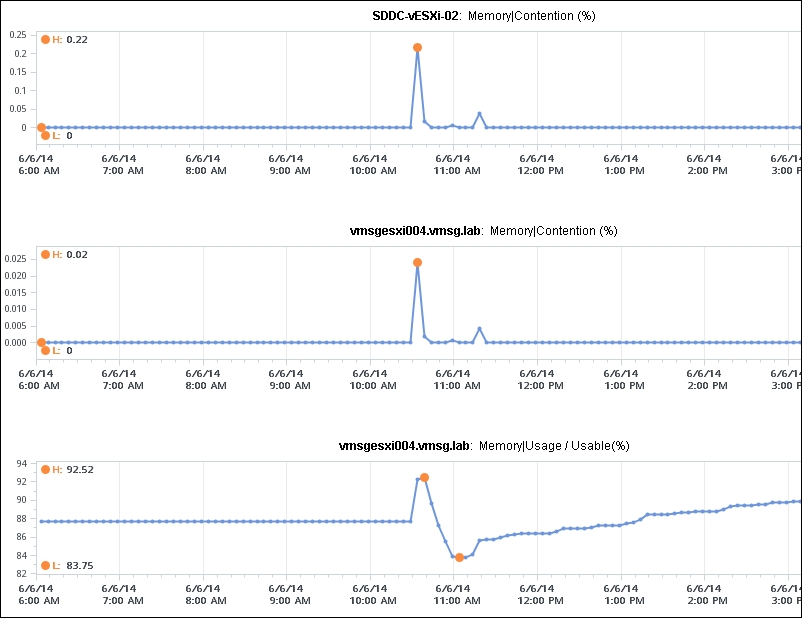
Memory Contention and host Memory Usage
vCenter provides Active (KB), Active write (KB), Consumed (KB), Granted (KB), and Usage (%) for utilization. Granted at the host is the total of the granted counters of VMs running on the host. It includes the shared memory. Consumed is the amount of memory used on the host. It includes both VM memory and hypervisor memory, so it is slightly higher than Granted. In other words, Consumed = Total host memory - Free host memory.
You should check both Active (KB) and Usage (%) to give you the average and peak utilization. Active would give you the average while Usage (%) indicates the peak. If you have a lot of applications that need to manage their own memory (for example, JVM and database), then you would gravitate toward Usage (%). If not, you would gravitate towards the Active counter. Just like the situation with VMs where vRealize Operations provides a new counter called Demand, vRealize Operations also has the Demand counter at ESXi level. It is called Machine Demand (KB).
The Workload counter translates Machine Demand into percentage, making it possible to compare it with Usage (%). As you can see in the following chart, plotting them on the same chart gives you the range of memory utilization:
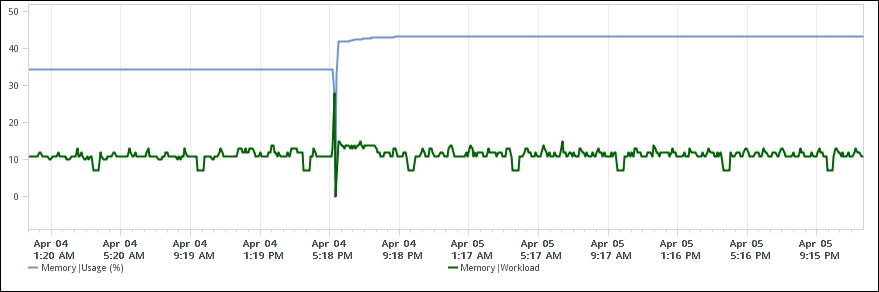
ESXi Memory – Usage versus Workload
Memory shared is the sum of all the VM memory pages that are pointing to a shared page. Memory shared common is the sum of all the shared pages. As a result, Memory shared common is at most half the value of Memory shared, as sharing means at least two blocks are pointing to the shared page. If the value is a lot less than half, then you are saving a lot. Today's ESXi hosts sport hardware-assisted memory virtualization from Intel or AMD. With this technology, vmkernel uses large pages to back the VM memory. As a result, the possibility of shared memory is low, unless the host memory is highly utilized. In this state, the large pages are broken down into small, shareable pages. So you can also use the Memory shared common counter to track for signs of host memory under pressure.
The Heap counter shows the memory used by the vmkernel heap and other data. This is normally a constant and small value. In some hosts with 48 to 64 GB of RAM, we see that the heap size has a constant value of 14 MB, which is negligible.
The Total capacity counter is not the same as the total RAM in the host. Generally speaking, we find it to be around 98 percent of the host physical RAM. For example, on a host with 64 GB of physical RAM, the Total capacity counter will report around 62.6 GB. vRealize Operations provides a metric called Provisioned Memory (KB), which will show you the actual configured RAM (64 GB in this example).
Reserved Capacity (MB) only counts reservation. Therefore, the value will be a lot lower than the total capacity, as most customers do not use reservation. It also includes memory reserved by the vmkernel, which should be less than 0.5 GB and hence negligible.
Let's take a look at one example of how partial information can be misleading in a troubleshooting scenario. It is common for customers to invest in an ESXi host with plenty of RAM. 256 to 512 GB of RAM is becoming common. One reason behind this is the way vCenter displays information. In the following screenshot, vCenter is giving an alert. The host is running on high memory utilization. The screenshot does not show the other host, but you can see that it has a warning, as it is high too. The screenshots are all from vCenter 5.0 and vRealize Operations 5.7, but the behavior is still the same in vCenter 6 Update 1. vRealize Operations 6.1 onwards shows both Memory Consumed and Active.
I'm using vSphere 5.0 and vRealize Operations 5.x to show the screenshots in order to provide an example of the point stated earlier, which is the rapid change of SDDC.
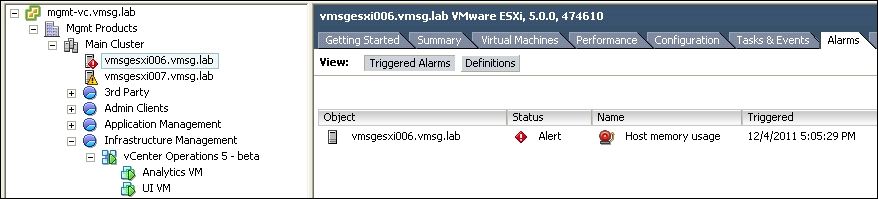
vSphere 5.0 – Memory Alarm
The first step is to check whether someone has modified the alarm by reducing the threshold. The next screenshot shows that utilization above 95 percent will trigger an alert, while utilization above 90 percent will trigger a warning. The threshold has to be breached by at least 5 minutes. The alarm is set to a suitably high configuration, so we will assume the alert is genuinely indicating a high utilization on the host.
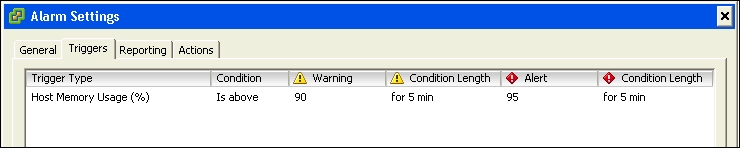
vSphere 5.0 – Alarm Settings
Let's verify the memory utilization. We need to check both the hosts as there are two of them in the cluster. Both are indeed high. The utilization for vmsgesxi006 has gone down in the time taken to review the Alarm Settings tab and move to this view, so both hosts are now in the Warning status.
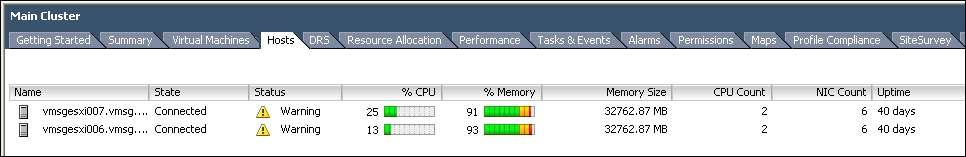
vSphere 5.0 - Hosts tab
Now, we will look at the vmsgesxi006 specification. From the following screenshot, we can see it has 32 GB of physical RAM, and RAM usage is 30747 MB. It is at 93.8 percent utilization.
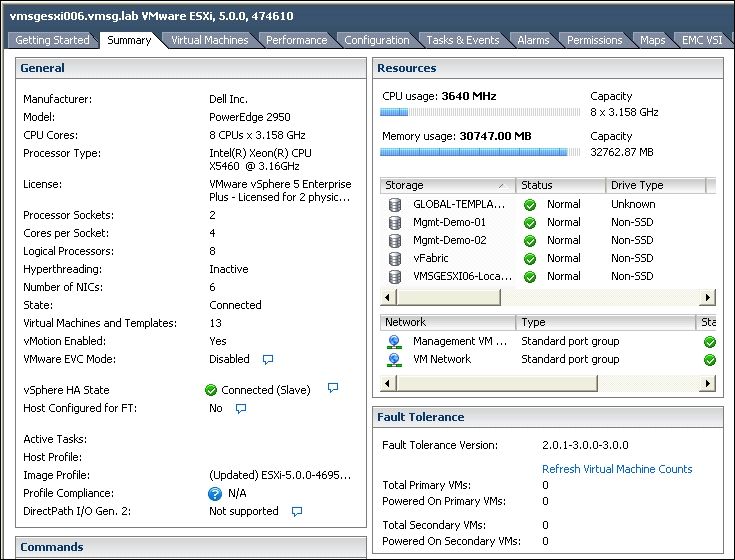
vSphere – the Host Summary page
Since all the numbers shown in the preceding screenshot are refreshed within minutes, we need to check with a longer timeline to make sure this is not a one-time spike. So, let's check for the last 24 hours. The next screenshot shows that the utilization was indeed consistently high.
For the entire 24-hour period, it was consistently above 92.5 percent, and it hit 95 percent several times. So this ESXi host was indeed in need of more RAM.
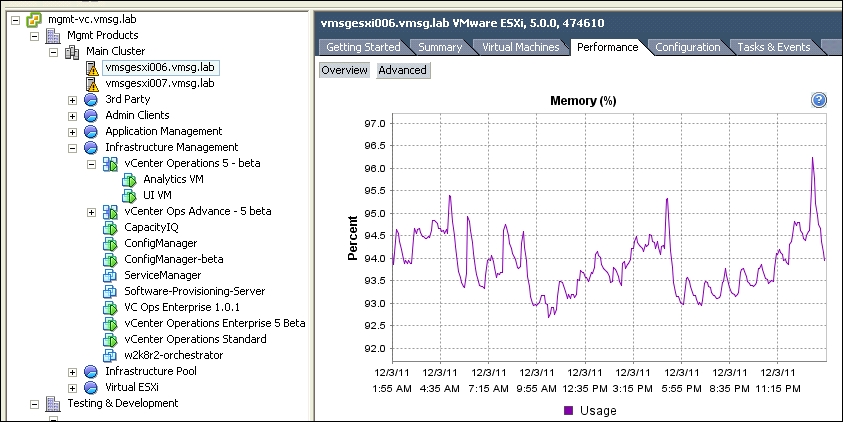
ESXi Memory – very high usage for 24 hours
Deciding whether to add more RAM is complex; there are many factors to be considered. There will be downtime on the host, and you need to do it for every host in the cluster since you need to maintain a consistent build cluster-wide. Because the ESXi is highly utilized, we should increase the RAM significantly so that it can support more or larger VMs. Buying bigger DIMMs may mean throwing away the existing DIMMs, as there are rules restricting the mixing of DIMMs. Mixing DIMMs also increases management complexity. The new DIMMs may require a BIOS update, which may trigger a change request. Alternatively, the larger DIMMs may not be compatible with the existing host, in which case we may have to buy a new box. So a RAM upgrade may trigger a host upgrade, which is a larger project.
Before jumping in to a procurement cycle to buy more RAM, let's double-check our findings. It is important to ask what the host is used for and who is using it.
In this example scenario, I know the environment well. This is the VMware ASEAN lab, which I have managed for the past few years.
Let's check out the memory utilization again, this time with the context in mind. Can you see the possibility of over-reporting here?
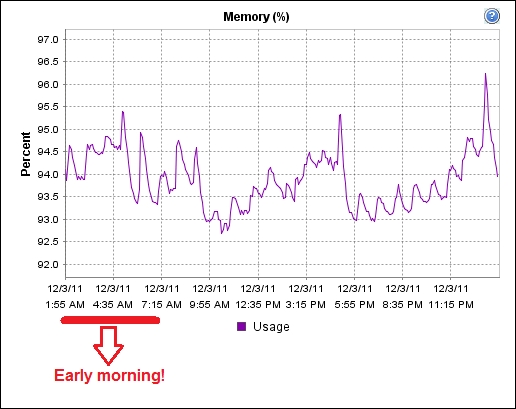
ESXi Memory – very high usage when no one was using the lab
The preceding graph shows high memory utilization over a 24-hour period, yet no one was using the lab in the early hours of the morning!
ESXi Memory counters
We will now turn to vRealize Operations for an alternative view. The following diagram from vRealize Operations 5 (not 6.1) tells a different story:
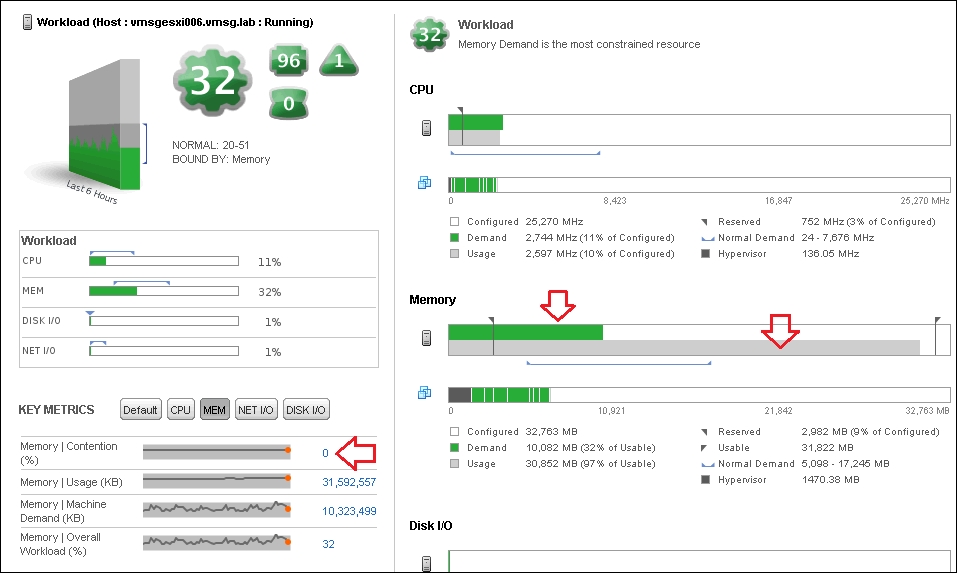
vRealize Operations 5 – the Host Details page
CPU, RAM, disk, and network are all in the healthy range, as you can see in the Workload area. Specifically for RAM, it has 97 percent Usage but 32 percent Demand. Note that the Memory chart is divided into two parts, as shown by the two red arrows. The upper bar shows the Memory Demand, while the lower bar shows the Memory Usage counter.
On the bottom left, note the Key Metrics section. vRealize Operations 5 shows that Memory | Contention is at 0 percent. This means none of the VMs running on the host is contending for memory. They are all being served well!
vRealize Operations 5 uses a different counter than vCenter. vRealize Operations 6.1 changes this and aligns itself with vCenter. Neither approach is wrong, actually. You need both metrics to tell you the full picture, as that's the nature of two-level memory management.
Just because a physical DIMM on the motherboard is mapped to a virtual DIMM in the VM does not mean it is actively used (read or write). You can use that DIMM for other VMs and you will not incur (for practical purposes) performance degradation. It is common for Windows to initialize pages on boot with zeroes but never use them subsequently.
Not all performance management tools understand this vCenter-specific characteristic. They would have given you a recommendation to buy more RAM.
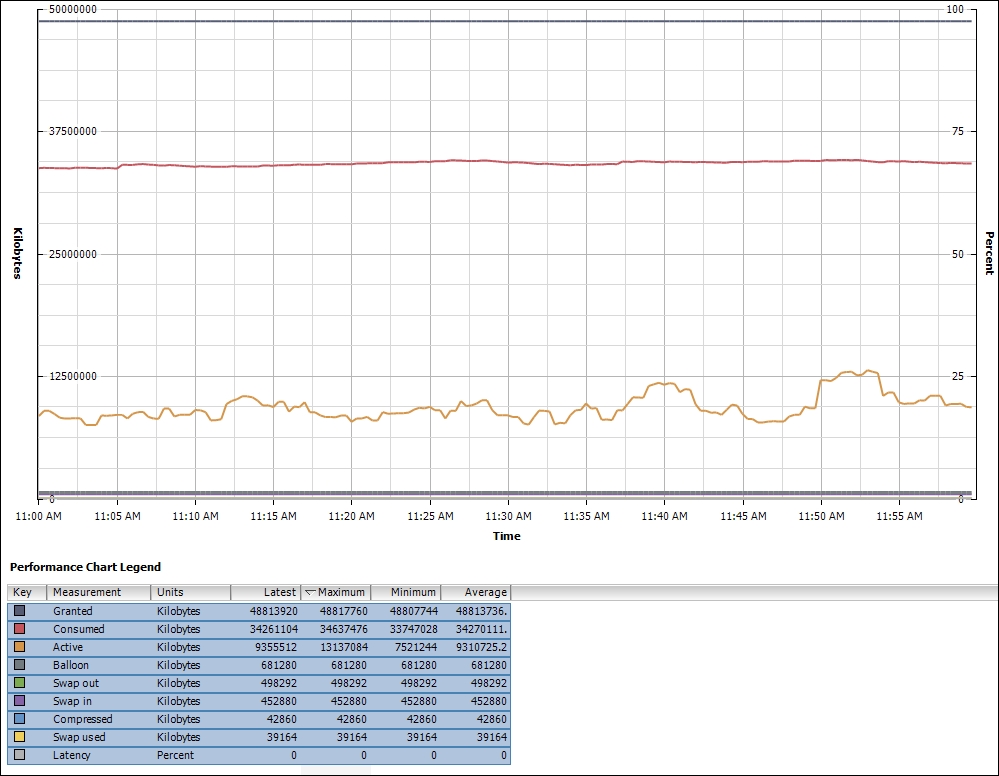
We saw earlier that the behavior remains the same in vCenter 6.0 Update 1. The next screenshot shows the counters provided by vCenter 6.0. This is from a different ESXi host, as I want to provide you with a second example.
vCenter 6.0 Update 1 memory counters
This ESXi 6 host has 64 GB of RAM. Memory Consumed is stable at around 50 GB. Memory Active is much lower at 8 GB.
Notice that the ballooning is 0, so there is no memory pressure for this host. You might notice that swap out and and swap in are not 0. The value of Memory Compressed is also not 0. But the value of Memory Balloon is 0. Can you explain what's going on here?
The clue is in the rate counters. I have shown all the four rate counters (Swap out rate, Swap in rate, Decompression rate, and Compression rate). They are all 0. The memory pressure happened in the past and is no longer happens during the time of reporting.
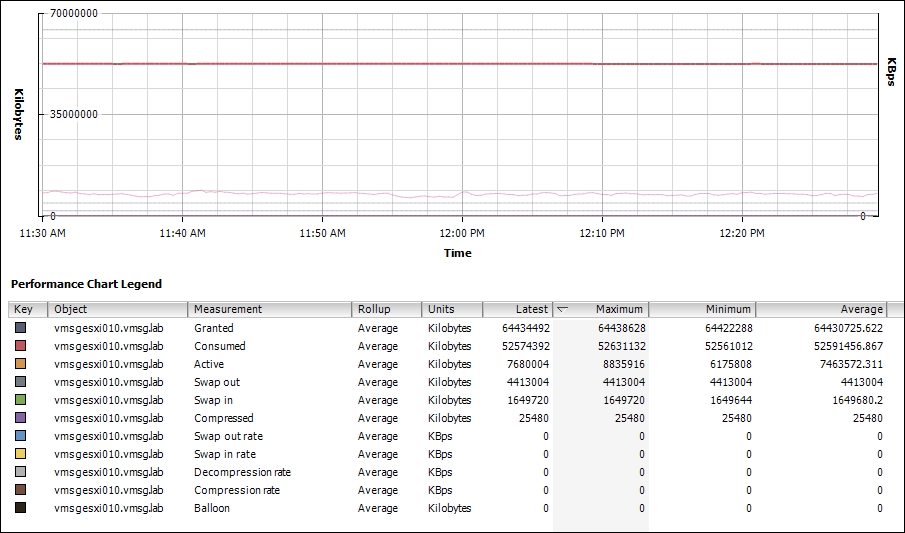
Let's take an example to see where a memory pressure issue happens. The following chart shows an ESXi 6 Update 1 system. It has 64 GB of RAM, as shown with the Provisioned Memory counter.
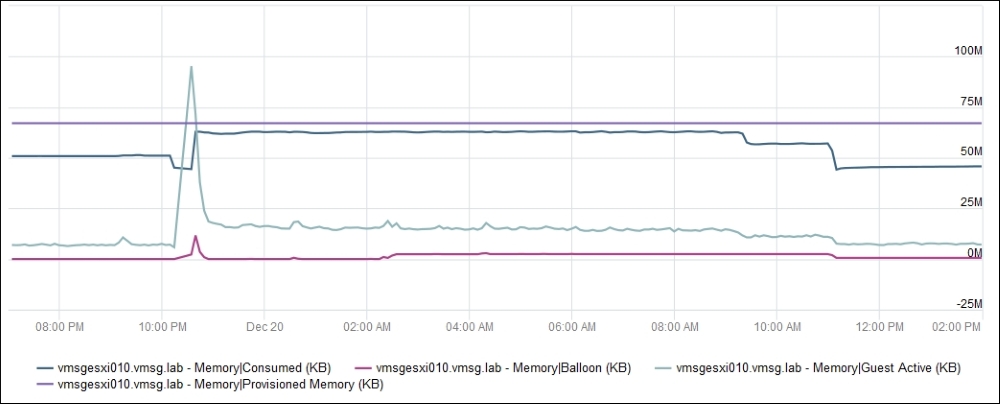
ESXi Memory counters
At around 10 pm, a lot of VMs were provisioned. The Guest Active Memory went above the physical resource. As you can expect, the ESXi was under memory pressure, and its memory consumed rose. ESXi certainly uses techniques such as transparent page sharing. As the memory consumed rose to near the provisioned RAM, ESXi activated the ballooning process.
Once the memory pressure was reduced, the ballooning process stopped. The consumed memory remained at its level as there was no need to remove pages that were mapped to physical DIMMs, as there was no new request.
For further information on this topic, review Kit Colbert's presentation on memory in vSphere at VMworld 2012. The content is still relevant for vSphere 6. The title is Understanding Virtualized Memory Performance Management and the session ID is INF-VSP1729. You can find it at http://www.vmworld.com/docs/DOC-6292.
We talked about contention and utilization being the main areas you should check. The following table summarizes the counters you should monitor at the host level for RAM:
|
Purpose |
vCenter |
vRealize Operations |
Description |
|---|---|---|---|
|
Contention |
CPU Swap Wait |
Contention (%) |
Memory Contention is based on CPU Swap Wait |
|
Utilization |
Active (KB) |
Workload (%) |
For the "lower" threshold |
|
Utilization |
Usage (%) |
Usage/Usable (%) |
For the "upper" threshold |