vCenter 6.0 only provides three CPU counters at the cluster level (as shown in the next screenshot):
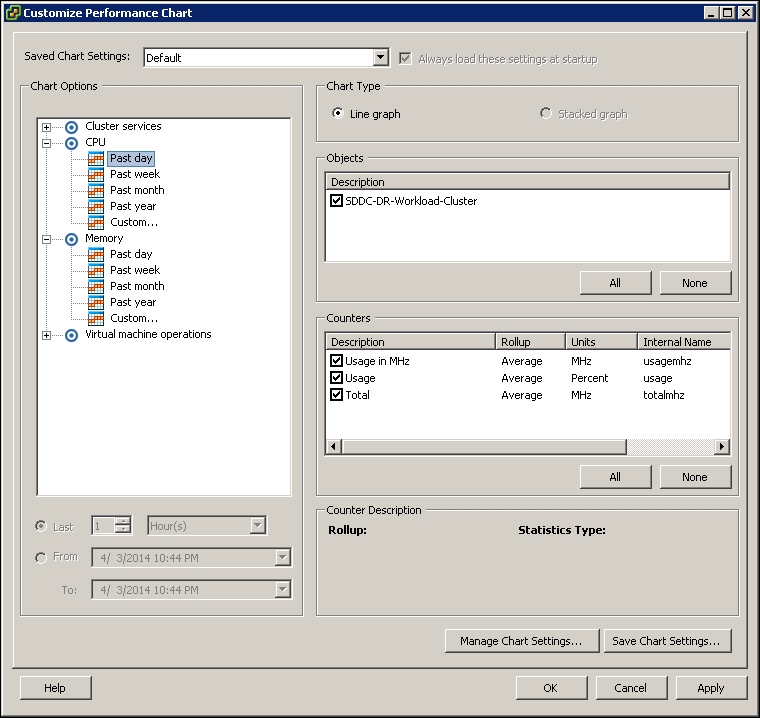
Cluster CPU counters provided by vCenter
- CPU Usage (MHz)
- CPU Usage (Percent)
- Total (MHz)There is no storage or network metric group provided. Also, the data is not available in real time, meaning that the data granularity is in intervals of 5 minutes, not 20 seconds.
Let's look at an example of the values of the two usage counters. I've excluded the Total metric from the next screenshot, as you would not be able to see the fluctuation in the Usage in MHz counter if it were included.
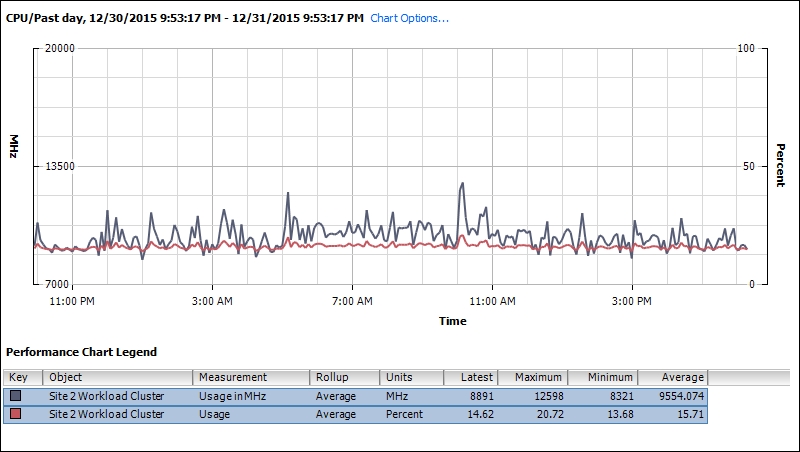
Cluster CPU Usage counters
The Total counter is a relatively static counter. It does not take into account vSphere HA. Changing the cluster HA setting does not impact this value. However, it does seem to take into account CPU power management. For example, we are getting a total value of 56 GHz, whereas the actual total is 63 GHz. I checked with a cluster with identical configuration (hardware and CPU power management), and the values differed slightly.
vRealize Operations provides a richer set of CPU counters at the cluster level. They are useful as performance and capacity management should be done at cluster level. A majority of the counters are an average or a sum of all host members. There are no peak counters. This makes sense, as DRS will balance your cluster. However, in situations where the overall cluster has low utilization, you can have an unbalanced distribution. This also makes sense, as balancing it does not necessarily result in improved performance. Having a peak counter in this case is useful, as the average will not tell the full story.
As a result, you should track both average and peak. In addition, you should track both the contention and the utilization. This means that you are tracking four data points. Together, the four points should give you good insight into the performance of your environment. The next table lists the key counters that give you these four data points. It shows you the vRealize Operations and cluster counters.
|
Purpose |
Counters |
Roll up |
Description |
|---|---|---|---|
|
Contention |
Contention (%) |
Average |
Use a super metric to get the peak. |
|
Utilization |
Workload (%) |
Average |
Use a super metric to get the peak. This does not take into account HA. The workload will be higher if an HA event occurs. |
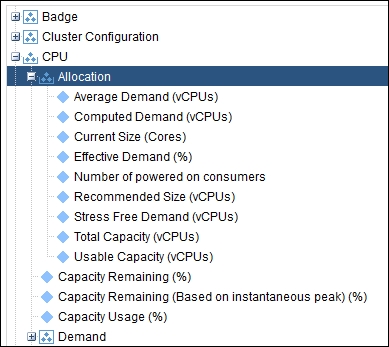
We perform capacity management at the vSphere Cluster level. vRealize Operations provides metrics that help you in determining the cluster capacity.
For example, you normally exclude the HA buffer in your capacity calculation. This can be a challenge if you have more than one HA policy. vRealize Operations provides a counter that tracks the usable CPU after taking into account HA. The counter is named Usable Capacity (vCPU), and can be found as shown here:
vRealize Operations also provides the total capacity available. In the following example, we have plotted both counters. This is a four-node cluster, where each host has 16 cores and 32 threads. We have set the cluster HA settings to the popular 1-host setting:
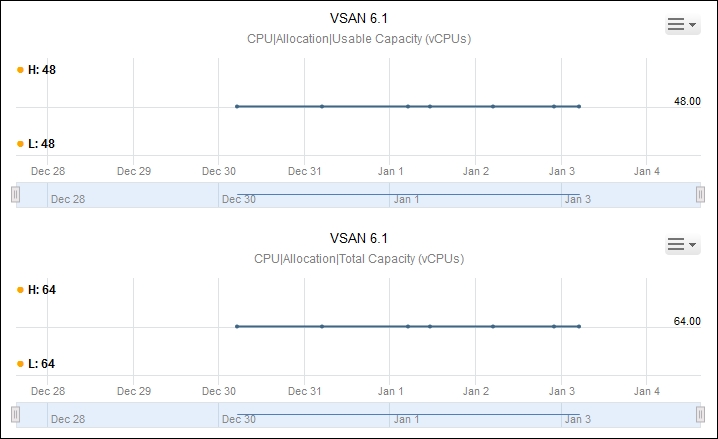
As you can see from the graphs, the counters count the cores, not the threads. They do not take into account HT.
The same functionality is also provided for memory.