I have explained what Part 3 covers, so let's begin the journey into the wonderful world of counters.
In this chapter, we will start Part 3 by covering the following:
- Counters related to compute (CPU and RAM)
- Counters related to storage
- Counters related to network
- All metric groups in vCenter and vRealize Operations
The following diagram shows how a VM gets its resources from ESXi. It is a pretty complex diagram, so let me walk you through it. We are using RAM as the example, although the concept applies to CPU too:
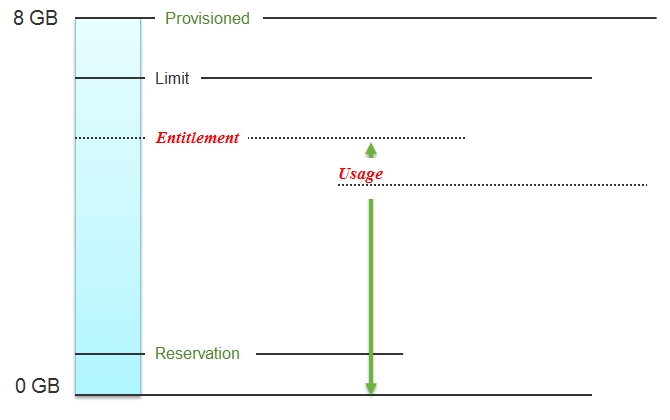
How a VM gets its resources
The tall rectangular area represents a VM. Say this VM is given 8 GB of virtual RAM. The bottommost line represents 0 GB and the topmost line represents 8 GB. The VM is configured with 8 GB of RAM. We call this Provisioned. This is what the Guest OS sees, so if it is running Windows, you will see 8 GB of RAM when you log in to Windows.
Unlike a physical server, you can configure a Limit and a Reservation in a VM. This is done outside the Guest OS, so Windows or Linux does not know. You should minimize the use of Limit and Reservation as it makes SDDC operations more complex.
Entitlement means what the VM is entitled to. In this example, the hypervisor entitles the VM to a certain amount of memory. I have not shown a solid line and used an italic font style to mark that Entitlement is not a fixed value but a dynamic one determined by the hypervisor. It varies every minute, determined by the Limit, Entitlement, and Reservation of the VM itself and any shared allocation with other VMs running on the same host.
Obviously, a VM can only use what it is entitled to at any given point of time, so the Usage counter cannot go higher than the Entitlement counter. The green line shows that Usage ranges from 0 to the Entitlement value.
In a healthy environment, the ESXi host has enough resources to meet the demands of all the VMs on it with sufficient overhead. In this case, you will see that the Entitlement, Usage, and Demand counters will be similar to one another when the VM is highly utilized. This is shown by the green line, on which Demand stops at Usage and Usage stops at Entitlement.
The numerical value may not be identical, because vCenter reports Usage in percentage, and it is an average value of the sample period. vCenter reports Entitlement in MHz and it takes the latest value in the sample period. It reports Demand in MHz and it is an average value of the sample period. This also explains why you may see Usage a bit higher than Entitlement in highly utilized vCPUs. If the VM has low utilization, you will see that the Entitlement counter is much higher than Usage.
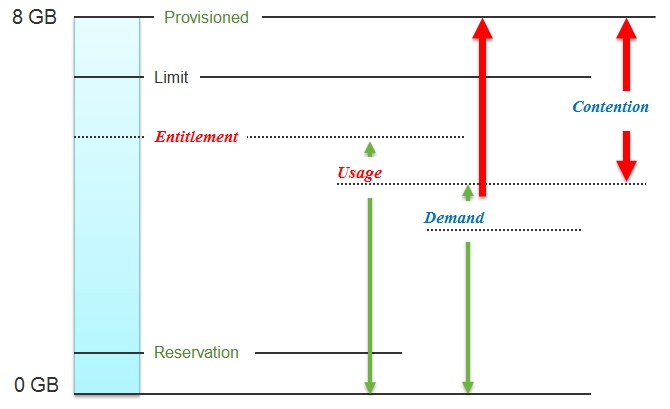
How Contention relates to Demand and Usage
An environment in which the ESXi host is resource-constrained is unhealthy. It cannot give every VM the resources they ask for. The VMs demand more than they are entitled to use, so the Usage and Entitlement counters will be lower than the Demand counter. The Demand counter can go higher than Limit, naturally. For example, if a VM is limited to 2 GB of RAM and it wants to use 5 GB, then Demand will exceed Limit. Obviously, Demand cannot exceed Provisioned. This is why the red line stops at Provisioned, because that is as high as it can go.
Conceptually, Contention is Demand minus Usage. Mathematically, the actual formula is more complex than this.
If the Contention is zero, the VM gets to use everything it demands. This is the ideal level, as performance will match the physical world. This Contention value is required to demonstrate that the infrastructure provides a good service to the application team. If a VM owner comes to see you and says that your shared infrastructure is unable to serve her VM well, the VM Contention counter is your defense mechanism.
The Contention counter should become a part of your SLA or Key Performance Indicator (KPI). It is not relevant for tracking utilization. When there is contention, it is possible that both her VM and your ESXi host have low utilization, and yet the VM performs poorly.
This typically happens when the VMs are relatively large compared to the ESXi host. Let's take a simple example to illustrate this. I will use the CPU component of compute this time around. The ESXi host has two sockets and 20 cores. Hyper-Threading is not enabled in order to keep this example simple. You run just two VMs, but each VM has 11 vCPUs. As a result, they will not be able to run concurrently. The hypervisor will schedule them sequentially as there are only 20 physical cores to serve 22 vCPUs. Here, both VMs will experience high contention.
Hold on! You might say, "There is no Contention counter in vSphere and no memory demand counter, either."
This is where vRealize Operations comes in. It doesn't just regurgitate the values in vCenter. It has implicit knowledge of vSphere and a set of derived counters with formulae that apply that knowledge.
Before we go into the metrics, you need to have an understanding of how the vSphere CPU scheduler works. The following diagram shows the various states that a VM can be in:
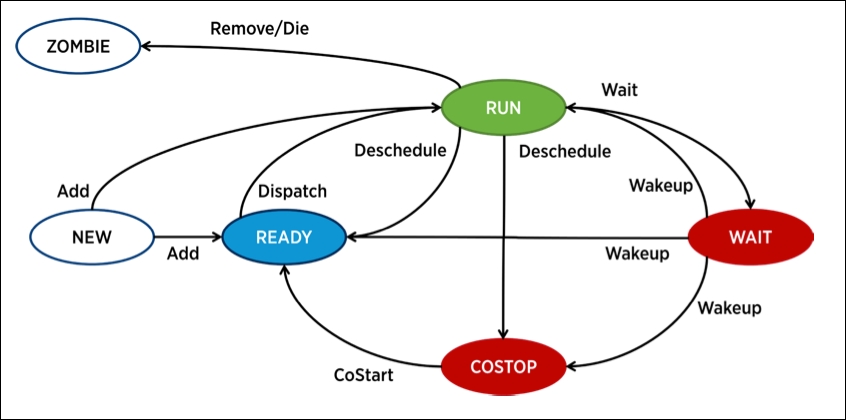
VM: CPU states
The preceding diagram is taken from a performance study called The CPU Scheduler in VMware vSphere 5.1 (http://www.vmware.com/resources/techresources/10345). This whitepaper documents the CPU scheduler for VMware administrators. While it is written for vSphere 5.1, it is highly relevant for vSphere 6.0 Update 1. Read this paper as it will help you explain to your customers (the application team) how your shared infrastructure juggles all those VMs at the same time. It will also help you pick the right counters when you create your custom dashboards in vRealize Operations.