The previous chapter described how to set up and configure Nagios. Now, that our system is up and running, it will also send out notifications to people if something goes wrong. What we need now is a way to be able to view the current and historical information about the hosts and services that are failing. Nagios offers just that! It comes with a web interface that can be used to view the status of all hosts and services, read logs, and generate reports. Also, that's just a small part of its functionality.
Using any browser, you can access almost any information that Nagios keeps, namely status, performance data, history, and logs. You can easily check if all your hosts and services are working correctly with just a few clicks. The interface also offers the ability to change parts of configuration on the fly.
Having the possibility to check the status of all hosts and services is a very valuable functionality. Usually, a notification that something is wrong should just be a trigger to investigate the problem. Being able to see the big picture via various views of the web interface is very useful. You can use different detailed views and see both what is working properly and which hosts and/or services are in the warning or critical states.
In this chapter, we will cover the following items:
- Setting up and using the web interface
- Managing hosts and services
- Managing downtimes and adding comments
- Viewing Nagios information and generating reports
- Changing the look of the Nagios web interface
Chapter 3, Configuring Nagios, described how to set up the Nagios web interface. In this section, we will briefly describe its structure and how to use it.
The Nagios web interface is a part of the main Nagios sources and binary distributions. Therefore, if you installed Nagios, you also have the web interface files. The only thing that you need is a web server with CGI and PHP support, which in our case will be Apache 2 (refer to http://httpd.apache.org/ for more details).
The web interface uses Common Gateway Interface (CGI, a standard to generate dynamic websites; refer to http://httpd.apache.org/docs/current/howto/cgi.html for more details) to work as it is the most commonly offered way to run applications. It also allows a flexible set up in terms of security as CGI binaries can be run as a different user than the one web server is running as.
The web interface also uses additional files such as many static HTML pages, CSS style sheets, and images. Starting with Nagios 4, PHP (PHP: Hypertext Preprocessor, a scripting language for web development; refer to http://php.net/ for more details) is used to ease configuring of the web interface HTML pages.
By default, all Nagios HTML and other static files that are used by the web interface are copied into the share subdirectory of Nagios installation and all CGI binaries go into the sbin subdirectory. Assuming that Nagios has been configured using the default directories used in Chapter 2, Installing Nagios 4, they will be /opt/nagios/share and /opt/nagios/sbin.
If you installed Nagios from a binary distribution it might have configured the web server so that it is accessible. In that case, the package management would have asked you for a password to access the Nagios web interface. You should start by trying to access http://127.0.0.1/nagios/ from the machine that has Nagios installed. It will prompt you for a username and password. By default, the main Nagios administrator is called nagiosadmin and the password will be the one you supplied during package installation. For installation created using the automated script, the password is also nagiosadmin.
If you have followed all the steps mentioned in the previous chapter to install Nagios, then you will be able to use the web interface.
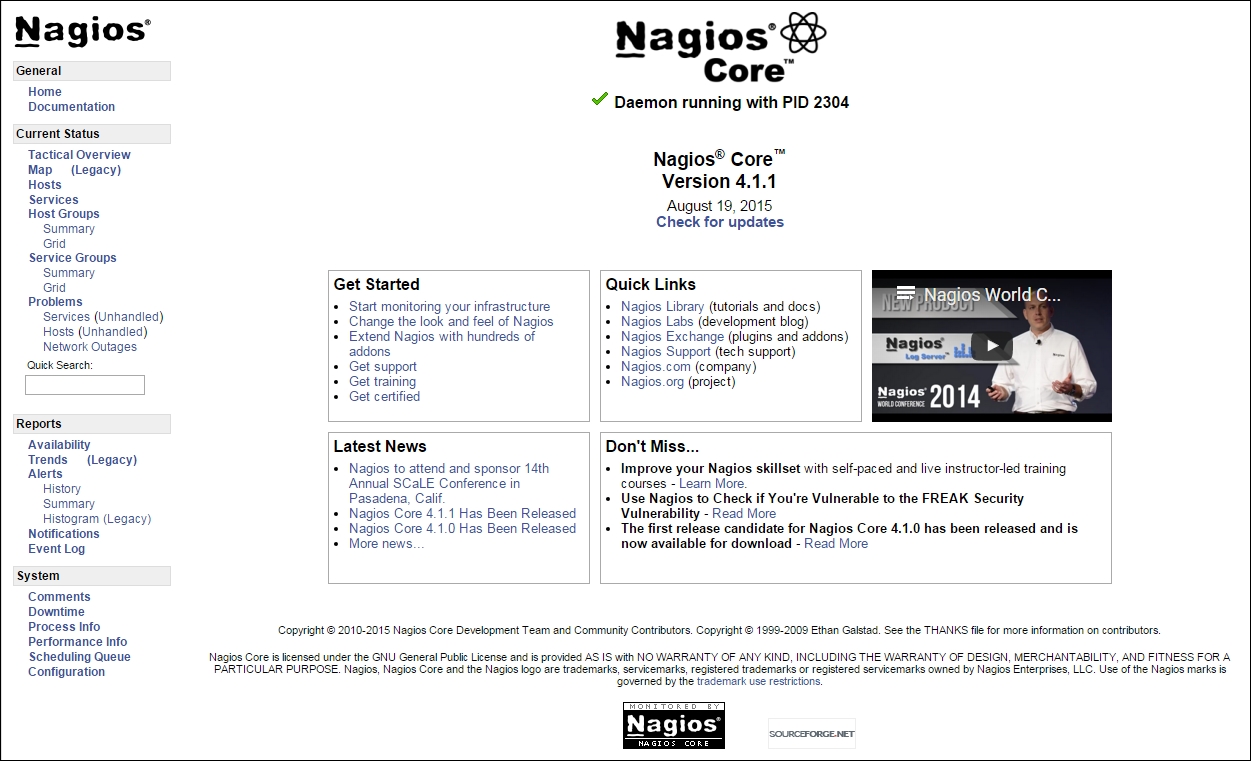
We can now access the Nagios web interface by navigating to the http://127.0.0.1/nagios/ URL from that machine. It will prompt for a username (nagiosadmin) and password configured at installation time. After a successful log in, you will see a welcome screen similar to the following one: