
Nagios offers several pages that can be used to view and modify host information. The Nagios web interface offers a view of all defined hosts, their status, and basic information. These can be used to determine the status of hosts. Host group-related views also show the status for services bound to hosts. Host Information pages can also modify several parameters related to the host configuration.
Nagios offers a panel that shows all hosts along with their status. It can be accessed by clicking on the Hosts link in the menu on the left.
The following is a screenshot reporting four hosts, all of which are currently up:
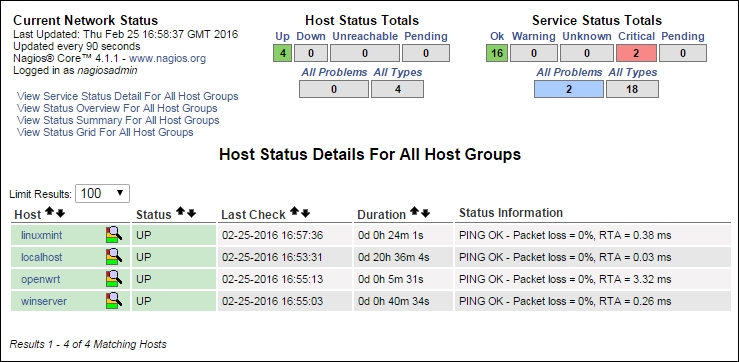
The page in the preceding image shows a list of all hosts, their status, and basic information such as when the host was last checked and when the status changed last. It also shows the information text response from the check. The order of how the table is shown can be changed by using the arrow buttons next to each column's header.
Similar to the Tactical Overview page, the Totals at the top of the page can be used to filter hosts or services to only the ones with a specific status. After clicking on any status type in the Host Status Totals table, the list of hosts is filtered by the ones that currently have that status. Clicking on any status type in Service Status Totals will show a list of services filtered by the ones that currently have the specified status.
There is also a quick jump menu on the left that allows moving to a list of all services and views related to the host groups.
Nagios also offers three views that show the status of all host groups. One such view is the status grid, which shows host groups along with the hosts in them, and each service for that host along with its status. It can be accessed by clicking on the Grid option under the Host Groups link in the menu on the left.
The following is a screenshot of such a status grid view:

Similar to the previous view, clicking on Host Status Totals or Service Status Totals will cause Nagios to filter results according to the specified criteria. The page also contains a quick jump menu on the left that can be used to change the currently selected view.
Clicking on any host group description will show a list of all services on all hosts within that group.
Clicking on a host group name, which is specified in brackets, will show a host group menu that allows modifying attributes for all hosts or services related to that host group.
Clicking on a host name in any host or service-related view will cause Nagios to show detailed information about the chosen host.
Clicking on a host in any view of the web interface will take you to the Host Information page. It contains details about the current host status, a list of comments, and a commands panel that allows modifying the host configuration, scheduling checks, and sending custom notifications.
The following is a screenshot of the Host (Windows machine) Information page:

This page contains detailed information on the selected host. It shows the current status and host checks that have been or will be performed. It also contains information on what functionality is enabled or disabled for the specified host, whether the host is flapping along with the flapping threshold value.
The menu on the right can be used to perform operations related to this host. It allows toggling whether active checks should be performed, if Nagios should accept passive check results or if it should detect flapping. You can also configure if Nagios should obsess over a host or send notifications and events. It is also possible to view options or schedule checks for all services bound to this host. You can also submit passive check results over the web interface.
The Host Information page also allows reading and modifying all comments related to this host. All current comments are listed under the Host Comments section. Clicking on a trash icon under the Actions column will delete a comment. You can also delete all comments and add a new comment bound to this host.