The previous chapter introduced the standard Nagios web interface and presented some insights on how it can be used to view the status and manage Nagios.
As with many popular projects, apart from the standard "official" web interface, there are many ways in which users can interact with Nagios—depending on their needs and connectivity options.
In this chapter, you will learn about other ways the Nagios status can be checked as well as how Nagios itself can be managed.
This chapter will cover the following items:
- Using third-party web interfaces
- Learning command line interfaces
- Using mobile applications to see the Nagios status
In addition to the default web interface, Nagios can be managed using other web-based interfaces. A wide choice of additional web interfaces can be found on Nagios Exchange at:
http://exchange.nagios.org/directory/Addons/Frontends-(GUIs-and-CLIs)/Web-Interfaces
Nagios Exchange, is a community website that lists various types of plugins and extensions for Nagios. It contains additional tools, web interfaces as well as plugins to perform checks.
In this section, we will cover some types of GUIs that can be used on top of Nagios—including dashboards that show the overall status of all Nagios hosts and services, visualization tools that show historical information gathered by Nagios as well as other web interfaces that are meant to replace or complement the built-in one.
Many of the GUIs available on Nagios Exchange are dashboards. These show statuses for hosts, services, and errors. The dashboards are often supposed to be presented on a large display, such as a TV, so that the IT department can easily monitor the status of the infrastructure and identify problems that need to be fixed.
One example of a dashboard interface is called Nagios Dashboard. It is a small PHP script that shows the statuses of hosts and services. The dashboard first shows all hosts and services that have errors, such as with the Critical status.
The plugin can be found on Nagios Exchange at: http://exchange.nagios.org/directory/Addons/Frontends-%28GUIs-and-CLIs%29/Web-Interfaces/Nagios-Dashboard--2D-PHP/details
The entire interface is a single file. To install it, we simply need to unpack and copy the nagios.php file to any location, such as to /opt/nagios/share.
Next, if Nagios was installed according to the steps documented in Chapter 2, Installing Nagios 4, then we need to change the path to the status.dat file to point to our location, which is inside the /var/nagios/ directory. To do this, we need to edit the file and change the third line to the following:
$file = fopen("/var/nagios/status.dat", "r") or exit("Unable to open file!"); //path to nagios fileWe can then check the report by navigating to the appropriate URL; if the file was copied to /opt/nagios/share, it will be available at http://localhost/nagios/nagios.php.

There are many other dashboards for Nagios available at Nagios Exchange, such as Nagios Dash, which is a project based on Nagios Dashboard and they are quite similar.
There are also projects offering a more complete web interface, meant to complement or replace the Nagios web interface. A good example of such a project is Nagios V-Shell. It is a web interface that provides most of the features of the original Nagios GUI.
It is created in PHP, is designed to be lightweight, and does not use frames, which makes it more convenient to use on mobile devices. It is available for download on Nagios Exchange at http://exchange.nagios.org/directory/Addons/Frontends-%28GUIs-and-CLIs%29/Web-Interfaces/Nagios-V-2DShell/details
The project is also available at GitHub from https://github.com/NagiosEnterprises/nagiosvshell/
It requires Apache and PHP, which we have already set up for the Nagios web interface. It also requires APC, a caching mechanism for PHP. The php-cli command is also required to run the installation script for V-Shell.
To install the required dependencies, simply run the following command for Ubuntu:
# apt-get install php-apc php5-cli
Use the following command for RedHat/CentOS:
# yum install php-pecl-apc php-cli
The installation of V-Shell itself is very simple. After downloading and unpacking the archive, we need to edit the config/vshell.conf and config/vshell_apache.conf configuration files.
For Nagios installation, according to the steps documented in Chapter 2, Installing Nagios 4, the config/vshell.conf file should have the following values set for each of the variables in the file:
STATUSFILE = "/var/nagios/status.dat"
OBJECTSFILE = "/var/nagios/objects.cache"
CGICFG = "/etc/nagios/cgi.cfg"
NAGCMD = "/var/nagios/rw/nagios.cmd"
NAGLOCK = "/var/nagios/nagios.lock"
We also need to change the location of the htpasswd.users file in config/vshell_apache.conf. It should be as follows:
AuthUserFile /etc/nagios/htpasswd.users
For Debian and Ubuntu, we will also need to replace the /etc/apache2/conf.d path with /etc/apache2/conf-available in the config.php file as well as /etc/nagios3/htpasswd.users to /etc/nagios/htpasswd.users.
By default, the package will install itself to /usr/local/vshell. This can be changed by editing the config.php and config/vshell_apache.conf files by replacing all references to /usr/local/vshell with the installation directory such as /opt/nagios/vshell.
For the config.php file, there are multiple references. In the config/vshell_apache.conf file, change the first lines to:
Alias /vshell "/opt/nagios/vshell"

<Directory "/opt/nagios/vshell">
(...)
We can now install V-Shell by running the following command:
# php-cli install.php
This will run the installation script. It will automatically copy all the files and add the Apache configuration file to the appropriate directory.
For Debian and Ubuntu, we'll also need to explicitly enable the vshell configuration file by running:
# a2enconf vshell
After that, it is recommended that you restart Apache by running the following command:
# service apache2 restart
Now, V-Shell should be available at http://127.0.0.1/vshell/, as shown here:
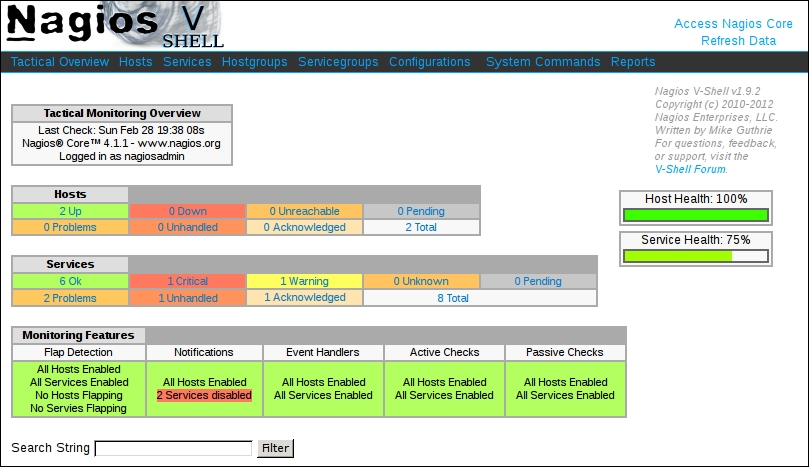
The V-Shell interface is very similar to the Nagios web interface; the main differences are that it does not use frames and the menu is shown on the top rather than on the left. The menu is also a drop-down menu, and hovering over one of the menu items shows a list of available elements.
V-Shell offers most of the views available in the standard web interface for Nagios, such as showing host details and all of the information related to host management.

Similarly, the Services views also strongly resemble the original Nagios web interface.

Nagios V-Shell provides views for most of the options available in the standard web interface. It also uses JavaScript for many operations, which makes it faster than the standard web interface. This is especially important for mobile devices that often have slower network connectivity.
Nagiosgraph is a very popular open source project that integrates with Nagios and generates graph data for all monitored hosts and services. The tool integrates with Nagios to store the history of the performance data and provides RRDtool-based graphs for visualizing the data. The project is written in Perl and can be found at:
http://nagiosgraph.sourceforge.net
Nagiosgraph works with any plugin that returns output including the performance data-this includes all of the standard Nagios plugins and many of the plugins available online. It also does not require any changes to the configuration of the objects themselves, and only small changes in the Nagios configuration are required.
To install Nagiosgraph we first need to install prerequisites, such as Perl, RRDtool, and Perl libraries for GD and RRD libraries. RRDtool is an open source data logging and graphing tool that is commonly used for creating graphs of time series data; more details can be found at:
For Debian/Ubuntu distributions the command to install all the prerequisites is:
# apt-get -y install rrdtool perl libgd-perl librrds-perl
For RedHat/CentOS the command is:
# yum -y install rrdtool perl perl-GD perl-Digest-MD5 rrdtool-perl perl-CGI
Next, we'll need to download the tarball with Nagiosgraph sources from https://sourceforge.net/projects/nagiosgraph/files/ and unpack it using the following command:
# curl -sSL https://sourceforge.net/projects/nagiosgraph/files/latest/download | tar -xzv
Next, we'll need to go to the Nagiosgraph source directory and run the installer script. The following is an example for installing Nagiosgraph version 1.5.2 (the latest version at the time of writing this book):
# cd nagiosgraph-1.5.2
# perl install.pl
The installation will check for prerequisites, locate Nagios, and perform the installation. The installation script will work out-of-the-box for the Nagios installation and is performed according to instructions in Chapter 2, Installing Nagios 4.
Next, we'll need to add additional configuration options, such as a new command to send data to Nagiosgraph and additional options for Nagios to pass the data.
First, let's create the /etc/nagios/nagiosgraph.cfg file with the following contents:
define command {
  command_name process-service-perfdata-for-nagiosgraph
  command_line /usr/local/nagiosgraph/bin/insert.pl
}
This will create a command to pass data to Nagiosgraph.
The path in command_line should point to the bin/insert.pl script inside the directory where Nagiosgraph was installed-/usr/local/nagiosgraph-the default installation path.
Next let's add the following to the Nagios main configuration file-/etc/nagios/nagios.cfg:
cfg_file=/etc/nagios/nagiosgraph.cfg
process_performance_data=1
service_perfdata_file=/tmp/perfdata.log
service_perfdata_file_template=$LASTSERVICECHECK$||$HOSTNAME$||$SERVICEDESC$||$SERVICEOUTPUT$||$SERVICEPERFDATA$
service_perfdata_file_mode=a
service_perfdata_file_processing_interval=30
service_perfdata_file_processing_command=process-service-perfdata-for-nagiosgraph
The first line includes the newly created /etc/nagios/nagiosgraph.cfg file. The next options enable the processing of the performance data by Nagios and specify how to pass the information. This is the format that Nagiosgraph expects and is command defined in Nagios configuration that instructs Nagiosgraph to process the data.
After that, we should restart Nagios using one of the following commands:
service nagios restart
/etc/init.d/nagios restart
From now on, Nagios will pass the data to Nagiosgraph and periodically run the insert.pl script that stores the performance data.
Finally, we need to add the Apache 2 configuration to the alias /nagiosgraph URL prefix. This should be added to the same file where the Nagios Apache 2 configuration is stored, which can be /etc/apache2/conf-available/nagios.conf or /etc/httpd/conf.d/nagios.conf depending on the Linux distribution. The content to add is as follows:
# enable nagiosgraph CGI scripts
ScriptAlias /nagiosgraph/cgi-bin "/usr/local/nagiosgraph/cgi"
<Directory "/usr/local/nagiosgraph/cgi">
   Options ExecCGI
   AllowOverride None
   Require all granted
</Directory>
# enable nagiosgraph CSS and JavaScript
Alias /nagiosgraph "/usr/local/nagiosgraph/share"
<Directory "/usr/local/nagiosgraph/share">
   Options None
   AllowOverride None
   Require all granted
</Directory>
The /usr/local/nagiosgraph path should be changed if a nondefault installation directory was used.
Now, we need to restart Apache. Depending on the Linux distribution one of the following commands will restart Apache:
apachectl restart
service apache2 restart
service httpd restart
Now, Nagiosgraph should be available from http://(ip-address)/nagiosgraph/cgi-bin/show.cgi, where (ip-address) should be the IP address of the Nagios server.
We can now visit the page. It will provide us with a selector for host and service in the top-right corner and when host and service is selected, it will show the performance data graphs for the last day, week, month, and year.
The following is an example for a system load graph:

Graphs support zooming in and out using the mouse. To zoom in, simply select a range to zoom in using the left mouse button. The graph will zoom in to that data. To zoom out, simply click the right mouse button.
It is also possible to add a link to view the Nagiosgraph data for any service directly from the Nagios built-in web interface. To do this, simply add an action_url directive to a service definition in the Nagios configuration as shown here:
define service {
  name nagiosgraph
  action_url /nagiosgraph/cgi-bin/show.cgi?
  host=$HOSTNAME$&service=$SERVICEDESC$
  register 0
}
This will create a generic service template with the action_url directive that can be included in services.
Next, we can add the nagiosgraph template to services that should have the action link shown as:
define service {
  use generic-service,nagiosgraph
  (...)
}
This will show a link next to the service in the Nagios built-in web interface that will link to the Nagiosgraph view for that service.
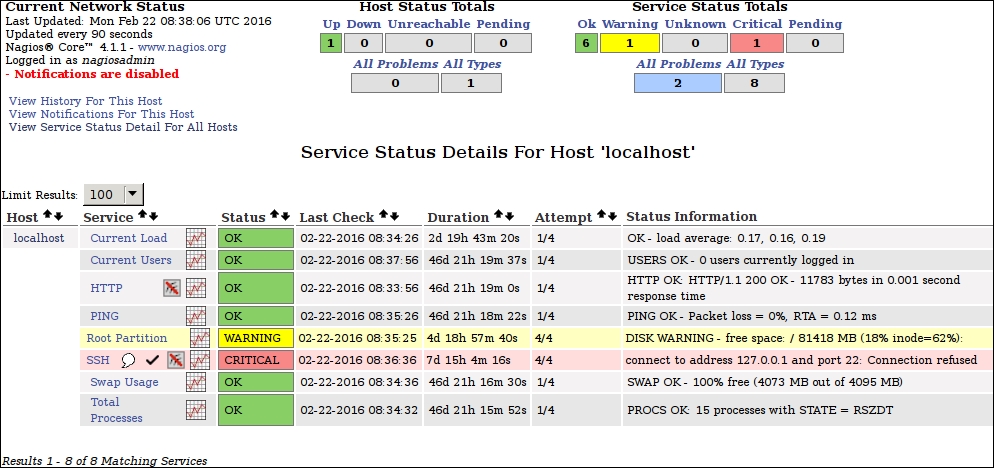
For example, here is how a sample configuration looks with the action_url directive added; the link is shown as the graph icon to the right of the service name: