
Twitter timelines are the new battlegrounds for brands, fans and organizations to fight it out and present a winner. Twitter is also a place where users usually rant about their disappointments or share their happiness. The dynamics of human interaction and our urge to share opinionated views on wide ranging topics, from cat pictures to wars and everything in between, have reached an altogether different level.
With its 300 million plus users and counting, Twitter is a virtual country in itself! Its huge user base which generates tweets (or opinions) by the count of millions every minute present a unique opportunity to study and utilize human sentiment and/or opinions. This study of our sentiments and emotion carries a lot more value than just pure academic research (which is, of course, still required by any standards). It carries a lot of business value for companies, governments and celebrities alike.
Before we dive into implementation details and a particular use case, let us first have a quick introduction to sentiment analysis. Since sentiment analysis is a complete research area on its own, we will be briefly touching upon the key concepts only. Detailed discussion on the topic is beyond the scope of this book.
The following are the key concepts/terms in context of sentiment analysis.
The dictionary meaning of the word opinion is a view or a judgement formed about something, not necessarily based on facts. In simpler words, an opinion is a reflection of our beliefs irrespective of what the facts are. Therefore, subjectivity is an expression of our sentiments/opinions about things, people and so on. Subjectivity is the reason why some people like a particular product while others do not.
Subjectivity or subjective texts are a core concept behind sentiment analysis. Subjective texts are of importance to the field of sentiment analysis for the reasons stated preceding. Subjective sentences/texts of the form I love reading books express positive sentiment as opposed to objective sentences like Twitter is a social network which simply states a fact.
Sentiment analysis is broadly an analysis of subjective texts to understand the overall emotions expressed.
For analytical purposes we usually assign a score or a label to the entity of interest. In the case of sentiment analysis, we usually assign a score to each of our subjective texts or words on a continuous or discrete scale (say between -5 and +5) to mark the degree of sentiment. Usually, negative scores denote negative sentiments with extreme negative values denoting very negative sentiments, and the opposite for the positive side of the scale. A score of 0 denotes neutral sentiment. Sentiment polarity may also work based on class labels like liked versus disliked (say a movie review system). The use of polarity scores or labels depends on the use case at hand usually.
Once a sentiment score/label is assigned to each of the texts in the corpus, the next step is usually summarization of opinions for deriving insights. It is important to aggregate and summarize the overall sentiments to draw conclusions and insights on the topic of interest, say if we are trying to determine if a movie was well received by the audience or not. Summarization is usually coupled with visualization for better understanding of data.
In the analytics space, particularly machine learning and/or text analytics, a feature is one of the central entities upon which an algorithm works. A feature is simply a measureable entity being observed for the current problem at hand.
For example, while performing stock price prediction measures, like the current stock price, time, rate of change of stock price, and so on, are features utilized by different algorithms for generating outputs.
In most use cases, it is common to start with a basic set of features, analyze them and then gradually move towards feature generation and feature extraction/selection. While feature generation is a process of deriving new or additional features from data and existing feature set, feature extraction/selection in general refers to the process of fine tuning and/or reducing the feature set to the best possible subset which can describe a dataset.
The following are a few features commonly utilized in the context of text analytics:
- Term Frequency – Inverse Document Frequency (TF-IDF): It has its roots in information retrieval. In the context of TF-IDF, a piece of text is broken (tokenized) into its constituents in the form of a vector. It is a numerical measure of how important a word/term is to a document in context to the whole corpus (set of documents).
- Parts of Speech (POS): Text is generated using the rules of the grammar of a particular language. Analysis of textual data from a Natural Language Processing (NLP) point of view makes use of the underlying language semantics (structure and rules of the language). Parts of Speech (POS) analysis tries to map each word/token to different parts of speech like verbs, adjectives, nouns and so on. The following is a sample breakdown of a sentence into its parts of speech. The POS labels are assigned using
nltklibrary (see http://www.nltk.org)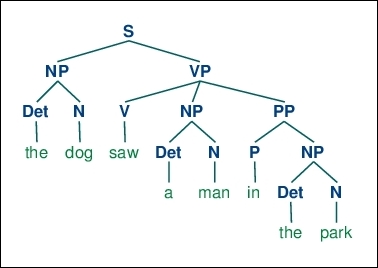
Sample PoS tagging Source: http://www.nltk.org
- N-grams: In computational linguistics, text is a continuous sequence of terms. In context of n-grams, the likelihood of the next token (character, word, and so on) depends upon n previous terms. For different values of n, a feature vector may be termed as unigram (n=1), bigram (n=2) and so on.
Tip
Checkout analysis using N-grams from Google: https://research.googleblog.com/2006/08/all-our-n-gram-are-belong-to-you.html
The previous mentioned list of features are just the tip of the iceberg. As data scientists, we need to get creative and derive features based on the dataset at hand, given we have explored the standard plethora of existing features.
Tip
Even though languages across the world follow rules of grammar, it is still a difficult task to understand this process of generating content. Though research into the field has made big leaps, concepts like sarcasm still confuse our algorithms. Some recent interesting papers on the topic: http://cs229.stanford.edu/proj2015/044_report.pdf , https://www.aclweb.org/anthology/W/W10/W10-2914.pdf
Now that we have a sound understanding of sentiment analysis and its key concepts, let us get our hands dirty with an actual use case.
Twitter is a recent favorite amongst celebrities, politicians and leaders to get in touch with their respective audience. Making the best possible use of its follower relationship graph, Twitter enables them to get in touch and stay updated. Our next use case revolves around such Twitter handles itself. With this use case we intend to understand the personality behind one such Twitter handle and analyze:
- What kind of tweets they tweet? Basically, the sentiment behind their tweets
- What are the major topics they tweet about?
- Can we identify certain themes from their tweets?
For this use case, let us tap into the timeline of the most powerful and watched man on the planet, The President of United States of America. The official Twitter handle for POTUS (acronym for President of the United States) is @POTUS.
We will follow the usual analytical workflow again and try to answer the aforementioned questions regarding tweets from @POTUS.
We assume the required libraries such as twitteR, ggplot2, tm and so on are loaded and we have an active connection to our Twitter app using R. For this particular use case, we will load one additional package called the syuzhet.
Tip
syuzhet is an R package specially designed for sentiment analysis. It is based on the concepts of fabula (chronological order of narratives) and syuzhet (technique of the narrative). This package also packs in research and collaborative lexicons from other researchers as well. More details on this can be found at: https://github.com/mjockers/syuzhet
In the following snippet we connect to Twitter and extract 1500 tweets for the handle @POTUS. We have written a simple utility called extractTimelineTweets(), which extracts tweets, converts the text to UTF-8 format and returns as DataFrame:
# connect to twitter app
setup_twitter_oauth(consumer_key = CONSUMER_KEY,
                    consumer_secret = CONSUMER_SECRET)

tweetsDF <- extractTimelineTweets("POTUS",1500)
First let us begin with the topics Mr. President is talking about. A word cloud is usually a quick way to visualize such an analysis. Before we build one, we need to perform some text processing to clean up and transform the tweets. In our previous use case we were mostly concerned about handles generating the tweet for building the word cloud. In this case we are interested in the actual tweet text and hence the additional care.
We'll make use of the package tm's tools like Corpus and VectorSource to vectorize our tweets corpus and then use tm_map to apply transformations like stopword removal (a list of words like a, an, the and so on, which occur frequently in text but do not carry much factual information), whitespace removal and so on.
The following snippet prepares our data to be used for wordcloud generation:
nohandles <- str_replace_all(tweetsDF$text, "@\w+", "")
wordCorpus <- Corpus(VectorSource(nohandles))
wordCorpus <- tm_map(wordCorpus, removePunctuation)
wordCorpus <- tm_map(wordCorpus, content_transformer(tolower))
wordCorpus <- tm_map(wordCorpus, removeWords, stopwords("english"))
wordCorpus <- tm_map(wordCorpus, removeWords, c("amp"))
wordCorpus <- tm_map(wordCorpus, stripWhitespace)

# prepare wordcloudwordcloud(words = wordCorpus,
          scale=c(5,0.1),
          max.words=1000,
          random.order=FALSE,
          rot.per=0.35,
          use.r.layout=FALSE,
          colors=pal)
The following wordcloud marks out the common topics which interest the @POTUS, for example climate, world, health, women, gun, congress and so on. Of course, the word American comes out as the most used word in the center of the wordcloud as shown in the following figure:
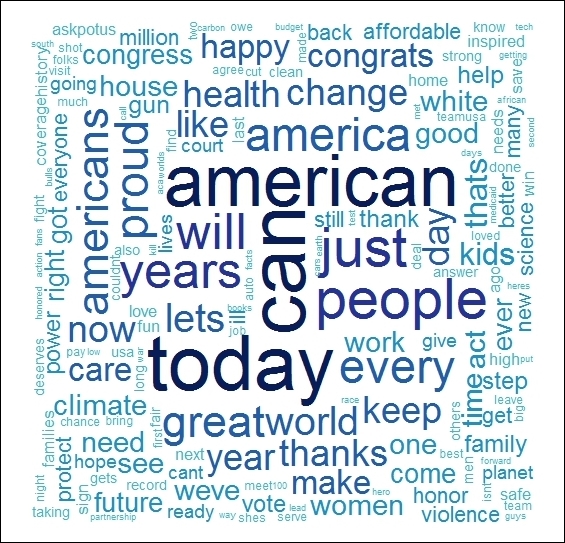
Tweet text wordcloud from @POTUS
Next, let us now try to understand the sentiments expressed by this user. World leaders play an important role in the dynamics of the world and understanding their sentiments can help us understand them better.
In this case, we will perform sentiment analysis using polarity analysis. Polarity analysis is the process of scoring and aggregating sentiment of the corpus for deriving insights. Such an analysis utilizes a pre-compiled list of words which denotes positive, negative and neutral sentiments. We then parse each tweet/document against this list of polar words and assign a sentiment score based on a certain agreed upon equation.
For example, a simple way of assigning a score to each tweet could be:
Sentiment Score = Sum (positive words) – Sum (negative words)
We can build a sophisticated formula/equation based on our requirement and use case. For example, we may try to include neutral words as well, or we may normalize the whole score to get the final value in a pre-defined range.
We will make use of the syuzhet package to score our tweets. The function get_sentiment() works upon a corpus of text and returns a vector of scores for each text. The scores are on a real scale with negative values referring to negative polarity and vice-versa.
The following snippet performs sentiment scoring and then plots these scores on a histogram for better understanding:
tweetSentiments <- get_sentiment (tweetsDF$text,method = "syuzhet")
tweets <- cbind(tweetsDF, tweetSentiments)
tweets$sentiment <- sapply(tweets$tweetSentiments,encodeSentiment)

qplot(tweets$tweetSentiments) +
      theme(legend.position="none")+
      xlab("Sentiment Score") +
      ylab("Number of tweets") +
      ggtitle("Tweets by Sentiment Score")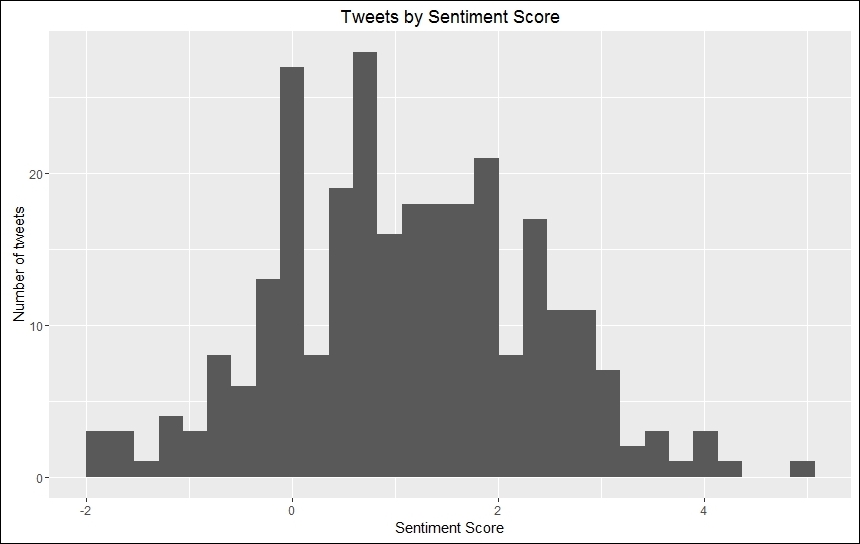
Polarity analysis of tweets from @POTUS
The plot is slightly skewed towards the right of 0, thus showing that most of the tweets are positive, but there are some tweets with negative sentiments. Users may subset and explore the occasions when @POTUS wasn't all that cheery.
Tip
Readers can perform a similar polarity analysis by writing a simple utility function of their own and checking tweets against a self-generated list of polar words and then comparing the results we got from the syuzhet package.
To start with, a list of polar words can be obtained from: https://www.cs.uic.edu/~liub/FBS/sentiment-analysis.html
It can be a little difficult to gauge different sentiment aspects from the previous plot. We can view the same from a different perspective by binning sentiments into categories such as positive, very positive, negative, very negative, and neutral. These categories could be based on a range of polarity scores, say from 0 to 0.5 could be marked positive and greater than 0.5 as very positive and similarly for negative polarity.
Let us see which class most sentiments belong to:
tweetSentiments <- get_sentiment (tweetsDF$text, method = "syuzhet")
tweets <- cbind(tweetsDF, tweetSentiments)
tweets$sentiment <- sapply(tweets$tweetSentiments,encodeSentiment)

ggplot(tweets, aes(sentiment)) +
       geom_bar(fill = "aquamarine4") +
       theme(legend.position="none",
       axis.title.x = element_blank()) +
       ylab("Number of tweets") +
       ggtitle("Tweets by Sentiment")
The following is the plot generated by using ggplot:
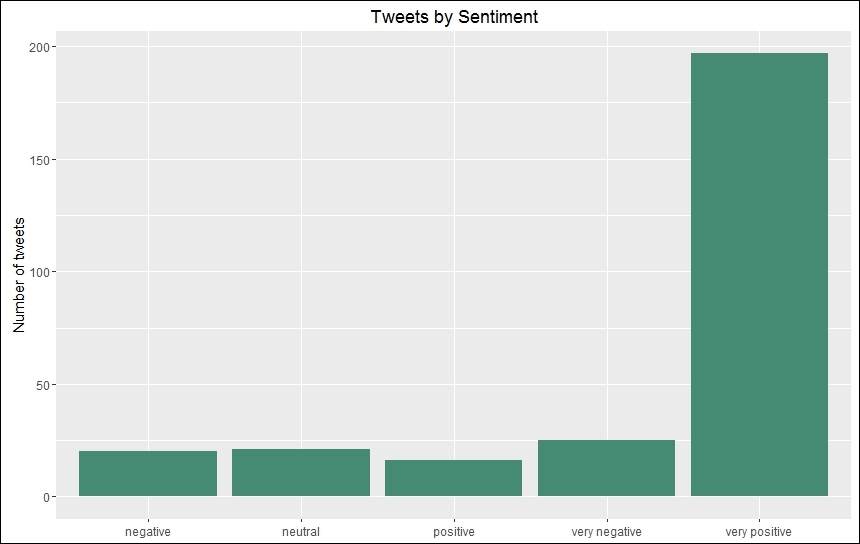
Polarity categories of tweets from @POTUS
The preceding plot shows that a very high percentage of tweets come under the very positive category while the other categories are all comparatively low. #phew!
Note
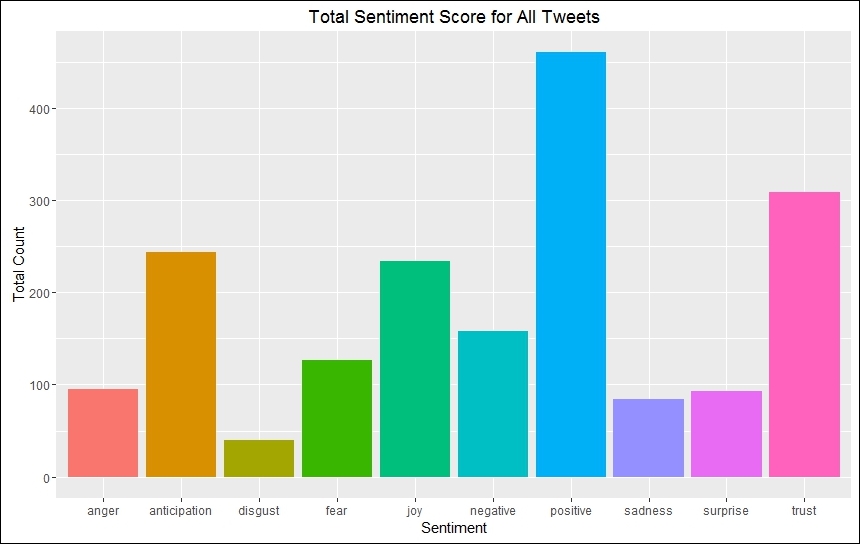
Not just positive, negative, and neutral sentiments
As humans we express far more emotions than just positive, negative and neutral: we express anger, joy, fear, surprise, and so on. Significant research into the field of sentiment analysis has made it possible to generate lexicons and corpora which can help us better label sentiments. One such research by Dr. Saif Mohammad and Peter Turney is also exposed through the same syuzhet package. Readers are encouraged to explore this further. The previous polarity analysis using NRC lexicon (http://saifmohammad.com/WebPages/NRC-Emotion-Lexicon.htm) generates the following output: #amazing!
As discussed, polarity analysis utilizes a dictionary or list of polar words which are then used to score the text in our corpora. Yet, this is not the only way to perform sentiment analysis. If we look carefully, in the process of sentiment analysis we are basically trying to classify our tweets (or text in general) into positive, negative and neutral classes. In formal terms, this is what we term as a classical classification problem.
In machine learning, classification is a supervised learning problem. In this, we learn about the class labels from a training set which is usually labeled/scored manually or through some measurements.
For example, in the case of sentiment analysis, the training set will constitute a list of documents which would be manually labeled by a team as positive, negative or neutral based on certain pre-agreed rules. Once we have a labeled training set, an algorithm such as Support Vector Machines (SVM) would learn based on the training dataset and then utilize this information to assign labels to our new tweets or unlabeled documents. Such a process requires human supervision and is time-consuming. Yet it has the benefit of learning the underlying process of assigning sentiments to a certain document, which is generally not possible with the polarity based analysis we did previously. There are various datasets, such as WordNet, SentiNet, SentiWordNet, and so, on which contain labeled texts. These datasets are regularly updated and used for research purposes as well as for training supervised algorithms.
Note
Linguistic heuristics: Vasileios Hatzivassiloglou and Kathleen McKeown. Predicting the semantic orientation of adjectives. In Proceedings of the Joint ACL/EACL Conference, pages 174–181, 1997.
Bootstrapping: Ellen Riloff and Janyce Wiebe. Learning extraction patterns for subjective expressions. In Proceedings of the Conference on
Empirical Methods in Natural Language Processing (EMNLP), 2003: Peter Turney. Thumbs up or thumbs down? Semantic orientation applied to unsupervised classification of reviews. In Proceedings of the Association for Computational Linguistics (ACL), pages 417–424, 2002.
Before we finish this use case, let us also touch upon an unsupervised approach for analysis of textual data or tweets in this case. Using a word cloud, we have already identified the various topics @POTUS tweets about. Let us now try and see if we can derive some common themes out of these tweets.
Hierarchical clustering is one such unsupervised learning algorithm widely used to generate hierarchical grouping of textual information. Like any clustering algorithm, hierarchical clustering helps us group similar entities together for better analysis. Hierarchical clustering can be understood in the form of the following three steps:
- Initialization: This is the first step. For a corpus of n elements, each one is assigned to a unique cluster of its own, that is, for a dataset of n elements, this step generates n different clusters.
- Merge: In this step, based on a pre-determined distance metric, the closest clusters are identified and merged into a single cluster. This step reduces the total number of clusters available as compared to the number before this step was executed.
- Compute: After each step, the distance/similarity measures are calculated/recalculated for each of the existing clusters.
The merge and compute steps are repeated until we obtain a single cluster containing all the elements of the dataset. As the name suggests, the output of this algorithm is a hierarchical structure which is similar to an inverted tree, also called a dendrogram. The root of the tree represents the most general theme and it goes granular as we go deeper into the tree.
Let us now apply the algorithm on our dataset and analyze the results. We will begin by creating a Term-Document Matrix from our tweets DataFrame using the tm package. We then compute a distance matrix using the dist() function. For this use case, we utilize the Euclidian distance (readers may experiment with other measures as well). Once computed, we use the hclust() function to perform the hierarchical clustering and generate a dendrogram for our dataset.
A Term-Document Matrix is simply a data structure in which all the words (terms in general) of our dataset represent the rows while the documents are represented as columns. If a term exists in a particular document, that row-column intersection is marked as 1 (0 otherwise). The Term-Document Matrix may also utilize frequency of a term instead of 0-1 encoding depending upon the use case.
The following snippet illustrates this point:
# computer term-document matrix
twtrTermDocMatrix <- TermDocumentMatrix(wordCorpus)

twtrTermDocMatrix2 <- removeSparseTerms(twtrTermDocMatrix,
                                        sparse = 0.97)

tweet_matrix <- as.matrix(twtrTermDocMatrix2)

# prepare distance matrix
distMatrix <- dist(scale(tweet_matrix))
# perform hierarchical clustering
fit <- hclust(distMatrix,method="single")
# plot the dendrogram
plot(fit)
The output of this process clearly groups similar terms and can help us derive insights from such tweets by analyzing the grouped tweets together rather than in isolation:
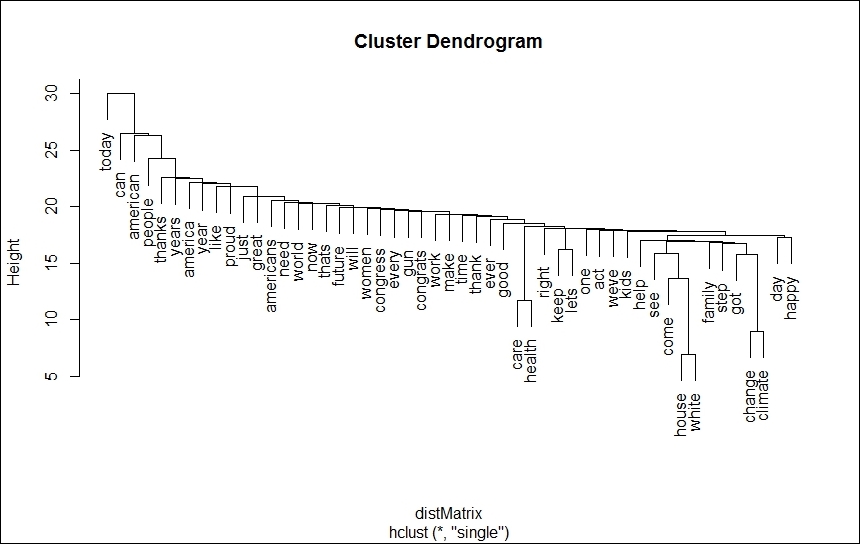
Cluster dendrogram of tweet corpus
With the help of this use case, we used real data from Twitter to analyze sentiments portrayed by tweeple (@POTUS in particular). We touched upon concepts of sentiment analysis and utilized powerful R packages like tm, stringr and syuzhet for the task at hand. Visualizations helped us better understand our data along with the ability to better express our results and insights. Sentiment analysis is utilized under various scenarios, and, most prominently, by brands and organizations. Techniques like sentiment analysis assist marketers to judge their audience/ customer perception/feedback of a product and update their strategies accordingly. These, along with many more scenarios, showcase how important a technique like sentiment analysis could be in this data driven world!