
So far, we have analyzed Twitter and tweets to uncover some interesting insights using techniques and concepts of trend analysis and sentiment analysis. We've utilized different attributes of tweets, like creation time, location and even the text itself, to answer certain questions. In this section, we will touch upon Twitter's network aspects. #BraceYourSelves
A social network is a network or a graph at its core. In formal words, a social network is generally a graph representing its users as nodes (or vertices) linked to each other based on certain relationships called edges. Each social network has its own definition of these relationships. For this section, we will focus on Twitter's relationships and network in general.
In Twitter-verse as we all know, there are no friends! A friend relationship is usually a bidirectional relationship, that is, if A is a friend of B, then it is safe to say that B is also a friend of A (well, usually; see Facebook friends). Twitter has tweaked this concept of friendship and allows its users to form unidirectional relationships or follower relationships. On this platform, a user may choose to follow any number of users, based upon their interests. The person being followed though has no such obligation to return the favor, that is, if A is following B, then it is not necessary for B to follow A.
At first this sounds a bit awkward but it is rather an interesting and a very human concept. In our social setting we come across many people about whom we are interested, say celebrities or leaders. In general, we are curious and intrigued by such personalities and love to know more about them. The follower relationship model allows Twitter users to follow such personalities (aka handles) without the personality following the user back. Nothing stops people being followed to follow back, but imagine a Twitter where @KatyPerry would have to follow back all of her 94 million followers!
Very much like other things associated with Twitter (like sentiments, trends, velocity and so on), these follower relationships have also intrigued researchers. As part of this section, let us touch upon the concept of follower graphs and see what magic unfolds.
Note
Though follower graphs are basically graphs themselves, in this section we will only use the very basic concepts related to graphs such as vertices, edges, weights and so on. We will provide brief details wherever necessary. Readers are encouraged to read more about graph theory and try to apply those concepts to Twitter data for some advanced analysis.
We use a social network like Twitter to share information about a number of topics and we all want our story to reach as many people as possible. With Twitter, it's the follower count that's most coveted. Popular accounts, such as those of Katy Perry, Barak Obama, Mars Rover and so on, have millions of followers. With this use case let us plot and analyze a given user's follower graph.
To begin with this use case, let us perform our ritual initialization steps of loading required packages and connecting to Twitter using the twitteR package. We use the getUser() function to extract a given user's details and then use the function getFollowers() to extract handles of his/her followers. The following snippet does the same:
setup_twitter_oauth(consumer_key = CONSUMER_KEY,
                    consumer_secret = CONSUMER_SECRET)

# Begin with a certain username
coreUserName <- "jack"
twitterUser <- getUser(coreUserName)

# Extract Followers for the core user
twitterUser_follower_IDs <- twitterUser$getFollowers(
                            retryOnRateLimit=10)
# Typecast as a dataframe
twitterUser_followers_df = rbindlist(
                  lapply(                                                     twitterUser_follower_IDs,
                    as.data.frame
                              ))
Once we have this data, we can proceed towards building a graph. But what fun would it be to have just you at the center of this graph and your followers listed out visually. We make this interesting by going one level deeper, that is, for each of our followers, we extract their list of followers as well.
For building a graph or network, R has another powerful package called igraph. The igraph package provides multiple ways of generating a graph. We prepare a data frame with two columns, that is, from and to. Each row of the data frame represent an edge from one user to another.
In the following snippet, we first filter our followers DataFrame(filtered_df) by removing dead and dummy accounts (you may choose to follow some other criteria or not do any clean-up at all). Then we iterate over each of our given user's followers, extract their followers and append that list to our DataFrame representing the edges:
# extract @ twitter handles of followers of given user
filtered_follower_IDs <- filtered_df$screenName

# prepare initial edge data frame
edge_df<-data.frame(from=filtered_follower_IDs,
                    to=rep('rghv_bali',
                           length(filtered_follower_IDs)),
                    stringsAsFactors=FALSE)


# Iterate and extract list of followers of followers

counter = 1
for(follower in filtered_follower_IDs){
  # fetch follower list for current user
  followerScreenNameList <- get_follower_list(follower)

  print(paste("Processing completed for:",
            follower,
            "(",counter,"/",
            length(filtered_follower_IDs),")"
            ))
  # append to edge list
  edge_df <- append_to_df(edge_df,
                       list(from=followerScreenNameList,
                   to=rep(follower,
                            length(followerScreenNameList))))
   counter <- counter + 1
}
The edge data frame generated using the preceding snippet has each row representing a follower relationship as follows:
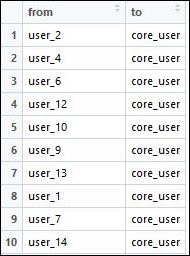
Follower/Edge DataFrame
Now that we have our edge data frame ready, we'll prepare an igraph data frame object based on this. After that, we utilize a couple of igraph utility methods to remove loops and multiple edges (if any) using simplify() and make some aesthetic changes to node sizes for clearly marking out our core user. Check out the following snippet:
# prepare network object
net <- graph.data.frame(edge_df2, directed=T)

# simplify networknet <- simplify(net, remove.multiple = F, remove.loops = T)

# adjust the size of nodes based on in and out degrees
deg <- degree(net, mode="all")
V(net)$size <- deg*0.05 + 1
V(net)[name == "core_user"]$size <- 15

# node coloringpal3 <- brewer.pal(10, "Set3")

# overall follower graph
plot(net,
     edge.arrow.size=0.01,
     vertex.label = ifelse(V(net)$size >= 15,
     V(net)$name, NA),
     vertex.color = pal3)
The preceding snippet generates the following follower graph:

Sample follower graph
If we analyze the preceding graph carefully, we can see that there are quite a few users/nodes who have edges (that is, follower relationships) amongst themselves! Also, the size of each of the nodes (barring the core user's) is a representation of its follower count. To be precise, we adjusted node sizes to account for the number of incoming and outgoing connections (the in-degree and out-degree of each node). This helps us identify which of our followers are more popular than others.
Even though Twitter uses follower-based relationships, it doesn't stop users from following back. A follower who follows back sounds much like a friend relationship. It would be interesting to identify who our core_user follows back. For a real use case, it might be interesting to identify, for instance, which world leaders follows back who, and derive political insights of sorts from it.
Our graphing package, igraph's utilities simply make our lives easy. It exposes a set of iterators for both edges and vertices along with a utility function called ends(). This function helps us identify whom does the core_user follow back from his list of followers!
Note
In a very basic sense, an iterator is an object which helps us traverse a container, for instance a list. Iterators are not unique to R and are available in most modern programming languages. igraph also provides iterators for vertices and edges for ease of traversal, extraction, updation and so on.
The following snippet achieves the task of identifying friend nodes:
# identify friend vertices
friendVertices <- ends(net, es=E(net)[from('core_user')])[,2]
Now that we have our list of friend vertices, let us make some visual changes to our follower network visualization to clearly identify the friends amongst followers. The following snippet marks edges amongst friend nodes as red and enable vertex labels for the same:
# Generate edge color variable:
ecol <- rep("grey80", ecount(net))
ecol[which (V(net)$name %in% friendVertices)] <- 'red'

# Generate node color variable:
vcol <- rep("gray80", vcount(net))
vcol[which (V(net)$name %in% friendVertices)] <- "gold"

plot(net,
     vertex.color=vcol,
     edge.color=ecol,
     edge.width=ew,
     edge.arrow.mode=0,
     vertex.label = ifelse(V(net)$name %in% friendVertices, V(net)$name, NA), vertex.label.color="black",
     vertex.label.font=2,
     edge.curved=0.1
     )
The output plot shows the #friendsAmongstFollowers:

Friends in follower graph
The preceding follower graph analysis helps us understand a social network like Twitter from a network perspective. It also shows how different questions could be answered with such analysis and as always, R and its packages help us quickly get to the answers once we have an approach in our minds.
Note
Please note that the preceding graph might look slightly different than the one we generated initially. This is due to the fact that igraph is generating a random layout at every execution. Readers may read more about igraph here: http://igraph.org/r/doc/
Chapter 1, Getting Started with R and Social Media Analytics introduced certain challenges related to the analysis of social networks and their data. The challenges mentioned were related to the volume and velocity of data (big data), accessibility and data quality.
In this chapter, though we faced challenges already discussed in the previous chapter, there are a couple of points we should keep in mind:
- Accessibility: Twitter is an ever growing social network which supports millions of users and thousands of third party integrations. The rate limits and other governance criteria have become stringent over the years. Readers are requested to keep the rules of the game in mind and not try to exploit the APIs.
- Privacy: Though social networks provide users with privacy controls, scope for improvement remains. APIs keep policy rules enforced, yet as we perform analysis of real data, we should keep in mind the results we publish and insights we share.
- API changes: Twitter has a robust set of APIs which allows us to tap into Twitter-verse. Correspondingly R's
twitteRpackage helps us connect and use these APIs seamlessly. However, over the years these APIs will be changed and it may be that packages are not able to keep up the pace. In such scenarios, we need to keep a check and update our code base as and when required. - Data: Tweets have evolved from simply 140 characters to containers of rich media comprised of hyperlinks, images, emoticons, videos, and so on. In this chapter we analyzed textual, temporal and location-based attributes of tweets. Analysis of other contents would require more creativity and deeper understanding.
These were some of the challenges we faced and will face when dealing with Twitter (or any other social network) analysis. Even though each of the use cases we solved in this chapter followed a similar workflow, each required a different set of clean-up and transformation steps to extract insights and to answer questions. Twitter analysis is full of challenges, but they are often worth the results we get from such exercises.