There are a number of options available to implement a centralized logging solution. These solutions use different approaches, architectures, and technologies. It is important to understand the capabilities required and select the right solution that meets the needs.
There are a number of cloud logging services available, such as the SaaS solution.
Loggly is one of the most popular cloud-based logging services. Spring Boot microservices can use Loggly's Log4j and Logback appenders to directly stream log messages into the Loggly service.
If the application or service is deployed in AWS, AWS CloudTrail can be integrated with Loggly for log analysis.
Papertrial, Logsene, Sumo Logic, Google Cloud Logging, and Logentries are examples of other cloud-based logging solutions.
The cloud logging services take away the overhead of managing complex infrastructures and large storage solutions by providing them as simple-to-integrate services. However, latency is one of the key factors to be considered when selecting cloud logging as a service.
There are many purpose-built tools to provide end-to-end log management capabilities that are installable locally in an on-premises data center or in the cloud.
Graylog is one of the popular open source log management solutions. Graylog uses Elasticsearch for log storage and MongoDB as a metadata store. Graylog also uses GELF libraries for Log4j log streaming.
Splunk is one of the popular commercial tools available for log management and analysis. Splunk uses the log file shipping approach, compared to log streaming used by other solutions to collect logs.
The last approach is to pick and choose best-of-breed components and build a custom logging solution.
There are log shippers that can be combined with other tools to build an end-to-end log management solution. The capabilities differ between different log shipping tools.
Logstash is a powerful data pipeline tool that can be used to collect and ship log files. Logstash acts as a broker that provides a mechanism to accept streaming data from different sources and sync them to different destinations. Log4j and Logback appenders can also be used to send log messages directly from Spring Boot microservices to Logstash. The other end of Logstash is connected to Elasticsearch, HDFS, or any other database.
Fluentd is another tool that is very similar to Logstash, as is Logspout, but the latter is more appropriate in a Docker container-based environment.
Stream-processing technologies are optionally used to process log streams on the fly. For example, if a 404 error is continuously occurring as a response to a particular service call, it means there is something wrong with the service. Such situations have to be handled as soon as possible. Stream processors are pretty handy in such cases as they are capable of reacting to certain streams of events that a traditional reactive analysis can't.
A typical architecture used for stream processing is a combination of Flume and Kafka together with either Storm or Spark Streaming. Log4j has Flume appenders, which are useful to collect log messages. These messages are pushed into distributed Kafka message queues. The stream processors collect data from Kafka and process them on the fly before sending it to Elasticsearch and other log stores.
Spring Cloud Stream, Spring Cloud Stream Modules, and Spring Cloud Data Flow can also be used to build the log stream processing.
Real-time log messages are typically stored in Elasticsearch. Elasticsearch allows clients to query based on text-based indexes. Apart from Elasticsearch, HDFS is also commonly used to store archived log messages. MongoDB or Cassandra is used to store summary data, such as monthly aggregated transaction counts. Offline log processing can be done using Hadoop's MapReduce programs.
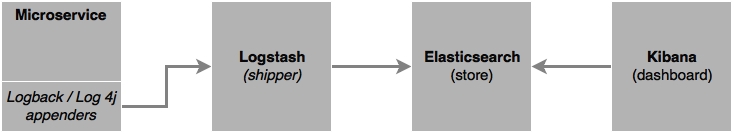
The tools mentioned before can be leveraged to build a custom end-to-end logging solution. The most commonly used architecture for custom log management is a combination of Logstash, Elasticsearch, and Kibana, also known as the ELK stack.
The following diagram shows the log monitoring flow:
In this section, a simple implementation of a custom logging solution using the ELK stack will be examined.
Follow these steps to implement the ELK stack for logging:
- Download and install Elasticsearch, Kibana, and Logstash from https://www.elastic.co.
- Update the Search microservice (
chapter7.search). Review and ensure that there are some log statements in the Search microservice. The log statements are nothing special but simple log statements usingslf4j, as follows:import org.slf4j.Logger; import org.slf4j.LoggerFactory; //other code goes here private static final Logger logger = LoggerFactory.getLogger(SearchRestController.class); //other code goes here logger.info("Looking to load flights..."); for (Flight flight : flightRepository.findByOriginAndDestinationAndFlightDate("NYC", "SFO", "22-JAN-16")) { logger.info(flight.toString()); }
- Add the
logstashdependency to integratelogbackto Logstash in the Search service'spom.xmlfile, as follows:<dependency> <groupId>net.logstash.logback</groupId> <artifactId>logstash-logback-encoder</artifactId> <version>4.6</version> </dependency>
- Also, downgrade the
logbackversion to be compatible with Spring 1.3.5.RELEASE via the following line:<logback.version>1.1.6</logback.version>
- Override the default Logback configuration. This can be done by adding a new
logback.xmlfile undersrc/main/resources, as follows:<?xml version="1.0" encoding="UTF-8"?> <configuration> <include resource="org/springframework/boot/logging/logback/defaults.xml"/> <include resource="org/springframework/boot/logging/logback/console-appender.xml" /> <appender name="stash" class="net.logstash.logback.appender.LogstashTcpSocketAppender"> <destination>localhost:4560</destination> <!-- encoder is required --> <encoder class="net.logstash.logback.encoder.LogstashEncoder" /> </appender> <root level="INFO"> <appender-ref ref="CONSOLE" /> <appender-ref ref="stash" /> </root> </configuration>The preceding configuration overrides the default Logback configuration by adding a new TCP socket
appender, which streams all the log messages to a Logstash service, which is listening on port4560. It is important to add an encoder, as mentioned in the previous configuration. - Create a configuration as shown in the following code and store it in a
logstash.conffile. The location of this file is irrelevant as it will be passed as an argument when starting Logstash. This configuration will take input from the socket listening on4560and send the output to Elasticsearch running on9200. Thestdoutis optional and is set to debug:input { tcp { port => 4560 host => localhost } } output { elasticsearch { hosts => ["localhost:9200"] } stdout { codec => rubydebug } } - Run Logstash, Elasticsearch, and Kibana from their respective installation folders, as follows:
./bin/logstash -f logstash.conf
./bin/elasticsearch
./bin/kibana
- Run the Search microservice. This will invoke the unit test cases and result in printing the log statements mentioned before.
- Go to a browser and access Kibana, at
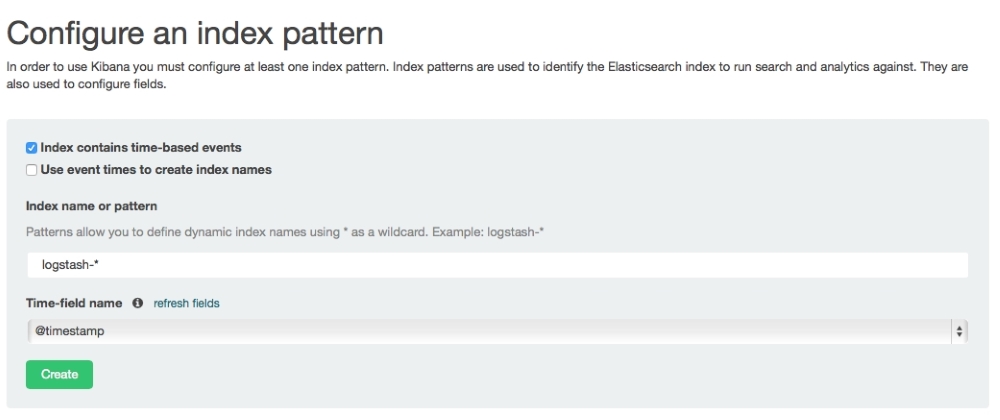
http://localhost:5601. - Go to Settings | Configure an index pattern, as shown here:
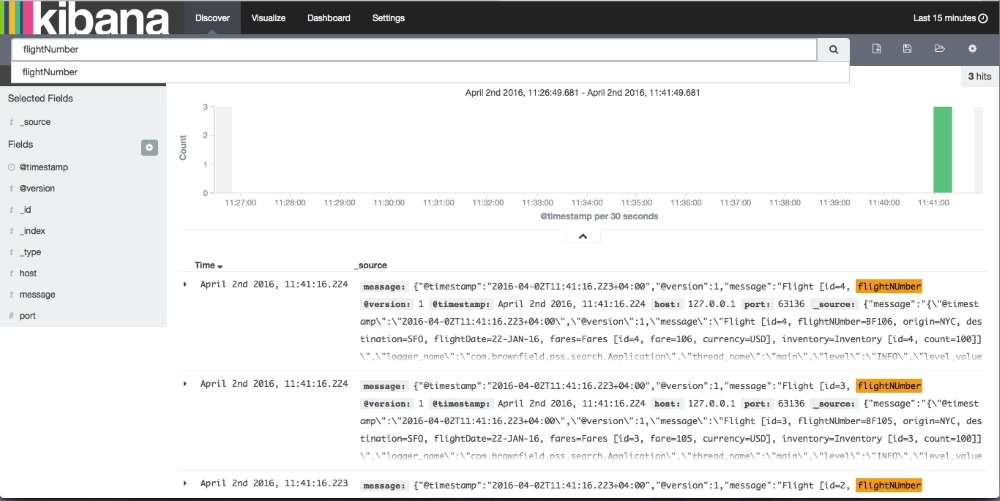
- Go to the Discover menu to see the logs. If everything is successful, we will see the Kibana screenshot as follows. Note that the log messages are displayed in the Kibana screen.
Kibana provides out-of-the-box features to build summary charts and graphs using log messages:
The previous section addressed microservices' distributed and fragmented logging issue by centralizing the log data. With the central logging solution, we can have all the logs in a central storage. However, it is still almost impossible to trace end-to-end transactions. In order to do end-to-end tracking, transactions spanning microservices need to have a correlation ID.
Twitter's Zipkin, Cloudera's HTrace, and Google's Dapper systems are examples of distributed tracing systems. Spring Cloud provides a wrapper component on top of these using the Spring Cloud Sleuth library.
Distributed tracing works with the concepts of span and trace. The span is a unit of work; for example, calling a service is identified by a 64-bit span ID. A set of spans form a tree-like structure is called a trace. Using the trace ID, the call can be tracked end to end:
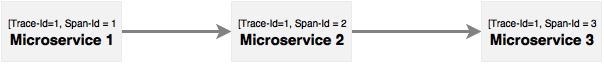
As shown in the diagram, Microservice 1 calls Microservice 2, and Microservice 2 calls Microservice 3. In this case, as shown in the diagram, the same trace ID is passed across all microservices, which can be used to track transactions end to end.
In order to demonstrate this, we will use the Search API Gateway and Search microservices. A new endpoint has to be added in Search API Gateway (chapter7.search-apigateway) that internally calls the Search service to return data. Without the trace ID, it is almost impossible to trace or link calls coming from the Website to Search API Gateway to Search microservice. In this case, it only involves two to three services, whereas in a complex environment, there could be many interdependent services.
Follow these steps to create the example using Sleuth:
- Update Search and Search API Gateway. Before this, the Sleuth dependency needs to be added to the respective POM files, which can be done via the following code:
<dependency>
  <groupId>org.springframework.cloud</groupId>
  <artifactId>spring-cloud-starter-sleuth</artifactId>
</dependency>
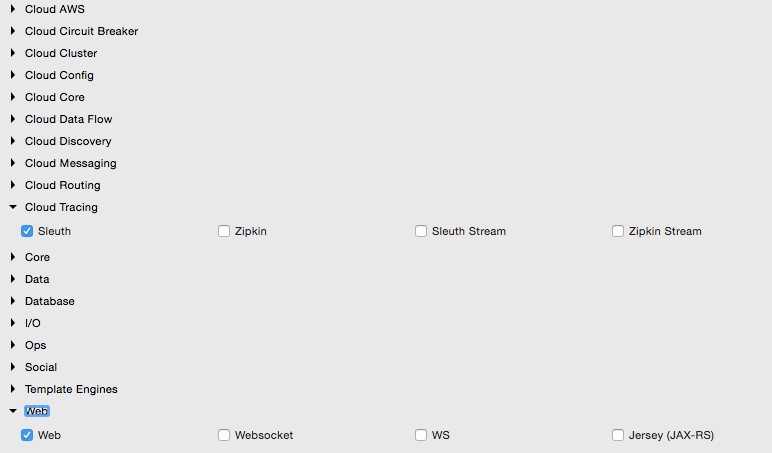
- In the case of building a new service, select Sleuth and Web, as shown here:
- Add the Logstash dependency to the Search service as well as the Logback configuration, as in the previous example.
- The next step is to add two more properties in the Logback configuration, as follows:
<property name="spring.application.name" value="search-service"/>
<property name="CONSOLE_LOG_PATTERN" value="%d{yyyy-MM-dd HH:mm:ss.SSS} [${spring.application.name}] [trace=%X{X-Trace-Id:-},span=%X{X-Span-Id:-}] [%15.15t] %-40.40logger{39}: %m%n"/>
The first property is the name of the application. The names given in this are the service IDs:
search-serviceandsearch-apigatewayin Search and Search API Gateway, respectively. The second property is an optional pattern used to print the console log messages with a trace ID and span ID. The preceding change needs to be applied to both the services. - Add the following piece of code to advise Sleuth when to start a new span ID in the Spring Boot Application class. In this case,
AlwaysSampleris used to indicate that the span ID has to be created every time a call hits the service. This change needs to be applied in both the services:@Bean public AlwaysSampler defaultSampler() { return new AlwaysSampler(); } - Add a new endpoint to Search API Gateway, which will call the Search service as follows. This is to demonstrate the propagation of the trace ID across multiple microservices. This new method in the gateway returns the operating hub of the airport by calling the Search service, as follows:
@RequestMapping("/hubongw") String getHub(HttpServletRequest req){ logger.info("Search Request in API gateway for getting Hub, forwarding to search-service "); String hub = restTemplate.getForObject("http://search-service/search/hub", String.class); logger.info("Response for hub received, Hub "+ hub); return hub; } - Add another endpoint in the Search service, as follows:
@RequestMapping("/hub") String getHub(){ logger.info("Searching for Hub, received from search-apigateway "); return "SFO"; } - Once added, run both the services. Hit the gateway's new hub on the gateway (
/hubongw) endpoint using a browser (http://localhost:8095/hubongw).As mentioned earlier, the Search API Gateway service is running on
8095and the Search service is running on8090. - Look at the console logs to see the trace ID and span IDs printed. The first print is from Search API Gateway, and the second one came from the Search service. Note that the trace IDs are the same in both the cases, as follows:
2016-04-02 17:24:37.624 [search-apigateway] [trace=8a7e278f-7b2b-43e3-a45c-69d3ca66d663,span=8a7e278f-7b2b-43e3-a45c-69d3ca66d663] [io-8095-exec-10] c.b.p.s.a.SearchAPIGatewayController    : Response for hub received,  Hub DXB


2016-04-02 17:24:37.612 [search-service] [trace=8a7e278f-7b2b-43e3-a45c-69d3ca66d663,span=fd309bba-5b4d-447f-a5e1-7faaab90cfb1] [nio-8090-exec-1] c.b.p.search.component.SearchComponent  : Searching for Hub, received from search-apigateway
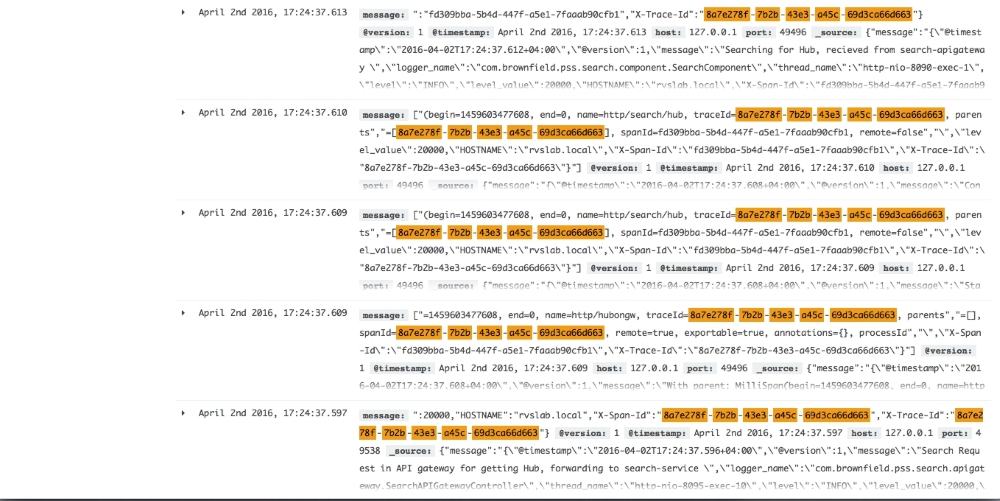
- Open the Kibana console and search for the trace ID using this trace ID printed in the console. In this case, it is
8a7e278f-7b2b-43e3-a45c-69d3ca66d663. As shown in the following screenshot, with a trace ID, one can trace service calls that span multiple services: