Now that you have successfully installed ArcGIS Pro, it is time to begin examining the user interface and how it works. ArcGIS Pro is the first Esri desktop product to make use of a ribbon interface, and this has become commonplace in many current desktop applications, including Microsoft Office, Adobe Creative Suite, and Autodesk's AutoCAD. The new ribbon makes accessing tools and functionality quicker and easier than the drop-down menu and toolbar interface used by the older ArcMap and ArcCatalog applications that ArcGIS Pro is replacing.
In this chapter, you will learn how to navigate this new ribbon interface used by ArcGIS Pro. We will also cover the following topics:
- Understanding the new interface terminology
- Using the interface
- Learning terminology associated with ArcGIS Pro ribbon menus
- Learning how to move between maps, scenes, and layouts
- Learning how to customize the ArcGIS Pro interface
Once you have completed this chapter, you will be much more comfortable working within ArcGIS Pro, as well as being more confident about where many of the tools you will use on a regular basis are located.
Technical requirements
To complete the exercises in this chapter, you will need the following:
- ArcGIS Pro Basic or higher license
- ArcGIS Pro 2.6 or higher installed on your computer
- An internet connection
Understanding the new interface terminology
Anyone who has worked in GIS will know that it has its own language. You will hear fellow GIS users using terms such as topology, shapefiles, networks, geodatabase, feature class, and more. As your experience with Geographic Information Systems (GIS) grows, this new language will become second nature. You will find yourself using those words in conversations without realizing you are doing it. While you may completely understand what you are saying, non-GIS users may not. Consequently, the new ArcGIS Pro ribbon interface will require you to expand your GIS dictionary.
In this section, you will begin to learn many of the new words and terms associated with the ribbon. This will allow you to navigatemore easily within the interface and follow the instructions in the exercises. Understanding this will also help you better communicate with other users and Esri tech support should the need ever arise.
ArcGIS Pro interface terminology
The new interface used by ArcGIS Pro has a whole new set of words and phrases associated with it. To successfully use, navigate, and understand this interface, you need to make sure you know what some of these are and what they mean. Let's take a look at this in the following table:
|
ArcGIS Pro term |
Definition |
|
Ribbon |
The rectangular menu area across the top of ArcGIS Pro. The ribbon is divided into tabs with group-related tools and functions. Some tabs are consistent while others are contextual, meaning they will change depending on tasks being performed. |
|
Tab |
A collection of related tools and functions accessed via the ribbon. Similar to Toolbars in ArcMap, tabs can be core or contextual. Core tabs are those that stay constant on the ribbon, such as Project and Share. Contextual tabs will change and appear depending on the tasks users are currently performing. Examples of Contextual tabs include Map, Layout, Appearance, and Labeling. |
|
Pane |
A dockable window that allows users to access information or tools. Similar to the dockable windows in ArcMap, such as Catalog, Search, ArcToolbox, and Table windows. Like those windows, panes can be opened and closed, pinned in place, or set to auto-hide. |
|
Group (on a Tab in the ribbon) |
A subset of related tools located within a tab. An example of a Group on a tab is Layer, which is located on the Map tab and contains multiple tools for adding layers to a map. |
|
Quick Access Toolbar |
A collection of shortcuts to commonly used tools and commands. The Quick Access Toolbar is typically located in the top left-hand corner of the ArcGIS Pro interface, although the position can be changed. This is similar to the Task Bar in Windows. |
|
View |
A window that allows you to view data and performs tasks. A view might be a 2D Map or a 3D Scene or a Layout, or some other visualization of your data. This is similar to the Data and Layout views in ArcMap. However, in ArcGIS Pro, you can have multiple views and see them displayed at the same time. |
These are some of the key terms you will need to understand as you begin to use ArcGIS Pro and navigate through its interface. As you start to use the interface, and if you used the older ArcMap application, I believe you will find it much more intuitive than the one used by ArcMap, which hides much of its functionality through a myriad of toolbars and menus.
Introducing the user interface
Now that you understand the key terminology associated with the new interface, it is time to see where these items actually are within ArcGIS Pro. You may ask yourself how the new ribbon-style interface makes accessing tools and functionality quicker. The answer to this question is two-fold:
- First, the new interface is smart. It will present you with the tools and information relevant to your current operation. For example, when working in a layout, tools associated with creating and printing a layout are presented. If you switch your focus by selecting a layer in a map, then a new series of options will be presented automatically that allows you to control and configure various layer properties, such as symbology and labeling.
- Second, the new ribbon interface is similar to that found in many commonly used applications, such as those mentioned in the first paragraph. This greatly reduces the learning curve and make users feel much more comfortable when working with ArcGIS Pro.
This automatic behavior in the ribbon is referred to as ContextualMenus or Tabs. The smart ribbon presents you with the tools when you need them. As you move on to other items or tasks, the ribbon automatically updates accordingly.
This not only puts the tools you need at your fingertips, but it also removes the need to have a large number of toolbars and windows open at the same time, thereby reducing screen clutter and opening up screen real-estate for other uses.
Let's take a quick look at the interface and see where some of these components and functions are located:

The preceding screenshot shows the location of several key components of the ArcGIS Pro interface. Starting at the top left-hand side, you will find the Quick Access Toolbar. This contains buttons that allow you to open an existing project, create a new project, save your project, undo, and redo. Located below that is the ribbon. This is where you access much of the ArcGIS Pro functionality through the various tabs. Below that you will find different panes and views. These will change depending on what your project contains and what you have open. The first time you open ArcGIS Pro, you will see the Contents pane on the left-hand side, the main view in the middle and the Catalog pane on the right-hand side.
As you progress through the book, you will see that you can dock and undock the various views and panes to best support your workflows and system. This provides great flexibility and increased efficiency when working in ArcGIS Pro.
Using the interface
It is time to start working with the ArcGIS Pro interface now that you know where several of the key components are located and the terms associated with the interface. You will start by using some of the tools in the core tabs on the ribbon. Then, you will work with different views and the contextual tabs associated with them. Lastly, you will investigate some of the panes.
Navigating the ribbon
Ribbon style interfaces are not new. They have become common for the majority of applications, including Microsoft Word, Excel, and PowerPoint, along with AutoCAD and Photoshop, as we have mentioned before. As a result, users have grown comfortable with the look of these ribbon interfaces and how they perform. However, Esri has been slow to adopt this type of interface in its desktop GIS applications until ArcGIS Pro.
ArcGIS Pro is Esri's first desktop application designed to fully embrace the ribbon interface. This new interface is much more user-friendly than the older toolbar-style interface found in their older ArcMap and ArcCatalog applications. As you will see, it is smart. It will make tools available based on what you have selected, and it will keep them active within the application. This means that you do not need to search to find the functionality you are looking for.
Now you will begin to investigate this interface more fully. We will start specifically with the ribbon, which is the rectangular area located at the top of ArcGIS Pro. It includes tabs, groups, and tools, as shown in the following screenshot:

When you first open a new project, you will typically see the Project, Map, Insert, Analysis, View, Edit, and Share tabs on the ribbon. Each tab contains tools associated with the name of the tab. For example, the Map tab includes tools for navigating within the map, adding layers, selecting features, and accessing information about the features in the map.
Let's now begin taking a closer look at a couple of the most frequently used tabs and some of the key tools located within that tab. You will look at others as you move through this book. You will start with the Project tab.
Project tab
The Project tab provides tools needed to manage the project and configure options. This tab allows you to create new projects, open existing projects, save your current project, and make a copy of your current project. You can also connect to different ArcGIS Online accounts or portals from this tab. You can see many of these settings, as shown in the following screenshot:
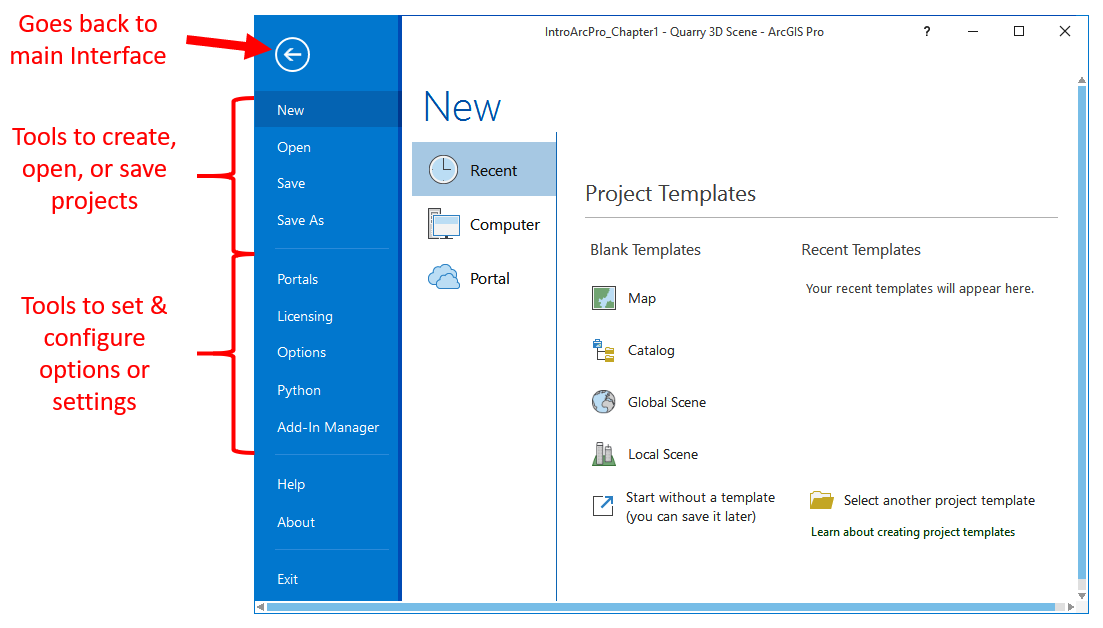
Let us look at the function of these tabs in more detail:
- New: This will create a new project using a selected template. The template controls what is automatically included in the newly created project. ArcGIS Pro includes several project templates out of the box. These are Catalog, Map, Global Scene, and Local Scene.
- Save: This saves the current project you have open. This will include any changes you have made to maps, layer properties, and layouts. This does not save edits you have made to features in the map or their attributes.
- Save As: This creates a copy of the current project file with a new name in the location you select. It does not create copies of referenced databases, folders, files, tables, or other project items found in the original project. The newly saved project will reference the same locations as the original.
- Portal: This allows you to manage which portals you are connected to. This can include a connection to ArcGIS Online or ArcGIS Enterprise Portal. The Primary Portal is used by ArcGIS Pro to determine whether you have a valid license and what level as well as what extensions you have the ability to use. Other portals can be used to access data, services, and base maps, which can be used to create maps and perform analysis within ArcGIS Pro, thereby supplementing your own standard datasets.
- Licensing: This allows you to see what ArcGIS Pro license level and extensions you have been granted. Once you know what license level and extensions are available, you can then determine what functions you will be able to perform in ArcGIS Pro.
After your initial login to use ArcGIS Pro, you do have the option to use your license offline, if your organization's administrator allows it. This checks out the license to the computer you are currently using and no longer requires you to be logged in to ArcGIS Online or ArcGIS Enterprise Portal to use ArcGIS Pro. Be careful when using this option. If the computer is lost or fails while the license is checked out for offline use, there is no easy way to get it back. You will need to contact Esri Support and have them resolve the issue.
- Options: This allows you to set various ArcGIS Pro user options, giving you the ability to customize it. You can set different options for the specific project you are working in, such as the units or for the application in general, such as a default base map for all new maps or scenes added to a project. As you explore each option, you can click on Learn more about the link, located at the bottom of the window for more information about the settings associated with that option.
- Python: This allows you to add additional Python modules for use in scripts to expand or automate ArcGIS Pro capabilities.
- Add-in Manager: This allows you to add custom extensions you or others may have created to enhance ArcGIS Pro's functionality. These add-ins must be created using .NET.
Map tab
The Map tab on the ribbon provides access to tools used to work with both 2D and 3D maps. From this tab, you can add new layers to your map, select features, change your base map, and more. For those who have used the older ArcMap application in the past, this tab combines functionality that was found on the Standard and Tools toolbars:

As you can see in the preceding screenshot, the Map tab contains seven groups:
- Clipboard
- Navigate
- Layer
- Selection
- Inquiry
- Labeling
- Offline
Each group then contains tools associated with the name of the group. For example, the Selection group tab includes several tools that allow you to select features in the map using various methods. You can select features directly from the map or based on specific attribute values or based on the spatial relationships between features in one or more layers. We will now take a closer look at a few of the most commonly used tools.
Navigate group
The Navigate group contains tools that allow you to navigate to locations within the map:

It includes tools that allow you to zoom in to areas, so you can see more detail, or to zoom out, so you can see a greater area. It also has tools that allow you to return to specific areas within the map. These are called bookmarks. Let's look at these tools in more detail:
- Explore: The Explore tool is a multifunction tool that allows you to zoom and pan within the map. It also allows you to click on features within the map and retrieve attributes linked to the feature. This tool combines the functions of the Zoom In, Zoom Out, Pan, and Identify tools into a single tool that is very similar to how your mouse works when using Google Maps.
You use this tool to navigate within your map using your mouse. The following list describes the function of the various mouse buttons for navigating the ArcGIS Pro interface:
- Left-click on a feature: Opens the Identify pop-up window, showing attributes linked to the feature.
- Left or Right Drag: Clicking and holding your left mouse button down and then dragging your pointer to the left and right pans your map view in that direction.
- Moving Scroll Wheel: Zooms in and out on the map. Scrolling the wheel away from you causes the map to zoom in. Scrolling the wheel toward you causes the map to zoom out.
- Right-Click and Drag: Continuously zooms the map in or out depending on the movement of the mouse.
- Single Right-Click: Opens a menu. The menu that appears will vary depending on where you right-click.
- Hold Down Scroll Wheel and Drag (3D Map/Scene Only): Rotates and tilts the map view along the 3D axis.
This tool works best with a mouse that has a scroll wheel in between the right and left buttons. Other types of pointing devices can be used, but the functionality may be different depending on your hardware. Some of the buttons associated with this tool can be altered under the Options tool located on the Project tab. For example, you can change the zoom direction of the scroll wheel.
- Bookmarks: The Bookmarks tool allows you to zoom to saved spatial locations within your active map. This allows you to quickly return to important locations such as project areas, special event locations, key parcels, and more. Each map or scene within your project will have its own set of unique bookmarks.
The drop-down arrow below the primary tool will allow you to access the bookmarks that have been saved with the active map or scene. It also provides access to tools for creating new bookmarks and managing existing ones. There is no limit to the number of bookmarks each map or scene can have.
We will now move on to the Layer group.
Layer group
The Layer group contains tools for adding new layers or data to your map:

Some tools work with both 2D and 3D data. Others work best with one or the other. There are also tools for adding non-spatial data to your map. These tools use either coordinate values or addresses to show the location of points. Again, let's explore these tools:
- Add Data: This tool allows you to add new 2D or 3D layers to your maps. Added layers can reference various types of data and can come from different locations. It also allows you to add tabular data.
If you look, you will notice a small arrow located below the icon for this tool. Clicking on the arrow or the text will display a list of methods for adding data to a map or scene. The methods you can select from include the following:
|
Data |
This option adds spatial or tabular data to a map. It can be used to add layers that reference shapefiles, geodatabase feature classes, and ArcGIS Server web services. Standalone tables can be added to a map from various sources, as well as dBase files, .csv files, database tables, and Excel spreadsheets. |
|
Add Data from Path |
This option allows you to add data using a Uniform Resource Locator (URL) for a service, Universal Naming Convention (UNC) for a local data source, or a catalog path for a connected data source. |
|
X,Y Point Data |
This option allows you to add points to a map based on coordinates stored in a standalone table, .csv file, text file, or spreadsheet. Each point will also be linked to the additional attributes or information associated with that record or row. |
|
Route Events |
This option shows the location of the route between points of interest along a linear network. |
|
Query Layer |
This option creates a query layer from an enterprise database based on a Structured Query Language (SQL) select statement. This does not work with a file geodatabase, shapefile, or coverage. |
|
Address Layer |
This option geocodes a table of addresses using a specified address locator, creating a new geodatabase feature class or shapefile. |
|
Add Multidimensional Raster Layer |
This option allows you to add Network Common Data Form (NetCDF), GRIdded Binary (GRIB), or Hierarchical Data Format (HDF) raster formats to your map or scene. These are multidimensional raster formats commonly used with atmospheric, oceanographic, or earth science. |
|
Elevation Source |
This option allows you to add an elevation surface to a map or a scene. This can be a Digital Elevation Model (DEM), Triangulated Irregular Network (TIN), or web terrain service, among others. The elevation source might represent the ground elevation for an area or some other specific elevation, such as the maximum permitted building height. |
|
Extract Locations |
This option allows you to extract point locations from documents. The locations may take the form of an X and Y coordinate or an address. This requires the LocateXT extension for ArcGIS Pro. |
As you can see, there are many ways to add data to a map or scene in ArcGIS Pro. The method you should use will depend on the type of data you wish to add. As you work through this book, you will get the opportunity to use several of the aforementioned methods.
- Add Preset: This tool is used to add new 3D layers to a scene with a predefined set of symbology settings. Predefined properties are determined from a gallery of defined symbology. ArcGIS Pro comes with galleries for Realistic Trees, Thematic Trees, Realistic Buildings, Ground (Terrain), Icon Points, and Thematic Shapes. Using this tool to add layers makes visualizing data in a 3D environment easier, especially for those who may be new to working with 3D data.
- Add Graphics Layer: This is a new tool which was added with ArcGIS Pro 2.6. It allows you to add graphics to a map such as a text box or an arrow or other shape. These graphics are not connected to any layer or feature within a map.
We will examine the Selection group next.
Selection group
The Selection group contains various tools used to select data, including Select, Select By Attributes, Select By Location, and Clear:

The selection tool you should use will depend on what you are trying to accomplish and how you need to select your data to complete your task. Let's look into these:
- Select: The Select tool allows you to select features from within a map or scene by clicking on a feature or drawing an area. The drop-down arrow located at the bottom of the tool lets you select what type of area you want to draw. You have options to draw a rectangle, polygon, freehand lasso, circle, or line, or to trace existing features in the map.
- Select By Attributes: The Select By Attributes tool allows you to select features based on specified attribute values. For example, you might want to select all parcels owned by Tripp Corbin or all sewer pipes made of ductile iron. This tool will allow you to do that.
In the tool window, you will create a SQL where clause, which tells the application which specific values you are searching for. Do not be concerned if you do not know how to write a SQL clause. ArcGIS Pro builds the query based on a series of easy selections and inputs you are prompted to provide.
- Select By Location: This tool allows you to select features in one or more layers based on a spatial relationship. For example, you might select all parcels located within 100 feet of a road you know is going to have work done on it, so you can get a list of all those who live along the road. Or you might select all the roads that intersect or cross a floodplain, so you know not to include those in an emergency evacuation plan.
In earlier versions of ArcGIS Pro, the Select by Attribute and Select by Location tools opened in the Geoprocessing pane. In ArcGIS Pro 2.6, these now open in their own floating window. Next, we will explore the Inquiry group.
Inquiry group
The Inquiry group contains tools that allow you to retrieve some basic information about your map. You can measure lengths and areas in different units, retrieve some basic demographic data, or even find a point of interest using the tools in this group:
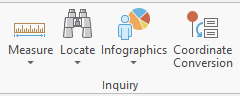
The details of these tools are as follows:
- Infographics: This tool allows you to retrieve basic demographic data for the area you select in the map. It will retrieve information and graphs showing average household income or population ethnicity makeup.
- Measure: This tool allows users to measure length and area by simply clicking on locations within a map. If you are working within a 3D scene, you also have the option to measure vertical distances.
- Locate:This tool allows you to locate a place using an address or common name. By default, this tool uses the Esri World Geocoder service from ArcGIS Online. This service requires you to have an active connection to ArcGIS Online to work. However, unlike the Infographics tool, it does not use credits. You can add and use your own address locators to your project and they will then be available for use with this tool.
- Coordinate Conversion: This is another new tool that was added to ArcGIS Pro 2.6. It allows you to convert coordinates from one coordinate system to another. Currently this tool requires the input coordinates to be in the WGS84 geographic coordinate system. The output can be a shapefile, geodatabase feature class, KMZ or CSV file
You have now been introduced to the tools located on the Map tab in the ArcGIS Pro ribbon. These tools are some of the ones you will use most often while working in the application. We will now move on to an exercise concerned with working with the Map tab.
Exercise 2A – Working with the Map tab
You will now get to take some of the tools we have discussed for a test drive. You will see how they work within the ArcGIS Pro ribbon interface and some of the options associated with those tools first hand. We will start by opening an existing project and using the Navigation tools.
Step 1 – Opening a project
In this step, you will open a project that has already been created. This project includes a single 2D map with several layers for the imaginary City of Trippville:
- Start ArcGIS Pro either by clicking on the Windows Start button and going to the ArcGIS program group, or by clicking on a shortcut located on your taskbar or desktop.
- In the ArcGIS Pro start page, click on the Open another project option located below Recent Project, as indicated in the following screenshot:

- Click on Computer in the left panel of the Open Project window.
- In the right panel, double click on your C: drive.
- Navigate to C:StudentIntroArcProChapter2 or to the location in which you installed your exercise data.
- Select the Ex 2A.aprx file and click OK.
The project you selected should open in ArcGIS Pro and look similar to the following screenshot:

There are several things that might cause your project to look different. The size of the ArcGIS Pro application on your monitor will impact how it displays. The resolution you have your computer set to will also impact how the project looks. In addition to this, the panes, windows, and customizations you have open will also change how the project looks on your screen. So, do not be too concerned if the project you see does not look exactly like the screenshot. It should just be similar.
Step 2 – Navigating the map
With a project open, you will now begin to explore the map you see. You will use navigation tools located on the Map tab in the ribbon to zoom and access data:
- Activate the Map tab in the ribbon. Then, click on the Bookmarks tool in the Navigate group and select the Washington Park bookmark. This will zoom you to the location of Washington Park automatically.
- Click on the Explore tool in the Navigate group on the Map tab to make it the active tool.
- Left-click on the parcel for Washington Park. Continue to hold the mouse button down and drag your mouse toward the lower left-hand corner of the map view until Washington Park is in the lower left-hand corner. Now, release your mouse button.
You have just used the Explore tool to pan the map view. As you learned earlier in this chapter, the Explore tool has many uses. Now you will explore some of the other functions of this tool.
- With the Explore tool still active, click on any parcel within the map view.
- Close the pop-up window that has appeared by clicking on the small X in the upper-right corner of the window.
- Click on the small drop-down arrow located below the Explore tool and select Visible Layers, as shown in the following screenshot:
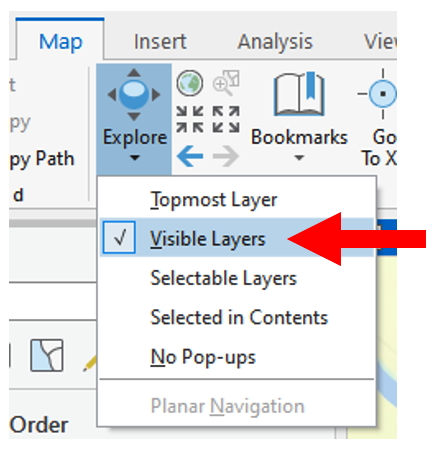
- Click on the same parcel as you did in step 4.
- Look at the bottom of the information pop-up window. You should see 1 of 2 located in the lower left-hand corner. Also in the upper panel of the window, you should see two items listed. If you do not, this part of the window is too small to show all the information at one time:
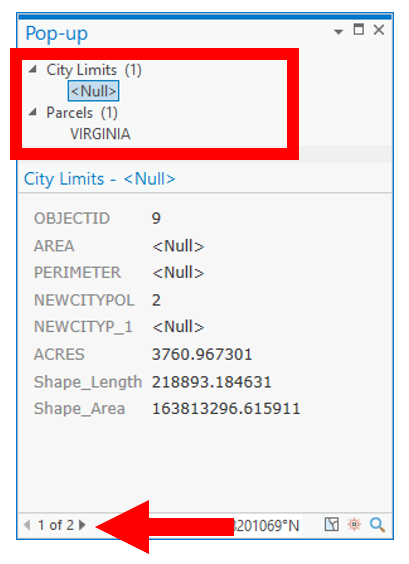
You can use the scroll bar on the right side to move up and down.
- Click on the small arrow located to the right of 1 of 2. This will toggle you to information about the other feature you clicked on. Also, watch what happens in the top panel of the window while you click on the small arrow.
- In the top panel, you should also see two items. They are grouped by the layer they are in. Click on the value below City Limits and see what happens. Then, click on the value below Parcels and watch the information in the lower panel.
As you have now seen, you can click either on the small arrows at the bottom of the pop-up window or on the individual values in the top panel to access information about the features you clicked on while using the Explore tool. This is a quick way to retrieve basic information about the features you see on the map.
The pop-up window can also be resized and moved if needed. You can even move to another monitor or display by clicking on the title area at the top of the window and dragging it where you want it. You can also dock it within the ArcGIS Pro interface so it will always appear in the same location, making it easier to find. Let's see how that works.
- Click on the title area of the pop-up window and continue to hold down your left mouse button. When you do this, you should see tan and white docking icons appear in the ArcGIS Pro interface, as illustrated in the following screenshot:

- With your left mouse button still pressed, drag your mouse pointer to one of those docking icons. You can choose anyone you want. Once your pointer is hovering over one of the docking icons, release your mouse button.
Once you release your mouse button, the pop-up window should dock itself in that location within ArcGIS Pro. The window will then continue to appear in that location whenever you use this function of the Explore tool, even if you close the window.
- Close the pop-up window by clicking on the small X located in the upper-right corner.
You have now explored some of the basic functions associated with the Explore tool. You will continue to use this tool throughout the book, allowing you to learn even more about it. But now it is time to move on to another tool.
Step 3 – Using the Infographics tool (optional)
Now, let's take a quick look at the Infographics tool. As mentioned earlier, this tool allows you to retrieve demographic information using Esri's GeoEnrichment Service from ArcGIS Online. This tool does use ArcGIS Online credits, which are the currency for ArcGIS Online. However, the amount used for this step will be minimal. You should use less than one credit by the time you complete this step.
If you are concerned about using ArcGIS Online credits, or you have been restricted by your administrator, you can skip this step:
- In the Contents pane typically located on the left side of the ArcGIS Pro interface, right-click on the City Limits layer. Then, select Zoom to Layer from the menu that appears. The map should zoom to an area that displays the entire city limits for Trippville.
- On the Map tab in the ribbon, click on the Infographics tool in the Inquiry group.
- Click somewhere in the northern part of the city of Trippville within the city limits boundary and north of the railroad line that runs through the center of the city, as illustrated in the following screenshot:

The Infographicswindow will open, displaying demographic information for the area. The window should look similar to the following screenshot. Esri is constantly updating and improving this tool, so what you see may look a bit different. Do not worry if it does, as long as you see something:
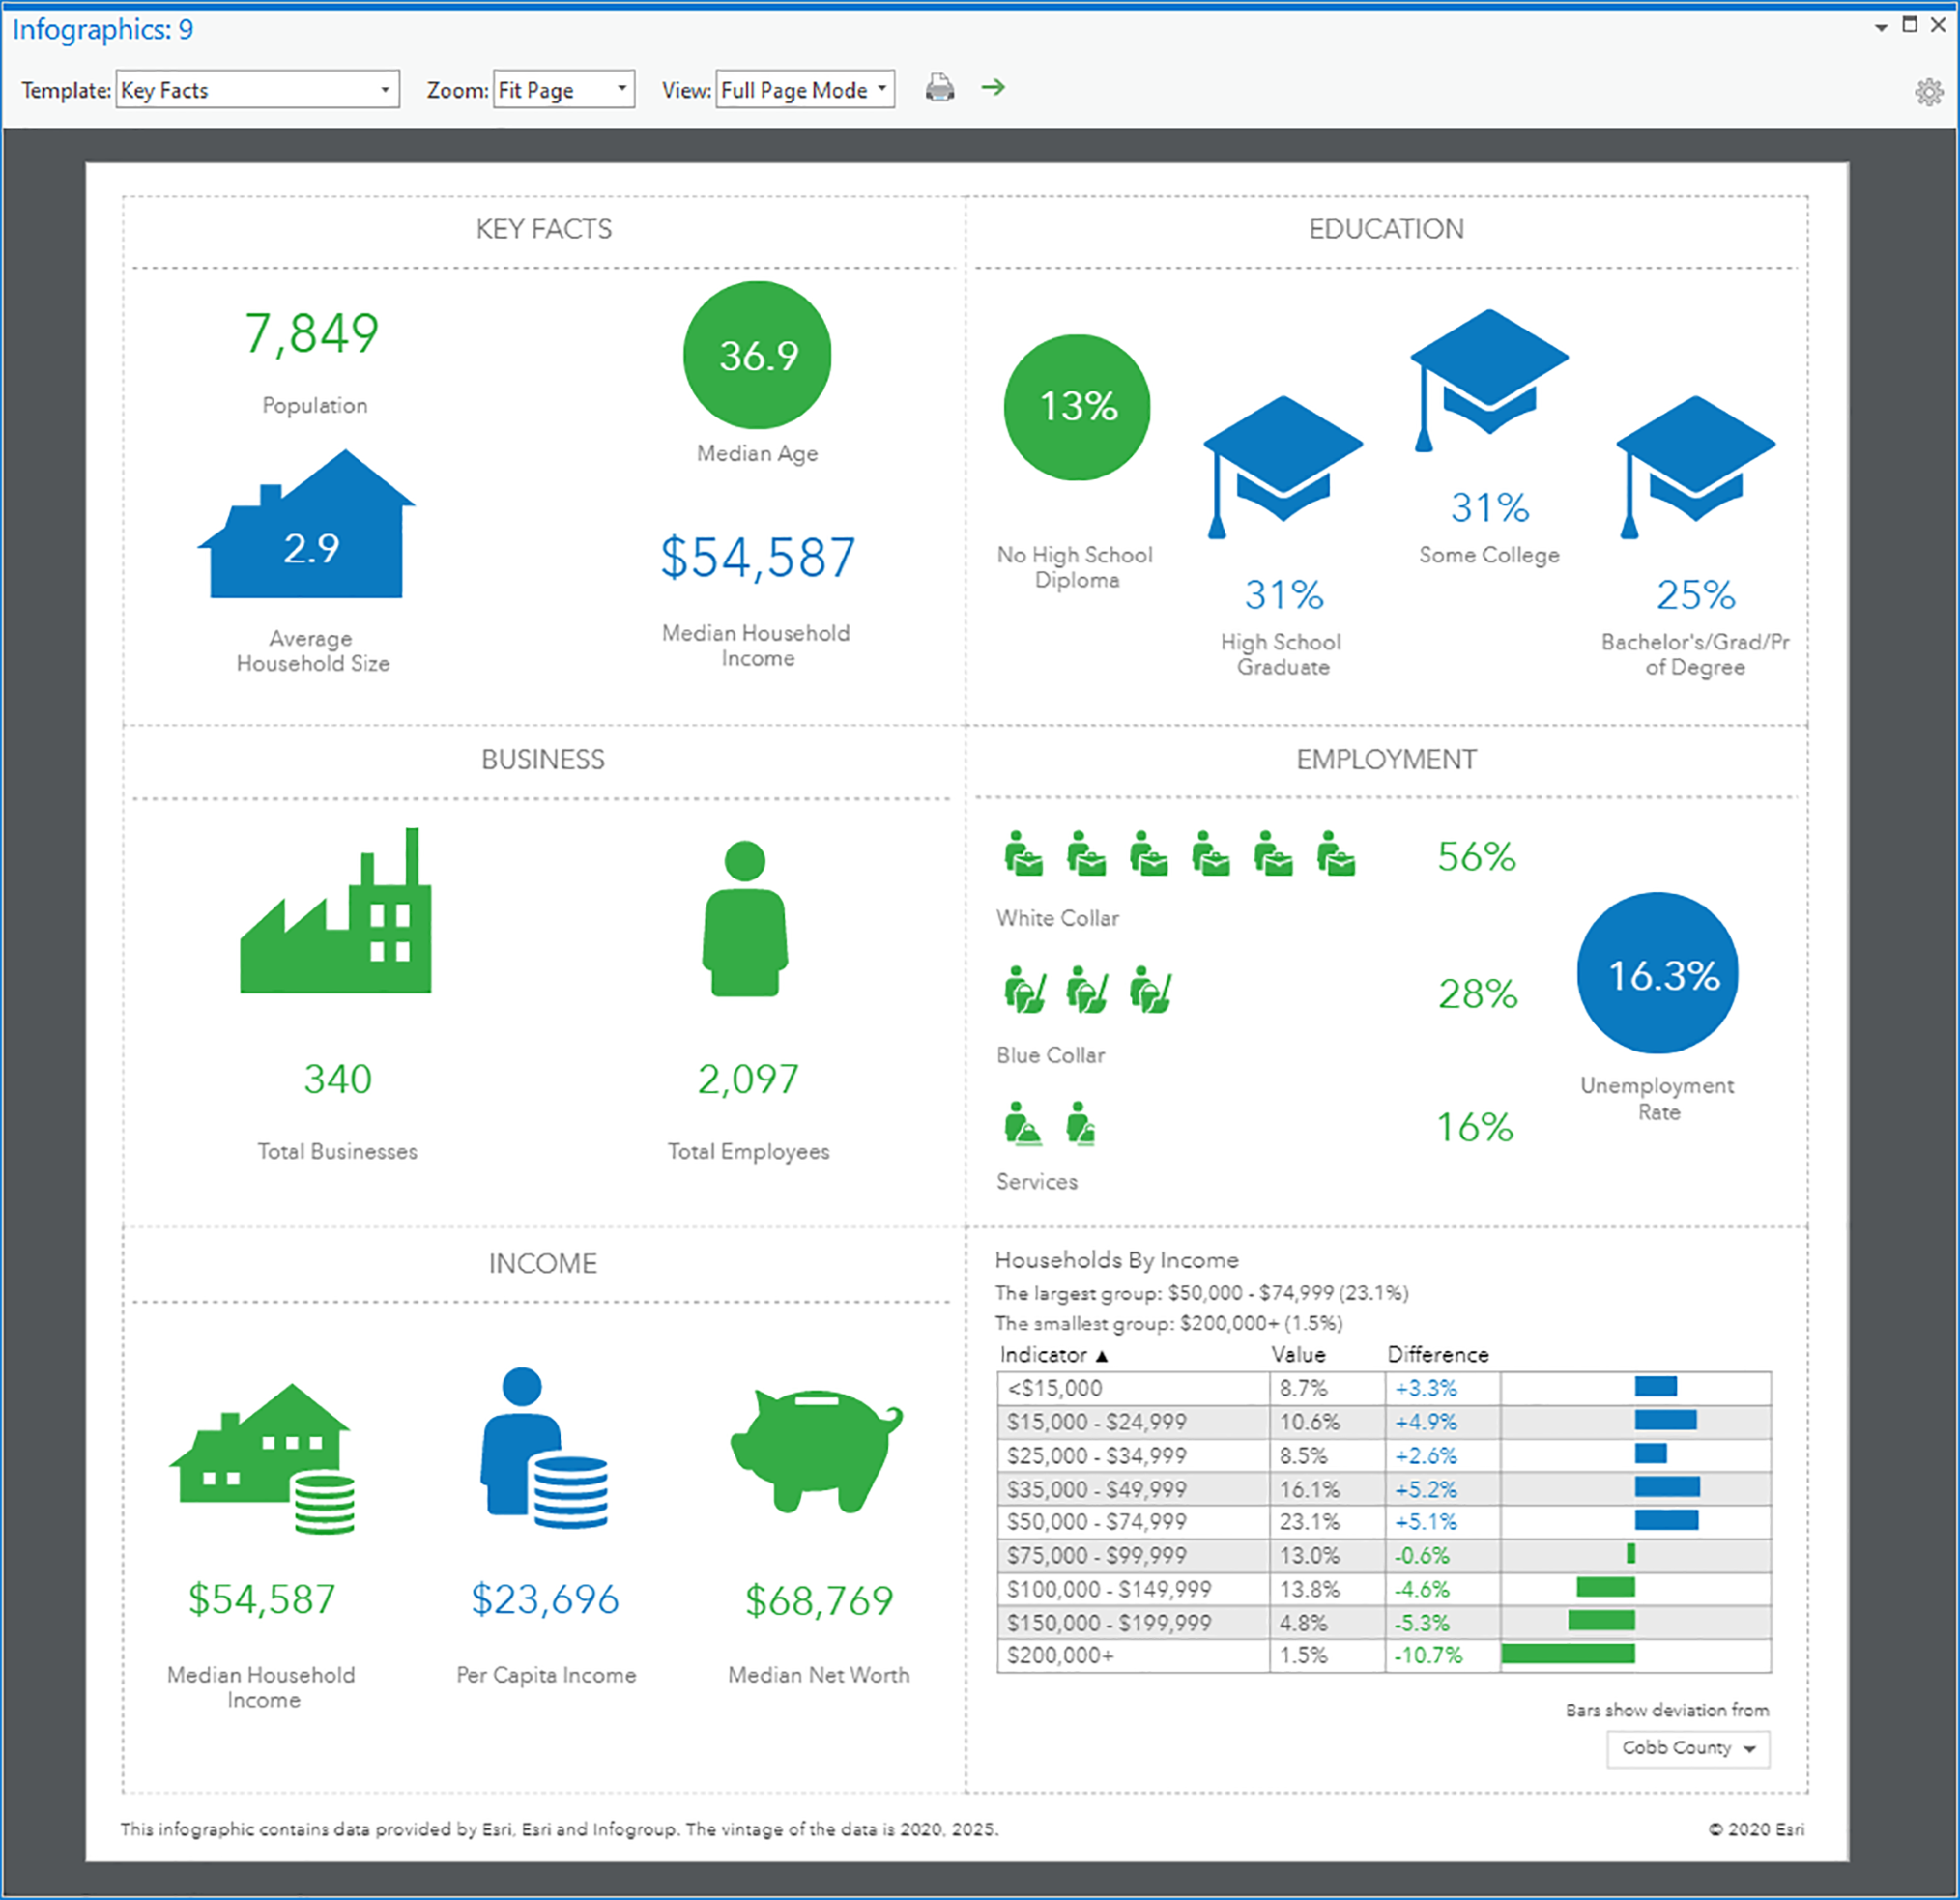
If this is the first time you have used this tool, you start with the KEY FACTS screen. This provides basic demographic information about the area you clicked on.
- In the Infographics window, click on one of the items you see. This will display more detailed information about the item you clicked on.
- Continue exploring the Infographics tool. Try changing the Template option located at the top of the window. Explore some of the template options.
- Once you are done exploring the Infographics tool, close the window.
- Now, click on the Project tab in the ribbon.
- Select Save As from the menu choices on the left side.
- In the Save Project As window, navigate to C:StudentIntroArcProMy Projects. Name your project your name_Ex2A (that is, Tripp_Ex2A) and click Save.
- Once you have saved your project, close ArcGIS Pro.
You have now successfully opened an ArcGIS Pro project, retrieved information about features you saw on the map, and navigated to different locations on the map. These are very common tasks that you will use a lot. Now it is time to move on to the concept of contextual tabs.
Now that you have had a chance to gain some experience of using ArcGIS Pro and the ribbon, you hopefully have begun to understand the concepts of tabs. It is time to move on to a more advanced but related concept, contextual tabs.
Learning about contextual tabs
Contextual tabs are smart tabs that appear when you select an item within ArcGIS Pro. This could be a layer, a map, a layout, a table and so on. When you select one of these items, a tab or tabs will appear on the ribbon that contains tools specific to working with that item.
These are often grouped into a contextual tab set. For example, if you select a layer from the Contents pane, the Feature Layer contextual tab set will appear, which contains three contextual tabs, namely, Appearance, Labeling, and Data. You will examine the Feature Layer contextual tab set and the tabs it contains next. You will explore other contextual tabs throughout other chapters in the book.
Understanding the Feature Layer contextual tab set
The Feature Layer contextual tab set appears when you select a layer within the Contents pane. It includes three contextual tabs, namely, Appearance, Labeling, and Data tabs. Each of these allows you to access various properties associated with the layer you have selected. The following screenshot illustrates this contextual tab set and its included contextual tabs:

We will now examine each of these contextual tabs in greater detail, starting with the Appearance tab.
Learning about the Appearance tab
The Appearance tab contains tools that control the display of the selected layer. Here, you can change the symbology, set visibility scales, apply transparency, and more:
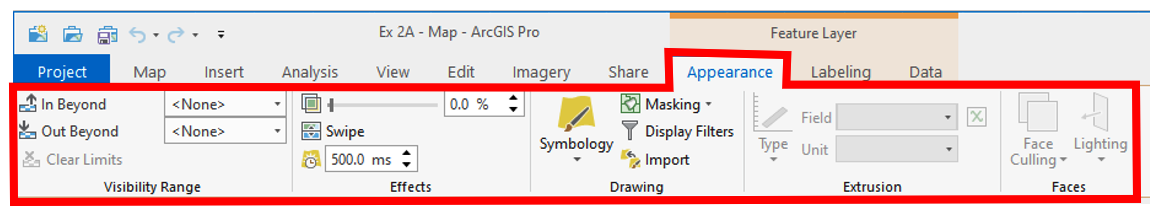
You can see that there are five groups within the Appearance tab. These are Visibility Range, Effects, Drawing, Extrusion, and Faces. We will learn about these groups in the upcoming sections.
The Visibility Range, Effects, and Drawing groups will be available for all layers.
Visibility Range group
Visibility Range allows you to set scales at which the layer will be visible or not. This allows you to control the level of detail displayed in a map based on how close you are zoomed in or out:

This reduces clutter, improves readability, and increases the redraw performance of the map. You would want to apply a visible scale range to a layer if it contains a lot of detailed information that may overlap or start to merge together if you zoom out. This is also good to apply to any map you intend to publish as a web service via ArcGIS Online or ArcGIS Enterprise.
Effects group
The Effects group, shown as follows, contains several interesting and useful tools if you have a map that contains overlapping layers that may hide one another:

The following is a description of the functions of the various tools you will find in the Effects group:
- Transparency: The Transparency tool includes the slider bar, which is used to apply transparency to the selected layer. By making a layer more transparent, you can see other layers that may be beneath it in the map.
- Swipe: Below the Transparency setting is the Swipe tool. This tool does exactly what the name implies. It allows you to swipe the selected layer out of the way with your mouse. You can swipe left to right, right to left, top to bottom, or bottom to top. This allows you to temporarily turn a portion of a layer on or off as you swipe. This tool is good for performing comparisons between two or more layers.
- Flicker: Below the Effects tool is the Flicker tool. This tool will cause a layer to automatically flick on and off based on the specified interval.
We will examine the Drawing group next.
Drawing group
The Drawing group controls various display properties for the selected layer, such as what symbology is used, using one layer to hide or mask another, and applying display filters so that only specific features within the selected layer appear at specified scales. The following screenshot shows you the various tools you will find in this group:

The following is a description of the function of the tools included in this group:
- Symbology: The Symbology tool allows you to control which type of symbology you wish to apply to the layer. This can be a single symbol, unique symbols, graduated color symbols, and more. You will learn more about the different types of symbol methods in Chapter 3, Creating 2D Maps.
- Masking: This tool allows you to mask or hide features in one layer based on features in another layer. This can reduce clutter in the map and make it easier to read.
- Display Filters: This tool allows you to control when specific groups of features within the layer become visible at specified scales. The groups are created based on a query or expression you create.
- Import: This tool allows you to import the symbology settings for a layer based on another existing layer or a layer file.
We will examine the Extrusion and Faces groups next.
Extrusion and Faces groups
Extrusion and Faces groups will only be available when working with a 3D scene. Extrusion allows you to extend 2D features above a 3D surface, such as building footprints or light poles. The following is a screenshot of these two groups:

The Extrusion layer must be in the 3D Layers category in the Contents pane. The Faces group contains tools to control transparency and lighting in a 3D scene. Face Culling allows you to see through parts of a 3D feature. Lighting allows you to create and control shadows. You will learn more about some of these tools and settings in Chapter 5, Creating and Working with Projects.
We will learn about the Labelling tab in the next section.
Learning about the Labeling tab
Labels are one method of adding text to a map or scene. They provide useful information about features shown in a map, such as a road name, parcel owner, or asset inventory number. Labels are dynamic. This means several things.
First, they are linked to values stored in the layer's attribute table. Second, the computer will place the labels based on the settings you configure. The labels will shift and change position as you pan or zoom within the map.
The following screenshot shows you the visual for the Labeling tab:

The Labeling tab contains six groups. These are as follows:
- Layer
- Label Class
- Visibility Range
- Text Symbol
- Label Placement
- Map
The contextual tab allows you to access tools for adding and configuring text labels to the features within the selected layer. The tools presented on this table will vary depending on what type of layer you have selected. Points, lines, and polygons will have different options.
For example, when labeling a line layer, you can place the label above, below, or on the line and oriented parallel, perpendicular or curved along the line, whereas with a polygon layer, you can choose to place the label within the polygon onlyor you can allow them outside the polygon. You can also select whether the label will be horizontal only or allowed along a diagonal in the polygon. This is called straight in ArcGIS Pro.
We will look at the aforementioned six groups in the upcoming sections.
Layer group
This group contains a single tool – Label. The Label tool turns labeling on or off for the selected layer. This is just one of several ways in which labels for a layer can be turned on or off.
Label Class group
The Label Class group contains tools that allow you to determine what features you wish to label and what field or fields from the attribute table you wish to label them with. The following screenshot shows the tools you will find in this group:

The following list provides descriptions of the tool functions in this group:
- Class drop-down selection: This allows you to select which label class you want to make setting changes to. Each label class can have its own unique label settings. For example, you could create a label class based on the type for each road so that highways could be labeled using a different setting than a local city road. This can greatly expand the flexibility of labels. A layer will have at least one label class, called Class 1. Unless you create a Label Class query, this default class will include all features in the layer.
- Label Class Query: This tool allows you to create a query, which, in turn, creates a new label class. The new class will contain features that meet the conditions called for by the query you build. For example, you might want to label all commercial properties differently to residential properties. So, you would want to create a label class for the commercial properties using a query that filters just those properties.
- Label Features In This Class: This turns the labels on or off for the class that is displayed in the Class drop-down selection. If the layer has only a single label class, this will turn the labels on or off for the entire layer.
- Field drop-down selection: This drop-down option allows you to select the field from the layer's attribute table that you want to label the features of on the map. This dropdown will automatically populate with the fields found in the selected layers attribute table.
- Label Expression: This tool will open the Label Class pane and allow you to build a custom labeling expression. Labeling expressions allow you to label using multiple fields, add more information to the label, split a label across multiple lines, and more. You can create expressions using the VBScript, JScript, Python, or Arcade languages.
Text Symbol group
The Text Symbol group tab contains tools and settings that control how a label is visualized:
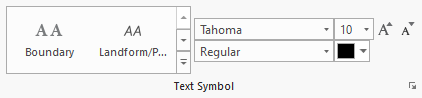
Here, you can change the font, size, and color. You can also choose to make the label bold, italicized or underlined. ArcGIS Pro also includes several predefined label styles that you can also choose to use from this group tab.
Label Placement group
The Label Placement group tab controls the general placement of the label in relation to the feature being labeled:
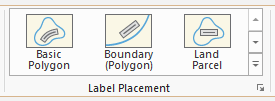
The options here will vary depending on whether you are working with points, lines, or polygons. For example, for a line layer, you will have the options to place the label above, below, or on the line. The options for a point or a polygon layer will be different.
Map group
The last group tab is Map. The tools located here control the drawing of the labels within the map:
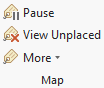
Let's look at these options in more detail:
- Pause: Pauses the redraw of labels on the map for faster performance.
- View Unplaced: Displays the location of labels that have not been placed on the map because of a conflict with other features or labels based on your configuration settings.
- More: This provides a drop-down menu to other options or settings, as shown in the following screenshot:
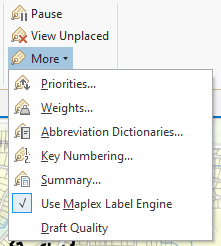
The tools located under the More menu provide more advanced settings for your labels and how they interact with other labels and features. You can also select what label engine you wish to use in your map. By default, ArcGIS Pro uses the Maplex Label Engine. This is one of two engines you can use. The other is the Esri Standard Label Engine. Maplex is the more advanced of the two and provides greater configuration options for your labels.
Learning about the Data tab
The Data tab contains tools that interact with the attribute table for the selected layer. It contains eight groups:

Those groups are as follows:
- Definition Query
- Table
- Selection
- Design
- Archiving
- Relationship
- Export
- Visualize
We will only explore some of the most commonly used groups and tools found on this tab.
Definition Query group
This group only contains a single drop-down list option. The dropdown will populate with any definition queries you have created for the selected layer and apply the query you select. Definition queries allow you to apply a filter to the features displayed in a layer so you only see those features that meet the criteria called for by the query. This helps reduce clutter in the map and improve performance.
Table group
This group contains two tools that will open the attribute table for the selected layer. One opens the entire table and the other only opens the table to show selected features. Let's explore these:
- Attribute Table: This option opens the attribute table for the selected layer. The attribute table contains additional information about the features displayed on the map.
- Table from Selection: This option opens the attribute table for the selected layer, but only displays records in the table for the features that have been selected. If no features are selected, then this icon will be grayed out.
Selection group
This group contains tools that allow you to select or deselect records from within the table. Records are the rows you see in the table. If you are looking at an attribute table, each record in the table corresponds to a feature within the layer on the map. Hence, selecting a record in the table will also select a feature on the map. Let's look at these in more depth:
- All: This tool selects all records within the active table.
- Switch: This tool reverses your selection. All records that were not selected originally become selected, and all those that were selected are deselected.
- Clear: This tool clears your selection. This means it deselects all selected records, leaving you with nothing selected.
- Layer from Selection: This tool creates a new layer that contains the features that were selected. This new layer will reference the same data source, but will only display the features that were selected originally.
Export group
This group contains tools that allow you to export features or records to a new data source. This can be a new feature class or standalone table, depending on what tool you choose.
- Export Features: This tool will export features in the selected layer to a new shapefile or geodatabase feature class, creating a copy of the layer at the time of export.
- Export Table: This tool will export the records from the selected layers attribute table to a new standalone table. The new table can be saved to a geodatabase or a .dbf file.
The remaining groups on this tab will not be covered as they are too advanced for the level of this book. Some are discussed in the ArcGIS Pro 2.x Cookbook by Packt if you want to learn more about them. Now it is time for you to put some of this new-found knowledge to the test.
We will now move on to the next section about working with 2D and 3D layers as we are now familiar with contextual tabs and all of their components.
Exercise 2B – Working with 2D and 3D layers
It is now time to see how the tools contained in the Feature Layer contextual tab set work. In this exercise, you will use tools on the contextual tabs found in the tab set to make changes to layers within an existing project. You will change a layer's symbology, labels, and more.
Step 1 – Opening the project and adding layers
In this step, you will open a project that has already been created. You will then add some additional layers to a map:
- Using the skills you have already learned, start ArcGIS Pro and open the Ex 2B project. This project is located in C:StudentIntroArcProChapter2 or the location where you installed the course data.
- Activate the Map tab and then click on the Add Data tool located in the Layer group.
- Expand the Project folder in the panel located on the right-hand side of the Add Data window by clicking on the small arrowhead. Then, select the Databases folder so you see two geodatabases, IntroArcGISPro Exercise 2A and Trippville_GIS.
- Double-click on the IntroArcGISPro Exercise 2A geodatabase so that you can see its contents.
- While holding down your Ctrl key, click on the bldg._footprints, RR_Tracks, and Street_Centerlines feature classes to select them, as shown in the following screenshot. Then, click the OK button to add the selected feature classes to your map:

You have now added three new layers to a map from a geodatabase. They should appear in your map once you press the OK button. Take a moment to notice where the new layers were placed in the Contents pane within the layer list. The bldg_footprints layer should appear below the other two layers you added because it is a polygon layer. Street_Centerlines and RR_Tracks are added to the top of the list because they are line layers.
Now that you have added the new layers, you need to configure some of their properties, such as symbology.
Step 2 – Changing symbology
You have just added three new layers to the map. Now you need to adjust the symbology for the layers you added. You will change the railroad layer you added to use a common railroad symbol. You will similarly change the building footprints. Lastly, you will adjust the road centerlines so that they are symbolized based on their condition:
- Right-click on the bldg_footprints layer in the Contents pane and select Properties from the menu that appears. The layer may also be named Buildings.
- Click on General located in the pane on the left side of the Properties window.
- Change the name to Building Footprints and click OK. Notice what happens to the layer in the Contents pane.
When you right-clicked on thebldg_footprintslayer, did you notice what happened to the ribbon? The Feature Layer context tab automatically appeared, providing access to the tools it contains. You will now use those tools to make adjustments to the Building layer you just renamed.
- Ensure that you still have the Building Footprints layer selected in the Contents pane. Then, select the Appearance contextual tab in the Feature Layer contextual tab set.
- Click on the Symbology tool to open the Symbology pane on the right side of the ArcGIS Pro interface. The Symbology pane allows you to make changes to the symbology settings for a layer.
- In the Symbology pane, verify that Primary Symbology is set to Single Symbol, as shown in the following screenshot. If it is not, use the drop-down arrow to set it to Single Symbol, like so:

The color for your current symbol may differ from what is shown in the preceding example. ArcGIS Pro randomly assigns colors to new layers as they are added to a map.
- Click on the small sample symbol located to the right of the word Symbol. This will open the Symbology pane to the Symbol Gallery, as shown in the following screenshot:
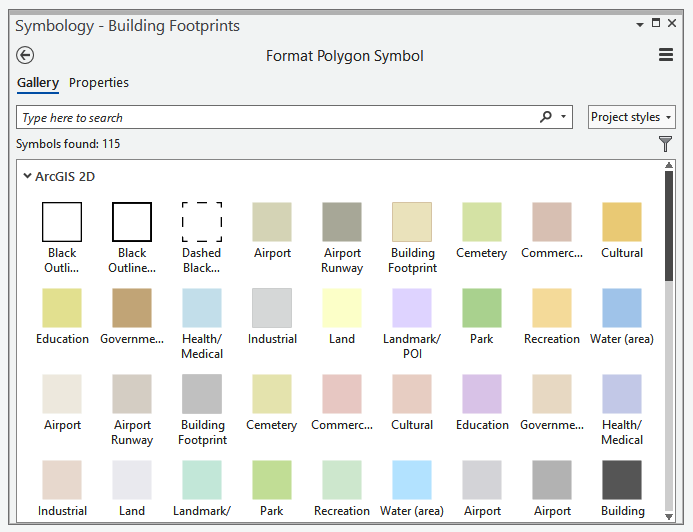
- In the search box located near the top of the Symbology pane, type Building Footprint to filter the gallery to only symbology associated with building footprints.
You have just changed the symbology for the building footprints layer. Symbology is important because it allows you to differentiate between different layers so that you can identify features in one layer from those in another.
- Select any of the symbology samples that you see in the gallery that are associated with building footprints.
- Now, select the RR_Tracks layer in the Contents pane and watch what happens in the Symbology pane.
- Click on the sample symbol located to the right of the word Symbol to once again open the gallery.
- Using the same process from before, change the symbology to the Railroad symbol in Gallery, shown in the Symbology pane, as shown in the following screenshot:

- In the search box located at the top of the Symbology pane, type Railroad to filter the gallery to symbology for railroads.
- Select any of the presented sample symbols you prefer. Close the Symbology pane when you are done by clicking on the small X in the upper-right corner.
- In the Contents pane, right-click on the RR_Tracks layer and select Properties from the menu that appears.
- On the General tab in the Layer Properties window, change the name of the layer to Railroad and click OK.
- Click on the Project tab and select Save As.
- Navigate to C:StudentIntroArcProMy Projects and name your project <your name> Ex2B.
Now you will change the symbology for the road centerlines to reflect their condition. This will be a bit more challenging than changing a single symbol.
- Using the skills you have already learned, rename the Street_Centerline layer to Streets.
- Ensure that the Streets layer is still selected in the Contents pane. Then, click on the Appearance tab in the ribbon.
- Next, click on the small arrow located below the Symbology tool. Choose Unique Values from the drop-down options, as illustrated in the following screenshot:
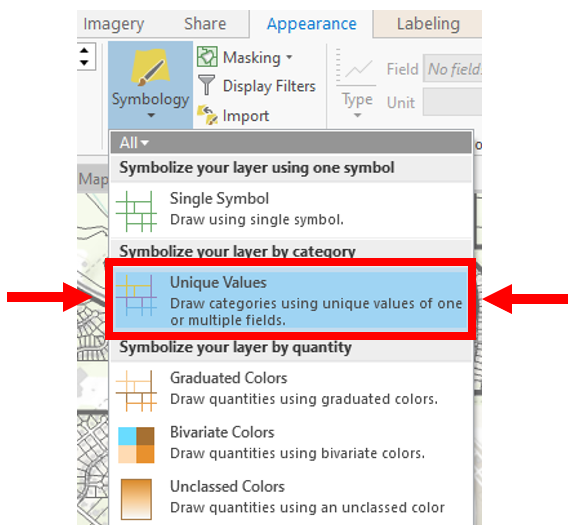
The Symbology pane will once again be opened on the right side of ArcGIS Pro. It will look different than what it did when you were working with Single Symbol. It contains many more options and settings. These allow you to configure your symbology based on the attributes found in one or more fields.
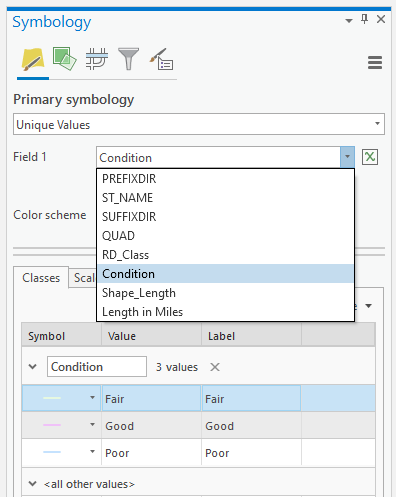
- In the drop-down box located next to Field 1, select Condition as shown in the following screenshot. Notice that ArcGIS Pro automatically adds all values found in this field and assigns them a symbol:
- Click on the symbol located next to Fair in the grid located in the middle of the Symbology pane to open the symbol gallery.
- Click on the Properties tab located at the top of the pane, as indicated in the following screenshot:

- From the Color drop-down selection, set the color to an orange tone or another you prefer and set the width to 1 pt. Then, click Apply.
- Click on the return arrow located at the top of the Symbology pane to return to the symbology settings for the entire Streets layer.
- Using the same method from before, make the following adjustments shown in the following list to the symbols for Good and Poor values:
- Good: A bright green color and width of 1.5 pt.
- Poor: A bright red color and width of 3 pt.
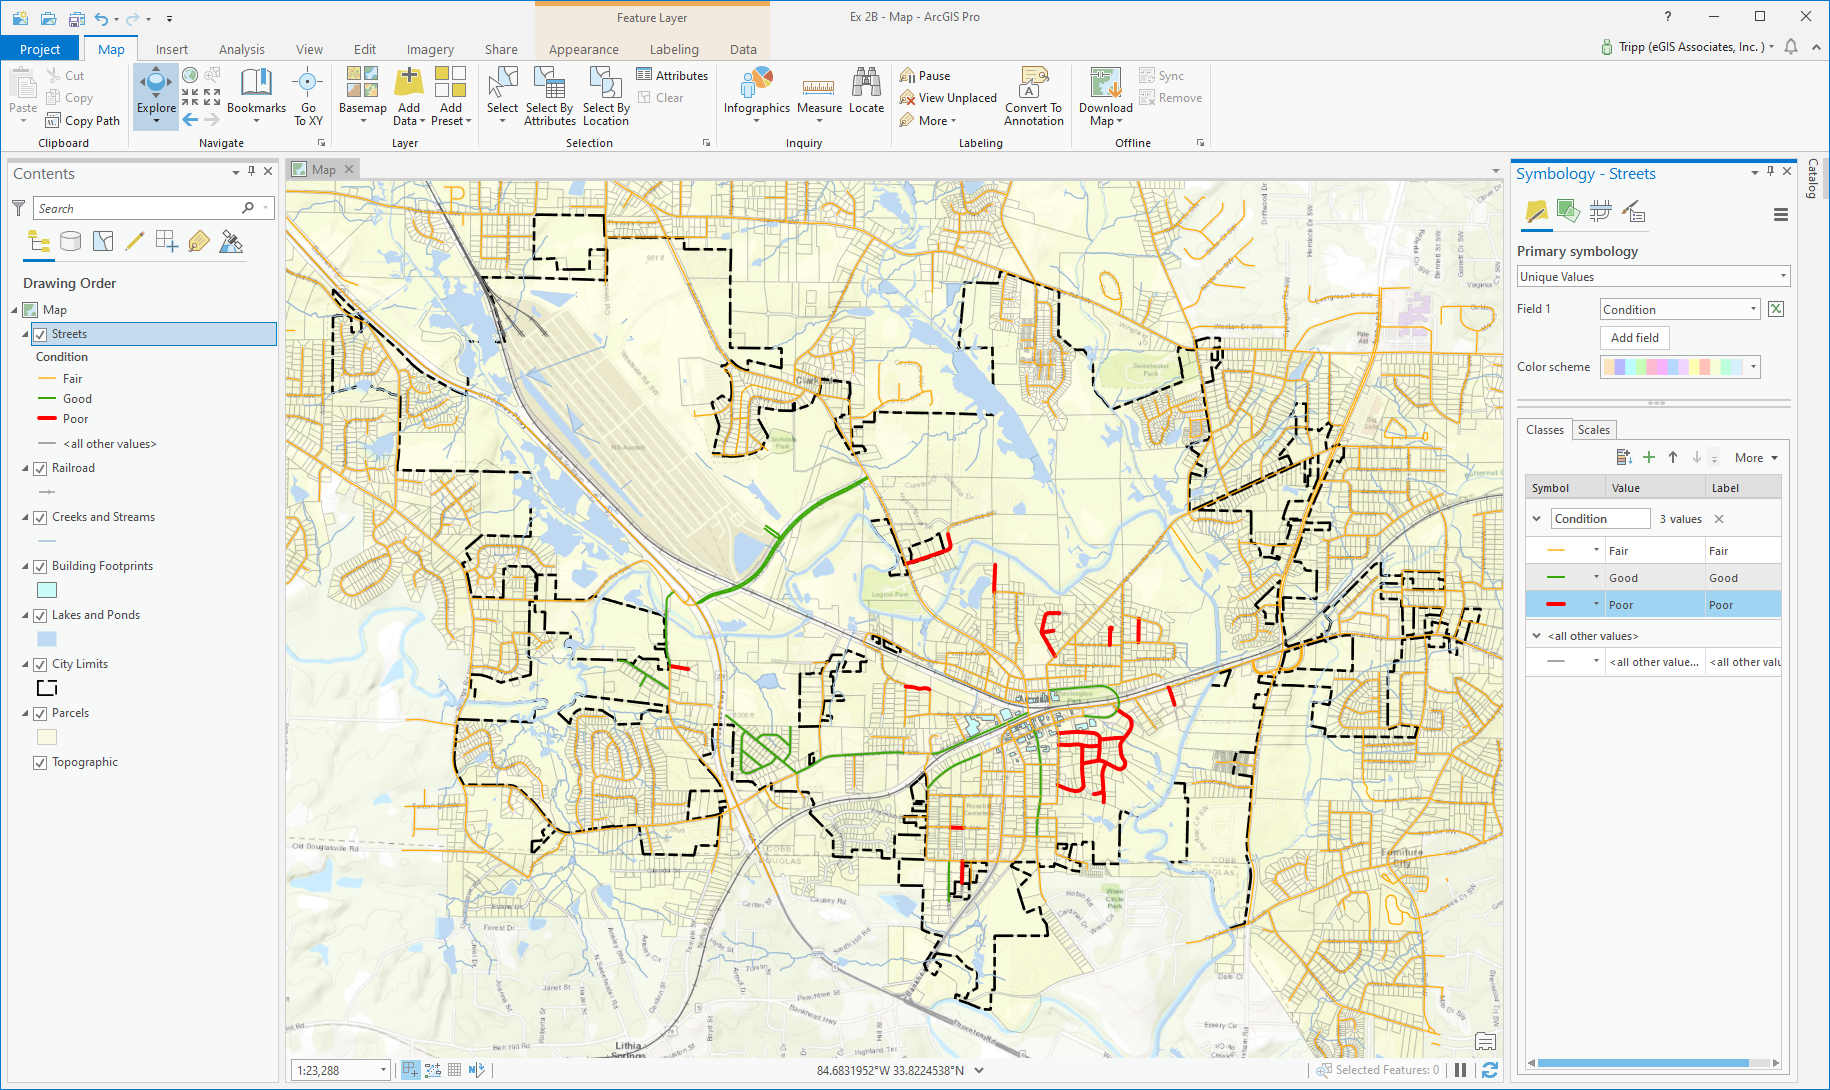
When you are done, your map should look similar to this:
- Close the Symbology pane when you are done changing the symbology. Feel free to make changes to other layers in the map.
- Save your project by clicking on the Save button located on the Quick Access Toolbar located at the very top left-hand side of the ArcGIS Pro interface.
You have just adjusted symbology using the Feature Layer contextual tab. Initially, you simply changed the symbol for all the features in a layer. Then you changed the symbology for the Streets layer so that you could see the condition of each street within that layer. That ability makes your maps more informative and useful. It also shows the power of GIS, where spatial data is linked to attribute information. Now, let's add some labels to the maps.
Step 3 – Labeling
In this step, you will use the Labeling tab in the Feature Layer contextual tab set to add street names to the map. You will configure the labeling for the Streets layer to accomplish this task:
- Select the Streets layer in the Contents pane.
- Click on the Labeling tab in the Feature Layer contextual tab set.
- Click on the Label button located on the far left of the ribbon in the Layer group, as shown in the following screenshot, to turn on labels for the Streets layer. You should see labels appear in the map once you click on the tool:

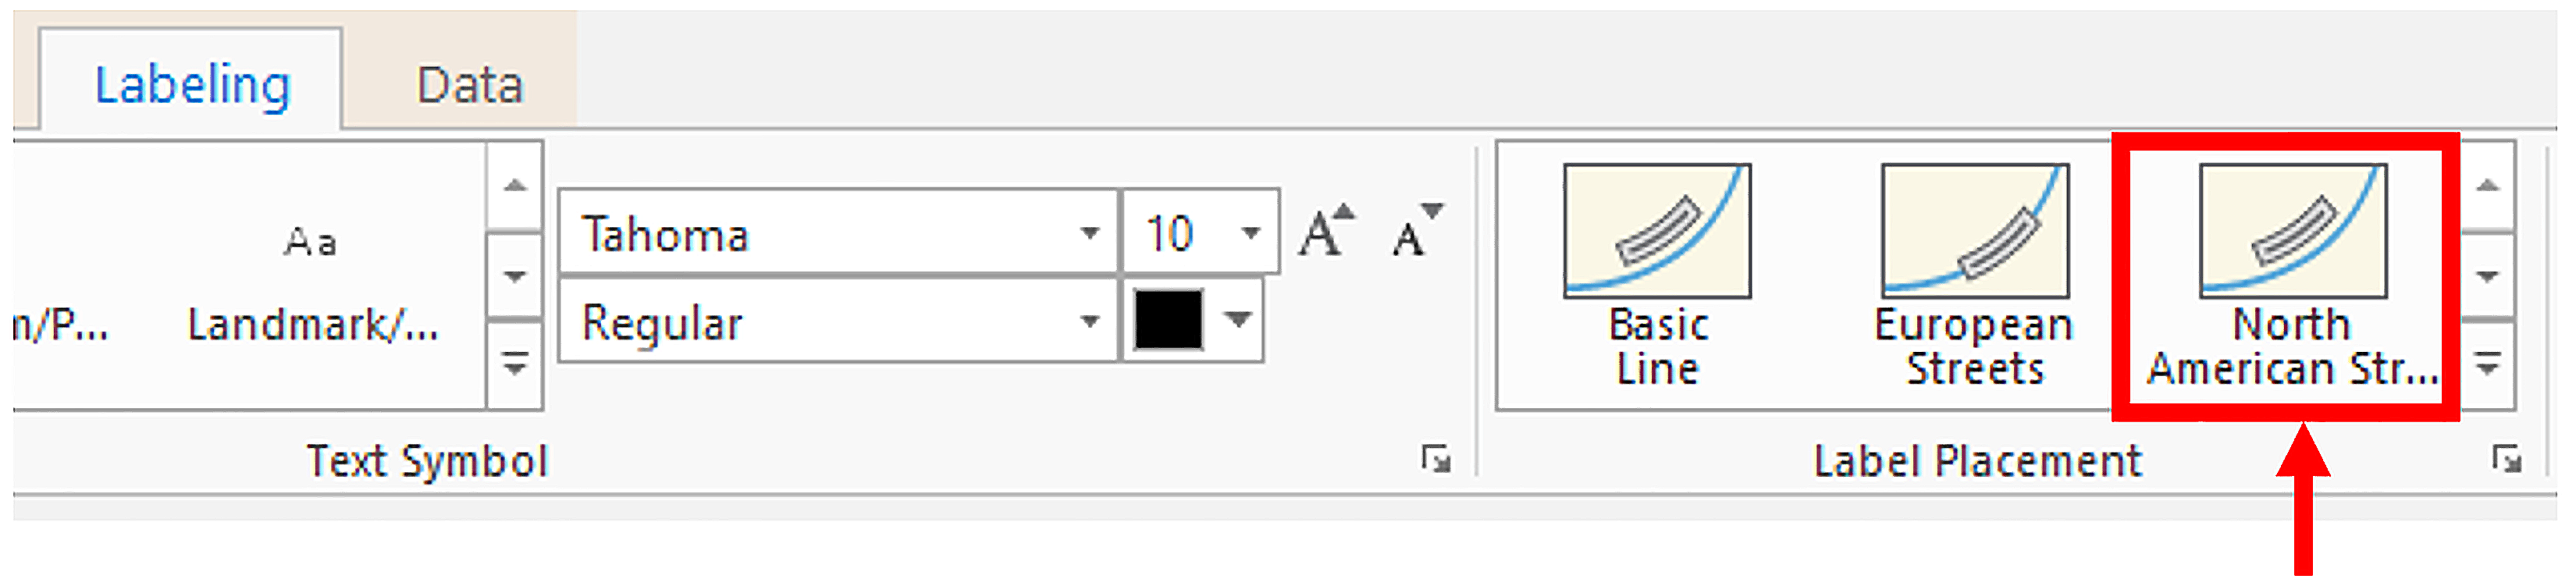
- Within the Label Placement group on the Labeling tab, select the North American Streets option, as illustrated in the following screenshot. ArcGIS Pro will then use the placement properties defined by this placement style, including the road name appearing above the centerline and being curved to follow the road:
When you enabled labeling for the Streets layer, the Label Class pane also opened in the right side of ArcGIS Pro in the same place as the symbology pane. This pane allows you to refine various label settings.
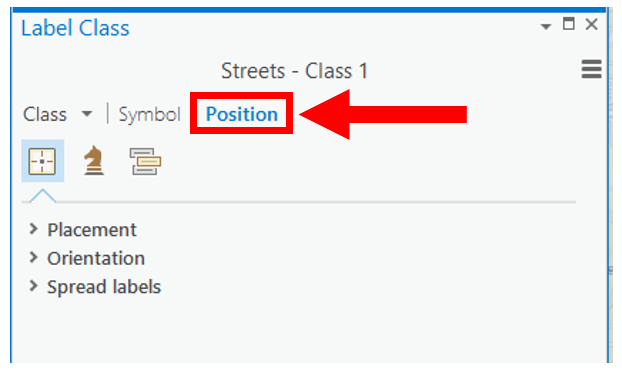
- Right-click on the Streets layer in the Contents pane. Select Labeling Properties from the menu that appears to open the Label Class pane.
- Click on the Position tab located at the top of the Label Class pane, as illustrated in the following screenshot:
- In the Label Class pane, click on the Fitting Strategy button. This is the one that looks like a knight piece in chess, as illustrated in the following screenshot:
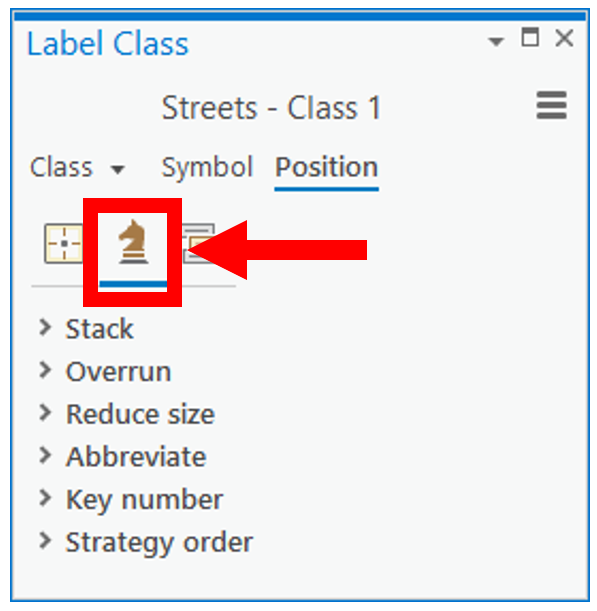
- Click on the small arrow next to Reduce size to expand the options for that strategy.
- Click on the checkbox next to the Reduce font size to enable this fitting strategy.
- Set the Lower Limit to 5.0 pts and the Step interval to 1.0 pt.
This will allow ArcGIS Pro to automatically adjust the font size in order to get a road name to fit on the map. This will allow more road names to be displayed.
- Zoom in and out to see how well your labels appear. Turn off the Reduce font size option and then zoom in and out again to see the impact that this option has.
- Save your project and close the Label Class pane.
You have now added text to your map showing the street names. An automatic label was added to this text. Labels are dynamic text that is tied back to an attribute of the feature. As you have now seen, you can configure some options, but ultimately, the software decides what features are labeled and where the label will appear.
So far, you have worked solely on a 2D map. Now it is time to dip your toe into 3D with the next step.
Step 4 – Working with a 3D layer
One of the things that sets ArcGIS Pro apart from other GIS software is the ability to work and visualize data in 3D without needing additional software or extensions such as 3D Analyst. The ability to view, edit, and query data in 3D is part of the core functionality found in ArcGIS Pro.
In this step, you will add a layer containing building footprints to a 3D scene and then extrude that layer so that you can see the heights of the building. Working with 3D data will tax your computer more than 2D data. So, do not be surprised if this step performs slower. If your computer barely meets the minimum requirements for running ArcGIS Pro, then you may encounter issues and crashes trying to complete this step:
- In the Catalog pane normally located on the right side of the interface, click on the little arrow next to Maps located at the top of the pane to expand its contents.
If you don't see the Catalog pane, you may have accidentally closed it when you closed the other panes. You can reopen it by clicking on the View Tab and then the Project button.
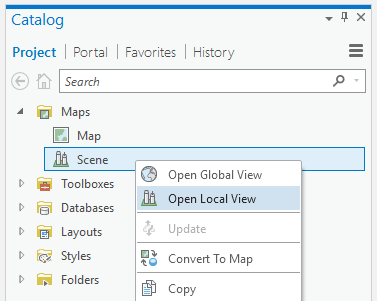
- Once you expand the Maps folder, you should see two maps, namely, Map and Scene. Right-click on Scene and select Open Local View, as shown in the following screenshot. This opens the 3D scene:
- Activate the Map tab in the ribbon and select the Explore tool.
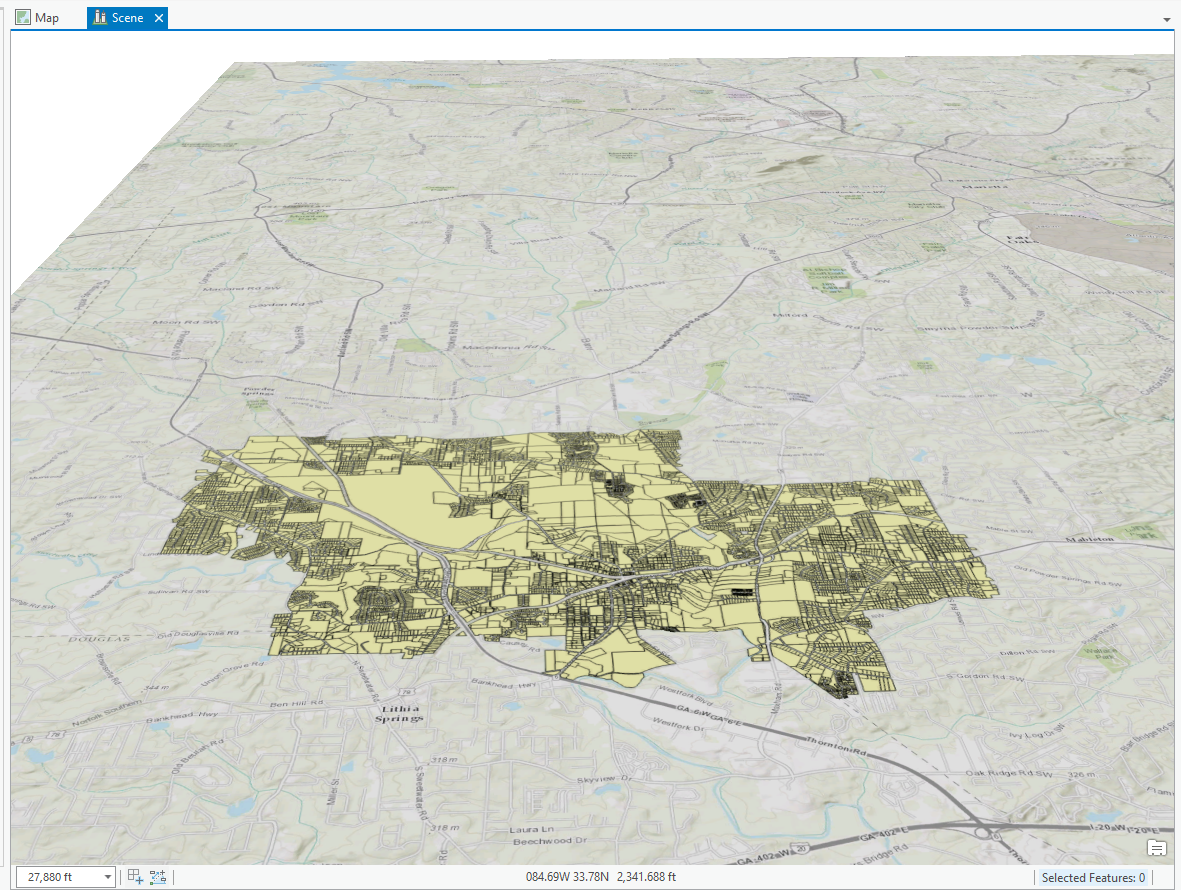
- Press the scroll wheel on your mouse down and push your mouse away from you slightly to rotate the map view on the 3D plane until it looks similar to the following screenshot. It does not need to be exact, just close to the example:
- Place your mouse pointer near the center of the parcels layer and roll your wheel away from you to zoom in. Continue to work with the scroll wheel until you get comfortable with how it allows you to navigate within a 3D scene.
- Click on the Add Data tool and navigate to IntroArcGISPro Exercise 2A.gdb located under Projects and the Databases folder. Click on the bldg_footprints feature class and click Select.
- Rename the bldg_footprints layer to Building Footprints using the same process you learned in previous steps.
- Select the Building Footprints layer in the Contents pane and drag it up to 3D Layers, as depicted in the following screenshot. This will allow you to apply 3D symbology to this layer:

If you are unable to move the Building Footprints layer to 3D Layers, you may need to ensure that you are looking at the List by Drawing Order option in the Contents pane. This is the first button located at the top of the pane.
- Save your project.
- If needed, activate the Map tab in the ribbon. Then, click on the Bookmarks tool and select Buildings bookmark. This will zoom the scene, meaning you can see the building as they overlay the ground elevation.
- Select the Buildings layer once again and click on the Appearance tab. Notice it looks quite a bit different from what you saw when working with a 2D map.
- In the Extrusion group, click on the small arrowhead below Type and select Base Height. This will allow you to extrude the building based on their estimated height, meaning you can see the differing heights of each building in a 3D view.
- In the Field drop-down option next to Type, select Estimated Height from the list that appears, as shown in the following screenshot. This is the estimated height of each building:

Your map should now look similar to the following screenshot. The colors of your buildings may be different, but that is to be expected. Remember that ArcGIS Pro assigns colors randomly to layers as they are added to a map or scene:

You have just added and symbolized a 3D layer in ArcGIS Pro. You can now see the 3D relationships between the different buildings within the city. The ability to visualize data in 3D opens up a whole new way to look at data. It can allow you to see relationships between features in one or more layers that you might not see in a 2D view. Any layer can be visualized in 3D. This capability is not limited to just layers dealing with infrastructure. You will learn more about creating 3D scenes in Chapter 4, Creating 3D Scenes.
Challenge
Using the knowledge you have gained in this exercise, try to change the symbols for the buildings in the scene to one of the gray building footprint symbols found in the symbol gallery you saw in the previous step. Changing symbology for a 3D layer is very similar to the method you used to change the symbology for the railroad and building footprints layers in the 2D map.
Summary
In this chapter, you have learned how to use the ArcGIS Pro ribbon interface and the terminology associated with it. As you have seen, the ribbon provides easy and quick access to tools. The contextual tabs make specific tools associated with tasks and items available to you with minimal clicking or searching.
Many of the tools in the ribbon work in conjunction with panes that appear to the right side of the interface. These panes provide access to the settings and inputs used by the selected tool to refine its function.
Putting these tools to use, you were able to work with both 2D and 3D data, as well as labeling features and changing their symbology. You also learned how the Explore tool has a wide variety of functions, from navigating in the map to retrieving data.
In the next chapter, you will explore how to create a new 2D map in a project. This will include various methods for adding a new map, importing a map from external sources, and making copies of existing maps. You will also look at different ways in which you can add new layers to a map.