The OpenSSO server is simple to configure and use as long as everything is going well, but when it fails at some point during configuration or later, things are going to get messy due to the nature of its multiple intra components interaction. So debugging and troubleshooting does require a methodical approach to identify the problem area. In this chapter, let us look at some of the common problem areas and some tips on how to troubleshoot them with minimal resources. I will also highlight the salient features of the OpenSSO diagnostic tool, which is a graphical user interface to diagnose the configuration and deployment of the OpenSSO servers. The scope of the chapter is not to go over every aspect of the problem, but to give you an idea of where the problem would be. In essence, we will cover the following:
- OpenSSO diagnostic tools
- Specific erroneous scenarios along with possible causes
- Tips to debug and troubleshoot issues
The diagnostic tool is bundled along with the opensso.zip archive. After uncompressing the archive you will be able to find the diagnostic tool ZIP archive under opensso/tools/ssoDiagnosticTools.zip. To obtain the script ssodtool.sh you should unzip the ssoDiagnosticTools.zip. This will lay out the required jars and binaries in order to invoke the diagnostic tool user interface. This tool facilitates in uncovering any potential deployment and configuration problems as opposed to identifying the runtime failures such as the encryption failure.
There are no special set up or configuration procedures required to use this tool. It is ready for use as soon as you unzip the ssoDiagnosticTools.zip from the opensso.zip archive file. This tool implementation follows a plugin architecture model. Consequently, one should be able to build custom diagnostic tool plugins for new services that can be seamlessly integrated with the existing services (http://wikis.sun.com/display/OpenSSO/The+OpenSSO+Diagnostic+Tool).
This tool supports both graphical user interface and a console interface where customers can invoke on a headless machine. On Unix systems the shell script could be invoked as follows:
[ssouser@opensso]:~/opensso/tools/diag>./ssodtool.sh
Invoking GUI
Please wait while system initializes...
GUI initializing Begin !!!
GUI initializing End !!!
Press <Enter> to stop the Diagnostic Tool
Alternatively the console version of the tool can be brought up by using the --console option along with the script name:
[ssouser@opensso]:~/opensso/tools/diag> ./ssodtool.sh --console
Invoking CLI
Diagnostic Tool>help
Usage: ssodtool agents|reports|web-container|tamper-detection|sample|connectivity|system|server [OPTIONS]
OPTIONS:
-h, --help
The help command displays a list of options
available. To display the options of each
command, use the following syntax:
ssodtool command_name --help | -h
The console version would be very useful when you cannot find a suitable display for the host from where you are invoking the tool, besides this option could be used to automate certain diagnostic and metrics collection processes. Nevertheless, the graphical user interface is very intuitive for the end user. On the Windows operating system the whole thing can be achieved by invoking the batch script ssodtool.bat. The rest of the options hold good for the batch script as well.
Currently this tool can verify and validate most of the core configuration problems in the OpenSSO server deployed on the following containers:
The rest of the containers, such as Apache Tomcat, are not supported for this tool even though the server deployment is supported on this container.
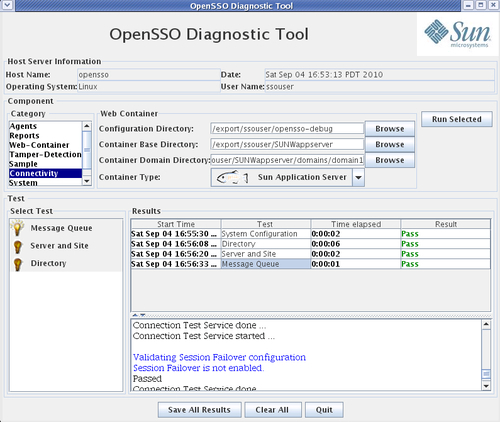
When you invoke the tools in the graphical mode, you will notice a screen that is asking for some of the pertinent details of the OpenSSO server and the web container configuration directory.
As you can see from the screenshot, multiple levels of verification is done using this tool including verifying the server connection. The following is the sample view of how the verification screen appears. You can select more than one test in sequence to verify the sanity of the system.