The title of this chapter seems a bit frightening, but don't worry, Oracle WebLogic Server usually deals with common problems in a good way. The platform is robust and solid.
But sometimes there are some unforeseen issues. Although you configured all bits and pieces very well, external causes can make your system unstable.
Or perhaps you could make a tiny mistake or misjudgment, which can lead to some problems in your WebLogic Server.
This is where your analytical and troubleshooting skills come in, along with your great deal of experience.
This chapter will give you a start in the areas you could begin to troubleshoot. Although there are many possible scenarios, in real life often the same issues will appear and can be easily tackled.
In case of a failure or other problems in your WebLogic Server, it is good to follow a structured way to detect and diagnose any problem.
Following diagnostic patterns can help you to solve your problems in a quick and effective way.
An application creates a core dump file when a WebLogic Server process terminates due to some invalid native code (machine-specific code). A server crash, JVM crash, machine crash, or HotSpot error may also be associated with this occurrence. This pattern will describe what steps are needed to gather information from a core file on various platforms.
In order to determine the cause of a WebLogic Server crash, you need to determine all potential sources of native code used by the WebLogic Server process. The places to focus on are:
- The WebLogic Server performance pack. Major performance improvements are witnessed when you use native performance packs on machines that host WebLogic Server instances. The WebLogic Server performance pack is a native code and when enabled could potentially produce such an error. Disable this feature to determine if that is the cause. You can do this via the console or via the command line. Using the console, look under the Server tab by setting NativeIOEnabled to
false. See the section Enabling Performance Packs to get the exact sequence of steps under the Server tab in the console. The steps are:- Access the Administration Console for the domain.
- Expand the Servers node in the left pane to display the servers configured in your domain.
- Click the name of the server instance that you want to configure.
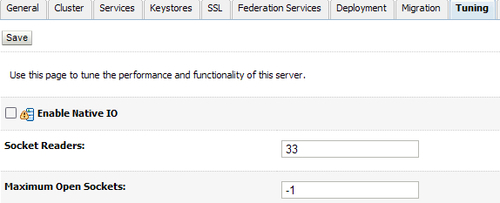
- Select the Configuration | Tuning tab.
- If the Enable Native IO checkbox is selected, please deselect it so that it is not enabled now.
- Click Apply.
- Restart the server.
You can also do this via the Java options to the start command for WebLogic Server. Set
-Dweblogic.NativeIOEnabled=falseon the command line and then start the server. The command line will take precedence over what is sent via the console. When we will be certain that the Native I/O is causing it, only then it is recommended to disable it.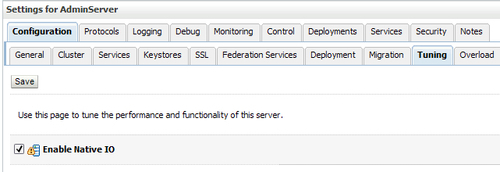
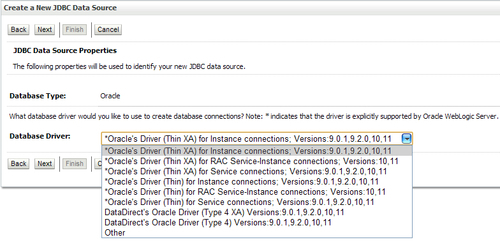
- Any earlier Type JDBC driver, such as ODBC, makes use of native DBMS libraries, which could also produce errors. It depends on native libraries of the underlying operating system the JVM is running on. Also, use of this driver leads to other installation dependencies; for example, ODBC must be installed on the computer having the driver and the database must support an ODBC driver. Use a pure Java Oracle or other JDBC driver in order to determine if that is the cause. This you can set under the JDBC service, which could be the cause of the problem.
- The JVM itself is a native program and can cause such errors. When in doubt, try another certified JVM and/or a later release to determine if a JVM bug is at fault. Many JVM bugs involve the use of the JIT compiler and disabling this feature will often resolve this type of problem. Usually this can be done by supplying the
-Djava.compiler=nonecommand option. - Sometimes the JVM will produce a small log file that may contain useful information. The file is produced in the directory where WebLogic Server was started and it is of the format
hs_err_pid.log, where PID is the Process ID of the WebLogic Server process.
The following block of code is a sample of an hs_err_pid.log:
hs_err_pidXXXX.log ---------------------------------------------------- # # A fatal error has been detected by the Java Runtime Environment: # # SIGSEGV (0xb) at pc=0xb7116982, pid=15011, tid=1672133520 # # JRE version: 6.0_18-b07 # Java VM: Java HotSpot(TM) Server VM (16.0-b13 mixed mode linux-x86 ) # Problematic frame: # V [libjvm.so+0x495982] # # If you would like to submit a bug report, please visit: # http://java.sun.com/webapps/bugreport/crash.jsp # --------------- T H R E A D --------------- Current thread (0x08ddb400): JavaThread "SocketAcceptorIoProcessor-1.2" [_thread_in_vm, id=15329, stack(0x63a5b000,0x63aac000)] siginfo:si_signo=SIGSEGV: si_errno=0, si_code=1 (SEGV_MAPERR), si_addr=0xff654e8d Registers: EAX=0xb73ca50c, EBX=0xb73d8de0, ECX=0x68d1b310, EDX=0x63aaaad0 ESP=0x63aaaa50, EBP=0x63aaaa58, ESI=0xff654e89, EDI=0x9aea1dc1 EIP=0xb7116982, CR2=0xff654e8d, EFLAGS=0x00010286 Top of Stack: (sp=0x63aaaa50) 0x63aaaa50: b73d8de0 08ddb400 63aaab08 b7297262 0x63aaaa60: ff654e89 08ddb400 00000000 00000000 0x63aaaa70: 9ab13138 0805c8d0 63aaaac8 e0000000 0x63aaaa80: 0805c8d0 9ab13138 63aaaa98 9aea1dd1 0x63aaaa90: 00000008 9ab13138 63aaaac8 00000001 0x63aaaaa0: 9aea1dc3 08b210ac 63aaaad0 9aea1e05 0x63aaaab0: 9addf030 00000001 08b210ac 08b210ac 0x63aaaac0: b73d0608 08ddb400 63aaac48 b723d17e
Instructions: (pc=0xb7116982) 0xb7116972: 75 08 8b 83 f8 21 00 00 3b 30 0f 84 a4 00 00 00 0xb7116982: 8b 46 04 83 ec 0c 8d 48 08 8b 40 08 51 ff 90 8c Stack: [0x63a5b000,0x63aac000], sp=0x63aaaa50, free space=13e63aaa3e0k Native frames: (J=compiled Java code, j=interpreted, Vv=VM code, C=native code) V [libjvm.so+0x495982] V [libjvm.so+0x616262] V [libjvm.so+0x61408a] V [libjvm.so+0x613f67] V [libjvm.so+0x5c92ce]
GDB is the default preferred Linux debugger and it is powerful and stable. There are also various visual debuggers available, but only a simple command-line debugger is really needed to get the stack trace from the core. GDB lets you see the internal structure of a program, print out variable values, set breakpoints, and runs in a single step through source code. It makes an extremely powerful tool for fixing problems in the program code.
Run<file_name> /core to verify if the core file is from the Java VM.
Make sure you are using the latest GDB version from GNU on Linux to avoid any known bugs. See: http://ftp.gnu.org/gnu/gdb/.
Also make sure that the ulimit for a core file is set on Linux (for example, ulimit -c unlimited).
On Linux, the core dump is turned off by default on all systems. In most Linux versions, it should be under the /etc/security directory. There should be a file called limits.conf. The file itself is self-explanatory. Look for the word "core", if set to 0, then core dump is disabled.
Get a stack trace using GDB, as follows (same as done previously, see JVM Crash section from Chapter 9,The Heart of Oracle WebLogic Server: The JVM):
$ java -version (need to use right version of jdk)
$ ls /usr/local/bin/gdb (need to know gdb location) or "which gdb"
$ export DEBUG_PROG=/usr/local/bin/gdb (or wherever "gdb" is located)
$ gdb /java corefile
Now you will be in the debugger. Execute the following commands:
(gdb) where ("shows a summary of the stack") (gdb) thr ("switch among threads or show the current thread") (gdb) info thr ("inquire about existing threads") (gdb) thread apply 1 bt ("apply a command to a list of threads, specifically the backtrace to thread #1") (gdb) quit
Using these commands will produce a stack trace of the last thread that was executed (wherethr command), show the state of all the threads (info thrthread apply 1 bt command).
Using the last command (thread apply # bt) is a way to get the stack trace of an individual thread by replacing # with an actual thread number or you can replace # with all to get the stack trace for all the threads.
If your OS has none of these tools, you can use pmap and pstack to analyze a core dump. For example: /usr/proc/bin/pstack coredumpfile.
You also can use strings command and filter on errors in the dump file.
You could investigate the JVM Core Dump with the Linux pstack command. The output would be something similar to the following:
fe16d550 __1cMURShiftINodeFValue6kMpnOPhaseTransform__pknEType__ (9983c8, 88d00d4c, 1, 0, fe570000, 3b7480) + f8 fe0d2180 __1cMPhaseIterGVNNtransform_old6MpnENode__2_ (88d00d4c, 3b795c, 9c, 88d00e9c, 11, e4c4d8) + 1d4 fe19b1e8 __1cMPhaseIterGVNIoptimize6M_v_ (88d00d4c, 0, fe5b89f8, 0, 0, 0) + a0 fe202008 __1cHCompileIOptimize6M_v_ (88d01298, fe5335c4, 88d011ac, fe570000, 0, 0) + 168 fe2008b4 __1cHCompile2t6MpnFciEnv_pnHciScope_pnIciMethod_iii_v_ (fe5333f9, 371584, 2f1d24, d30664, ffffffff, 1) + bac fe1fd08c __1cKC2CompilerOcompile_method6MpnFciEnv_pnHciScope_pnIciMethod_ii_v_ (2bb80, 88d01ab4, 0, 372918, ffffffff, 0) + 64 fe1fc850 __1cNCompileBrokerZinvoke_compiler_on_method6FpnLCompileTask__v_ (720, 0, ffffffff, fe5aee50, fe5bbbe4, eaff8) + 61c fe2ac1f8 __1cNCompileBrokerUcompiler_thread_loop6F_v_ (fe533c01, fe5af218, eaff8, eb5a8, 306d10, fe269254) + 428 fe26927c __1cKJavaThreadDrun6M_v_ (eaff8, b, 40, 0, a, ff37c000) + 284 fe26575c _start (eaff8, ff37d658, 1, 1, ff37c000, 0) + 134 ff36b01c _thread_start (eaff8, 0, 0, 0, 0, 0) + 40
In order to determine which method caused this, add the following flags to the Java server line and run your test again to make the server core dump to obtain information:
-XX:+PrintCompilation -XX:+PrintOpto
This can be set in your startWebLogic script or your setDomainEnv script.
With the output from PrintCompilation, you could filter which method is failing and ask the developer to filter this out of the code.
Some output after enabling this option:
BenchmarkLoopTest emptyLoop 1000000 3 3
1 java.lang.String::hashCode (60 bytes)
2 java.lang.String::charAt (33 bytes)
3 java.lang.String::indexOf (166 bytes)
Are you ready?
y
Waking up the JIT compiler...
4 java.lang.String::indexOf (151 bytes)
Run: 1, Time: 6146, Test returns: 3
Run: 2, Time: 3353, Test returns: 3
Run: 3, Time: 3353, Test returns: 3
...
Run: 15, Time: 3632, Test returns: 3
5 sun.reflect.ClassFileAssembler::emitByte (11 bytes)
6 sun.reflect.ByteVectorImpl::add (38 bytes)
Run: 16, Time: 3632, Test returns: 3
...
Run: 37, Time: 3353, Test returns: 3
7 ! sun.nio.cs.SingleByteEncoder::encodeArrayLoop (475 bytes)
Run: 38, Time: 3352, Test returns: 3
...
Run: 96, Time: 3352, Test returns: 3
8 sun.nio.cs.Surrogate::is (18 bytes)
Run: 97, Time: 3353, Test returns: 3
Run: 98, Time: 4749, Test returns: 3
9 java.lang.Object::<iRun: nit> (1 bytes)
99, Time: 3352, Test returns: 3
--- n java.lang.System::arraycopy (static)
Run: 100, Time: 3352, Test returns: 3
...
Run: 221, Time: 3073, Test returns: 3
10 java.lang.String::getChars (66 bytes)
Run: 222, Time: 3073, Test returns: 3
...
... Some other methods compiled
The next pattern in which you could search for crashes is the Generic Server Hang Pattern.
WebLogic Server can hang because of various reasons, but the most important ones are:
- Extensively high load
- Threads that are hanging
- Other resources such as JDBC, JMS cause the server to hang
- Badly programmed applications
A server hang is suspected when the server does not respond to new requests, requests time out, or requests take longer to process.
In fact, every component can cause the WebLogic Server to hang if it's consuming extensively more resources than it was planned to be.
Hanging can have internal causes such as spinning processes- these are eating 100 percent CPU and you can't kill it even with kill-9- or external failures of network, load balancers, databases, or other systems to connect to.
The following table shows some well-known causes of a generic server hang. Let's have a look at some of them:
|
Pattern Name |
Topic |
|---|---|
|
EJB_RMI Server Hang |
RMI, RJVM responses all threads tied up waiting for RJVM, RMI responses. |
|
Application Deadlock Causes Server Hang |
Application Deadlock thread locks resource1 then waits for lock for resource2. Another thread locks resource2 and then waits for lock for resource1. |
|
Thread Usage Server Hang |
Threads are all used up, none available for new work. |
|
Garbage Collection Server Hang |
Garbage Collection taking too much time. |
|
JSP cause Server Hang |
JSP improper settings for servlet times, for example, PageCheckSeconds. |
|
JDBC Causes Server Hang |
Long Running JDBC calls or JDBC deadlocks lead to a hang. |
|
Server Hang in Code Optimization |
JVM hang during (code optimization), looks like server hang. |
|
JSP Compilation Server Hang |
JSP compilation causes server hang under heavy load. |
What causes in general an EJB/Application to hang?
This problem occurs because of a poor design due to lack of knowledge about how clustered objects are stored and retrieved from the WebLogic JNDI tree when clustered. This results in waiting calls.
The threads associated with an EJB_RMI Server Hang have a typical pattern, as shown next. If many "default" queue threads in the thread dump have the same stack trace, chances are that the hang problem is related to using remote JNDI lookups.
Unnecessary network traffic is causing threads to wait for responses to outstanding rmi/rjvm requests in clustered EJB applications. These requests are a result of remote JNDI lookups in a clustered domain.
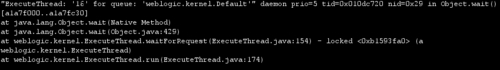
The following is an example of an application with problems:
"ExecuteThread: '52' for queue: 'default'" daemon prio=5 tid=0x4b3e40b0 nid=0x1170 waiting on monitor [0x4c74f000..0x4c74fdbc] at java.lang.Object.wait(Native Method) at WebLogic.rjvm.ResponseImpl.waitForData(ResponseImpl.java:72) at WebLogic.rjvm.ResponseImpl.getTxContext(ResponseImpl.java:97) at WebLogic.rmi.internal.BasicOutboundRequest.sendReceive(BasicOutboundRequest.java:80) at WebLogic.rmi.cluster.ReplicaAwareRemoteRef.invoke(ReplicaAwareRemoteRef.java:262) at WebLogic.rmi.cluster.ReplicaAwareRemoteRef.invoke(ReplicaAwareRemoteRef.java:229) at WebLogic.rmi.internal.ProxyStub.invoke(ProxyStub.java:35) at $Proxy6.lookup(Unknown Source) at WebLogic.jndi.internal.WLContextImpl.lookup(WLContextImpl.java:341)
In the stack trace of this thread, you see some issues already. The thread is in a wait method and is therefore waiting for something to occur, that is, work or data to arrive.
It called this wait() because it is waiting for data from a remote JVM in the method WebLogic.rjvm.ResponseImpl.waitForData().
If many threads in the stack are waiting for data from other cluster members, the other cluster members are probably waiting for data from this JVM. In this case, it's an EJB application which has problems with clustering features of WebLogic. Investigate if CLASSPATHs on different hosts are equal; ask your developer if EJBs are clusterable, or else deploy them as pinned services. It also could be a Classloader issue. Use a tool such as wls-cat to investigate class loading.
An inadvertent deadlock in the application code can cause a server to hang. For example, a situation in which thread1 is waiting for resource1 and is holding a lock on resource2, while thread2 needs resource2 and is holding the lock on resource1. Neither thread can progress.
Deadly embrace: One of the deadlock problems is the deadly embrace: Thread1 owns lock A and waits on lock B, thread2 owns lock B and waits on lock A. These threads are deadlocked and will remain blocked in this state. In many cases, the remaining threads will eventually enter the deadlock by attempting to acquire lock A or lock B and waiting. For instance, you might have a servlet that calls a synchronized method on the B object. If B's monitor is already held in a deadlock, any subsequent servlet request that attempts to acquire that monitor will enter the deadlock.
Taking a thread dump is the best practice to discover a deadly embrace deadlock. Most virtual machines include a thread state for each Java thread in the dump.
The most common thread states are:
The following screenshot shows an application in the CW state:
Threads in the MW state are blocked, waiting to enter a synchronized block and acquire a Java monitor. Since the thread dump includes the Java thread's stack trace, it's also possible to determine which monitor is blocking the thread. If multiple threads are in the MW state on the same monitor, it's a good indication that there's either a lot of contention for this monitor, or the server is deadlocked. In a deadlock situation, you should be able to determine the other threads blocked in MW and their held monitors.
There are two approaches for solving deadly embrace deadlocks: deadlock avoidance and deadlock detection. Deadlock avoidance is more of a developer's method by structuring the code, so that it can't hit the deadlock case. A common solution is to implement lock ordering.
In deadlock detection, deadlocks are automatically discovered and one or more deadlocks are killed and release their locks to break the deadlock. Java virtual machines do not break deadlocks on Java monitors, so deadlock avoidance is necessary. Using tools like JConsole or JRockit Runtime Analyzer can detect and monitor deadlocks.
Out-of-threads deadlock: Another type of deadlock is the "out of threads" deadlock. This deadlock often doesn't show up until a load test or, in the worst case, when your production application receives a lot of traffic. In this scenario, your WebLogic Server is running with a fixed number of threads. The application includes logic where a given request or action performs work in one thread and then blocks on work that must be done in another thread.
The best way to avoid "out of threads" deadlocks is to analyze your architecture and remove the common mistakes that produce these deadlocks. For example, never open a socket connection to your own server instance. For best socket performance, you use the native socket reader implementation rather than the Java implementation, on machines that host WebLogic Server instances. However, if you must use the pure-Java socket reader implementation for host machines, you can still improve the performance of socket communication by configuring the proper number of execute threads to act as socket reader threads for each server instance and client machine.
When you don't use Native IO, fill in the percentage of Socket Readers in the tuning tab of the server instance.
Also, avoid synchronous request/response APIs that include callbacks. Generally, asynchronous communication works well for server-to-server or application-to-application calls. Both messaging (JMS) and Web services include asynchronous support. One of the advantages of asynchronous communication is that the calling thread is not blocked waiting for the response.
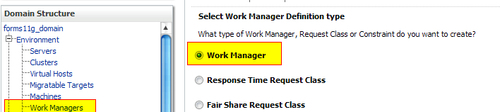
Also a good practice is using work managers. Incoming requests are assigned an internal priority based on the configuration of work managers you create to manage the work performed by your applications. With work managers, WebLogic Server can prioritize work and allocate the threads based on an execution model. This is taken care of by the administrator-defined parameters after observing the actual runtime performance, throughput, monitoring, and so on. Defining of this behavior or rules is done at different levels for different applications or group of applications. You can have a default work manager, which is used to handle thread management and perform self-tuning. This work manager is used by an application if no other work managers are specified in the application's deployment descriptors.
In many situations, the default Work Manager may be sufficient for most application requirements. WebLogic Server's thread-handling algorithms assign each application its own fair share by default.
Global Work Managers have the scope of the domain. You can create them in the WebLogic Administration Console:
There can be different possible reasons for JDBC calls to lead to a hanging WLS instance, such as use of DriverManager.getConnection() in JDBC code, long running SQL queries, hanging database, slow network, application-level deadlock, problems with RefreshMinutes or TestFrequencySeconds settings, and pool shrinking. JDBC connection pool shrinking and re-creation of database connections causes long response times.
This pattern addresses troubleshooting for these common problems. See the JDBC resource at the Pool tab, Diagnostics. You could enable options to get deeper into analysis.
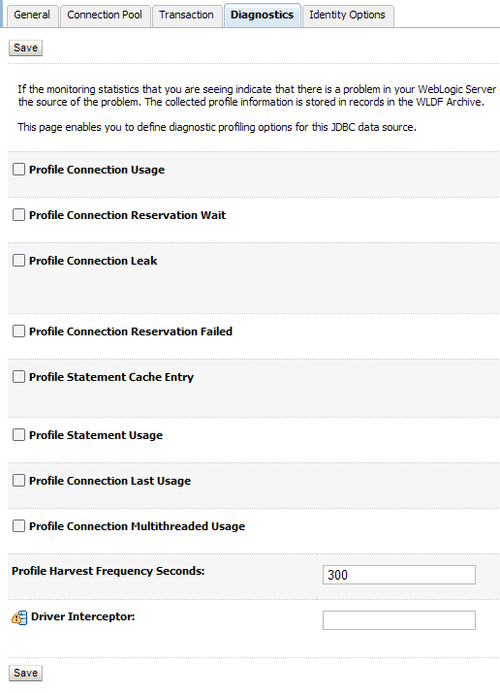
To get behind JDBC problems you can enable some debug options in WebLogic Server, such as:
- jDriver JDBC tracing can be switched on via the administration console, or in the
config.xmlfile directly by setting<JDBCLoggingEnabled>in the Server tag. - The
ServerDebugMBeanhas some JDBC-related flags that can be turned on in theconfig.xmlfile. Please put a new<ServerDebug>tag into the<Server>tag from the WebLogic Server instance you would like to debug.
Place these into your domain config repository (config.xml):
<Server Name="myserver" > .... <ServerDebug Name="myserver" JDBCConn="true" JDBCSQL="true" JTAJDBC="true" /> </Server>
Alternatively, these debug flags can also be set as system properties during WebLogic Server start:
-DWebLogic.Debug=WebLogic.JDBCConn,WebLogic.JDBCSQL,WebLogic.JTAJDBC
These debug flags and tracing can be very verbose, so please consider very carefully where you turn on these flags. They will create a lot of output and also possibly have a performance impact on your system.
When other components like JDBC or JMS can cause problems, the JVM can run out of memory. So if you're not sure, investigate the JVM. The causes mentioned next could be the root cause of the problem:
- Binary Core File Analysis Using the tools as described before.
- Irrecoverable StackOverFlow An application gets "an irrecoverable stack overflow has occurred. Unexpected Signal 11" message right before the JVM dies or core dumps.
- Unexpected High CPU Usage with WLS A system administrator or user notices that the WebLogic Server process is consuming a lot of CPU cycles and wants to know why/what is consuming CPU cycles.
- Too Many Open Files A system error "Too many open files" is reported in the WebLogic Server log. Users may see this as either
java.net.SocketException:Too many open files ORjava.io.IOException:Too many open files. Setting theulimitto a proper value (in the/etc/security/limits.conf)could prevent these errors. - Missing Execute Threads The missing threads issue is discovered during analysis of a server hang problem or unexplained timeouts or other confusing and unexplained behavior. Look for threads that have died in the dump you have created (kill -3
<process_number>). - Out of Memory/Memory Leak Problems An application displays "Out of Memory" errors due to memory exhaustion, either in Java heap or native memory.
To get more information about how the JVM is doing, you can add -verbosegc flag in the Java command line. The command differs from JDK vendor, as shown in the following table. After opening the gc log by adding -verbose:gc, it will print GC activity info to stdout/stderr. Or redirect to the gc.log file you have configured in the latter option. You can add them in your WebLogic startup script.
|
Oracle JRockit |
SUN JDK |
|---|---|
|
|
|
|
|
|
When you suspect a JMS component, such as a queue or a topic or connection factory, is causing the problems, here are some hints which could help to identify a possible cause.
You could enable debugging for JMS, by adding:
-DWebLogic.debug.DebugJMSBackEnd=true
And in the startup options:
-DWebLogic.log.StdoutSeverity="Debug"
Or use the WebLogic Server Administration Console to set the debugging values.
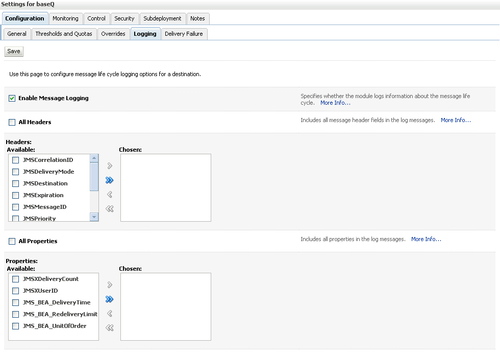
You can enable or disable JMS message logging for a queue, topic, JMS template, uniform distributed queue, and uniform distributed topic using the WebLogic Server Administration Console.
This can be done in the Administration Console; expand Services | Messaging | JMS Modules. In the JMS Modules table, click the JMS module that contains the configured resource. In the selected JMS module's Summary of Resources table, click the JMS resource that you want to edit.