
Load Test for an application helps the team to understand the applications performance under various conditions. Different parameter values and conditions are used to test the application performance under load.
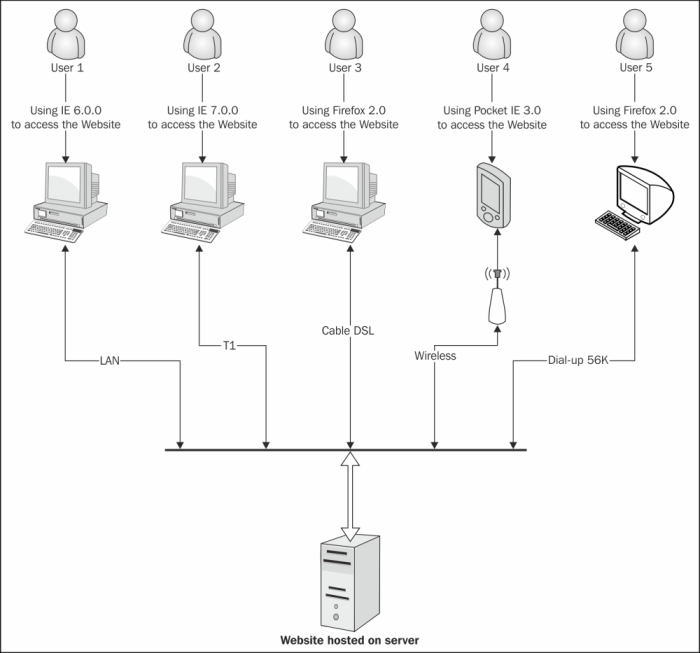
A Load Test can simulate any combination of user numbers, network bandwidths, web browsers, and configurations. In case of web applications it is always necessary to test the application with different sets of users and browsers to simulate the multiple requests that will be sent to the server simultaneously. The following figure shows a sample real-time scenario with multiple users accessing the website using different networks and different type of browsers from multiple locations.
Load Tests can also be used for testing the data access performance but not limiting to only web applications. The Load Test helps to identify application performance in various capacities, application performance under light loads for a short duration, performance with heavy loads, and with same load but different durations.
A Load Test uses a set of Controller and multiple agents. These are collectively termed as rig. The agents represent computers at different locations, used for simulating different user requests. The Controller is the central computer which controls multiple agents. The Visual Studio Load Agent in the agent computers generates the actual load for testing. Simulating multiple user logins and accessing the web pages as per the recording and collecting the data from the test is the job of agents. The Test Controller at the central computer controls these agents.
This chapter explains the creation of the Load Test scenarios and Load Testing the application with detailed information on each of these topics:
- Creating a Load Test and using the Load Testing wizard
- Patterns and scenarios for Load Testing
- Editing a Load Test and adding parameters
- Storing Load Test Results
- Running a Load Test
- Working with Test Results and analyzing them
- Exporting Test Results to Microsoft Excel
- Using Test Controller and Test Agents
- Test Controller and Test Agent Configuration
The Load Tests are created using the Load Test Wizard. Create the Test Project and then add a new Load Test which opens the wizard, and guides with the required configurations and settings to create the test. The test parameters and configuration can be edited later on.
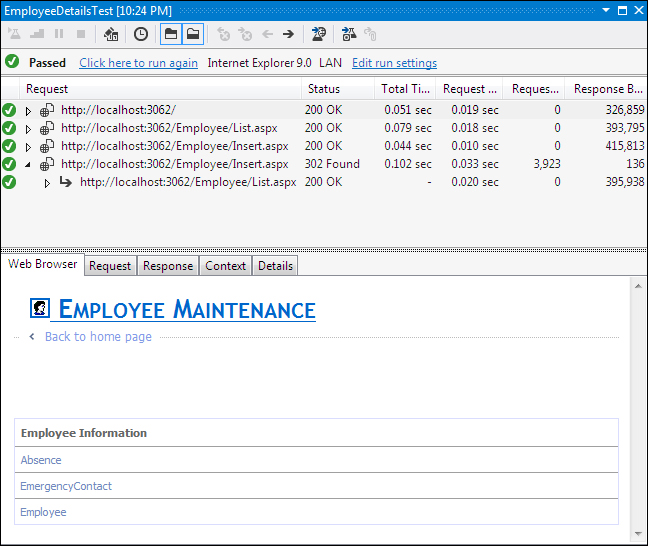
Online web applications or websites are accessed by a large number of users from different locations simultaneously. It is necessary to simulate this actual situation and check the application performance before deploying the application to a live server. Let's take a couple of web applications that we used in our previous chapters. One is a simple web page that displays employee details and employee-related details. The other application is the coded web test that retrieves employee details and also submits new employee details to the system.
Using the preceding examples, this chapter explains different features of load testing and the way to simulate the actual usage scenario with multiple users. The following sections describe the creation of load testing, setting parameters, and testing the application using Load Test.
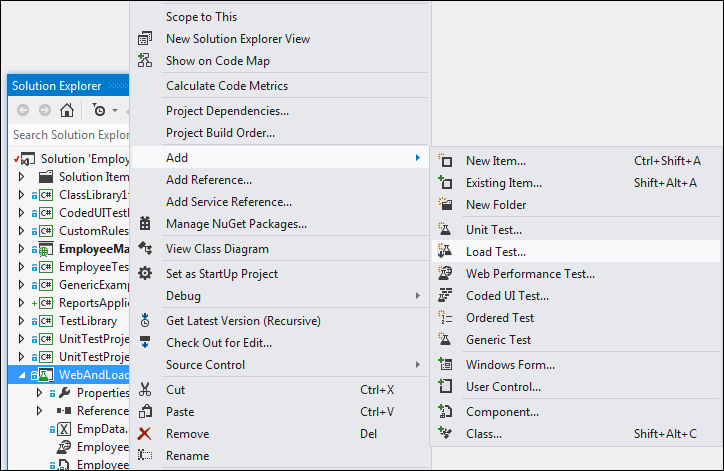
The Load Test Wizard windows helps to create a Load Test for your web and unit tests. There are different steps to provide the required parameters and configuration information for creating the Load Test. Select the Test Project and then navigate to Add | Load Test... to add a Load Test to the Test Project.
Adding the Load Test option opens the New Load Test Wizard window shown as follows. The wizard provides multiple sections for defining the parameters and configurations required for the Load Test.
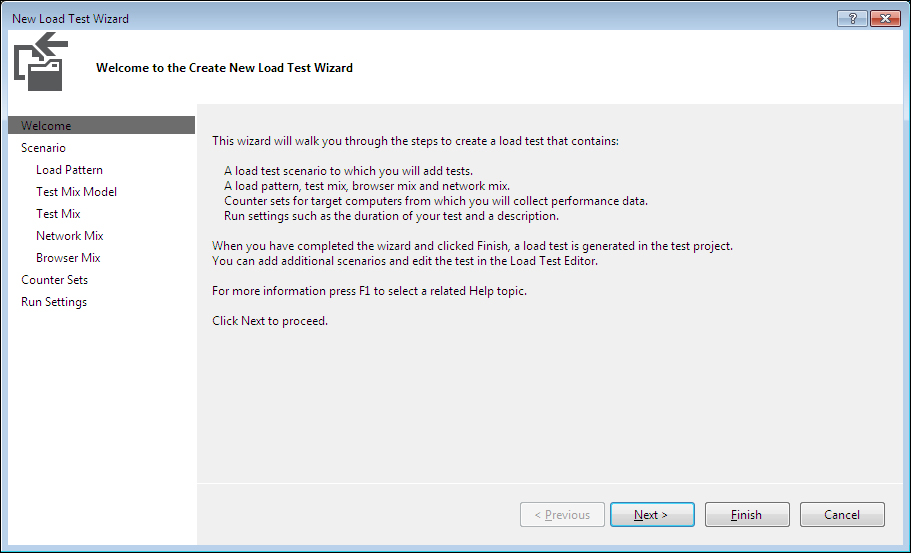
The wizard contains four different sections with multiple pages, which are used to collect the parameters and configuration information required for the Load Test.
The Welcome Page explains the different steps involved in creating a Load Test. On selecting a step such as Scenario, or Counter Sets, or Run Settings, the wizard collects the parameter information for the selected set option. Click on the required option directly or keep clicking on Next and set all the parameters. Once all the steps are over and all required details are provided for each step, click on Finish to create the Load Test using the details submitted. To open the Load Test, expand the solution explorer and double-click on the Load Test, LoadTest1 as it was named for this example. Following is a screenshot of the sample Load Test:
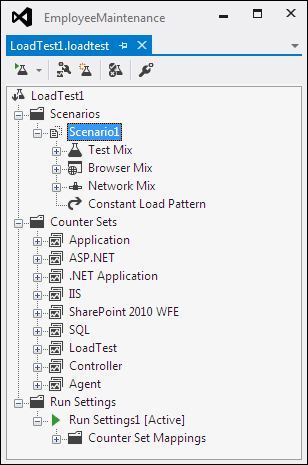
The following detailed sections explain how to set the parameters in each step.
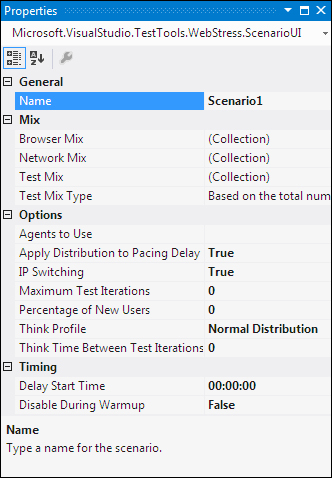
Scenarios are used for simulating the actual user tests. For example, for a public-facing website the end user could be anywhere and the number of users could be anything. The bandwidth of the connection and the type of browsers used by the users also vary. Some users might be using a high-speed connection and some a slow dial-up one. But if the application is an Intranet application, the end users are limited to being within the LAN network. The speed at which the users connect will also be constant most of the time. The number of users and the browser used are the two main things which differ in this case. The scenarios are created using combinations relevant to the application under test. Enter the name for the scenario in the wizard page.
Multiple scenarios can be added to the test with each scenario having a different Test Mix, Browser Mix, and Network Mix.
The next few sections explain the parameters and the configuration required for the test scenarios.
The think time is the time taken by the user to navigate between web pages. Providing these times are useful for the Load Test to simulate the test accurately.
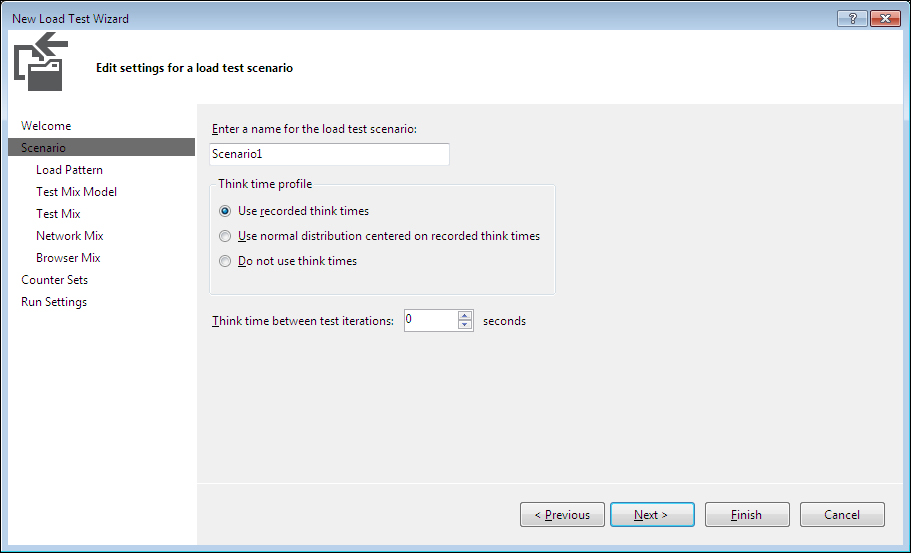
There are three different options to select the think times. Think times are very useful in case if the recording is done in a high-speed machine but actual test is run in the low configuration machine. The other reason is to provide enough time for any background processing to complete before starting with the next step. The options for think times are:
- Set the Load Test to use the actual think time recorded by the web test.
- The other option is to set the normal distribution of the think time between the requests. The time slightly varies between the requests, but will be realistic to some extent.
- The third option configures not to use the think times recorded between the requests.
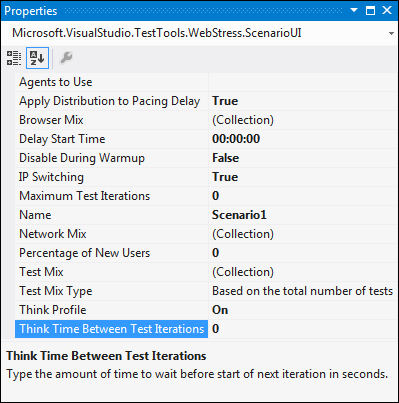
The think times can also be modified for existing scenarios. To do this, select a scenario and right-click on it and then select Properties to set the think time.
Now once the properties are set for the scenario, click on Next in the Load Test Wizard to set parameters for the Load Pattern.
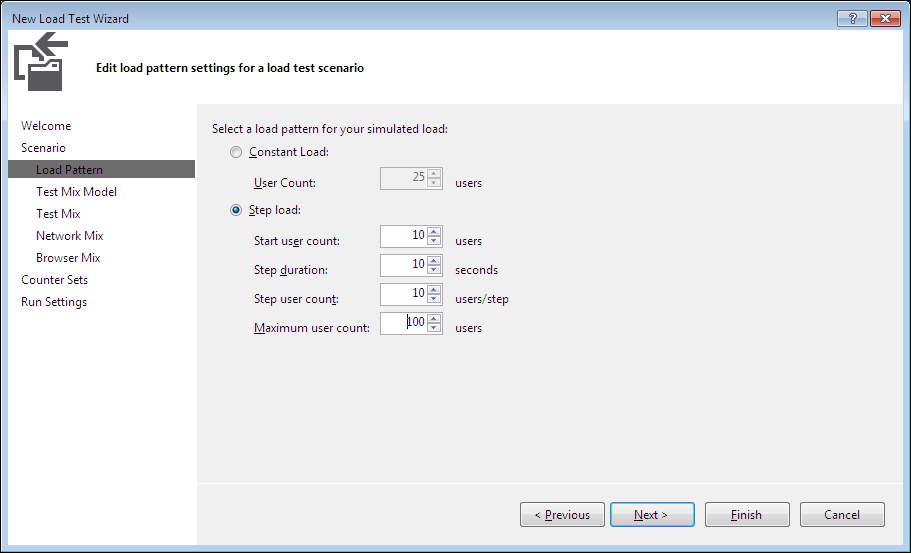
Load pattern is used for controlling the user loads during the tests. The test pattern varies based on the type of test. If it is a simple Intranet web application test or a unit test, then a minimum number of users for a constant period of time is enough. But in case of a public website, the numbers of users differ from time to time. In this case, it is better to increase the number of users from a very low number to a maximum number with a time interval. For example, have a user load of 10 but as the test progresses, increase it by 10 after every 10 seconds of testing until the maximum user count reaches 100. So at the 90th second the user count will reach 100 and the increment stops and stays with 100 user load until the test completion.
This type of test with increment of users will help in analyzing the application behavior at every stage with different user load.
If this option is chosen then the load starts with the specified user count and maintains it throughout the test duration.
- User Count: This is used to specify the number of user counts for simulation.
The Load Test starts with the specified minimum number of users and the count increases constantly with the time duration specified, until the user count reaches to the maximum specified.
- Start user count: This option specifies the number of users to start with.
- Step duration: The time duration between the increase in user count from one step to the next.
- Step user count: This option specifies the number of users to add to the current user count.
- Maximum user count: This option specifies the maximum number of user count.
The preceding screenshot shows the parameters set for the Load Pattern used for the scenario. The next step in the wizard is to set the parameter values for Test Mix Model and Test Mix for the scenario.
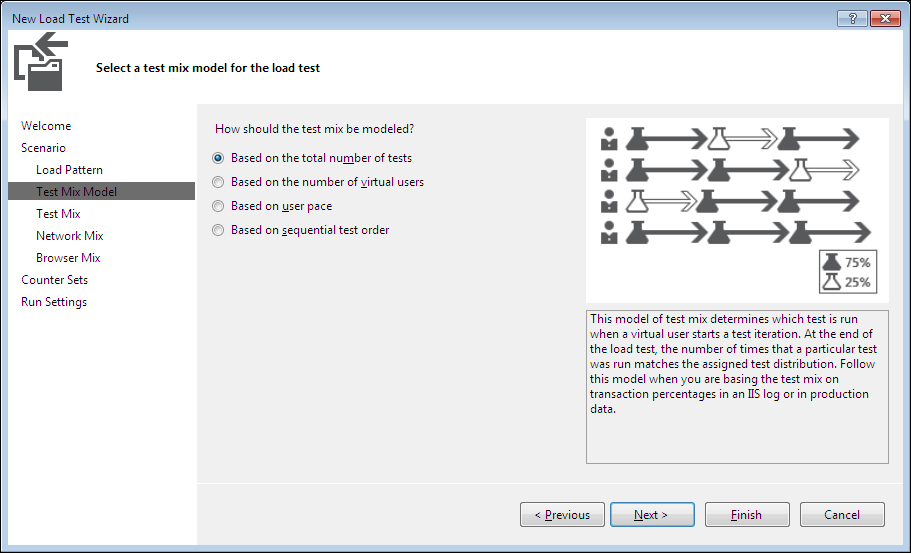
The Load Test model needs to simulate the end users number distribution. Before selecting the test mix, the wizard provides a configuration page to choose the Test Mix Model with four different options. They are based on the total number of tests, virtual users, user pace, and test order.
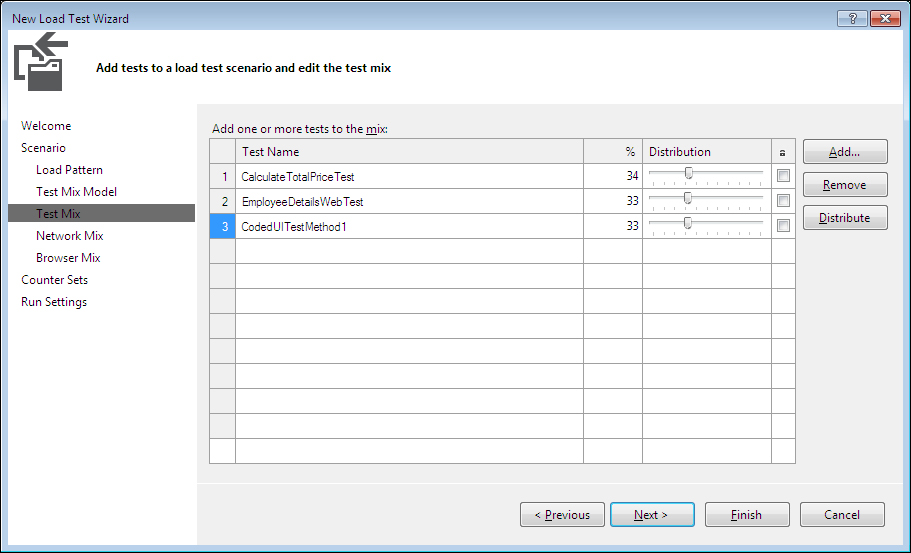
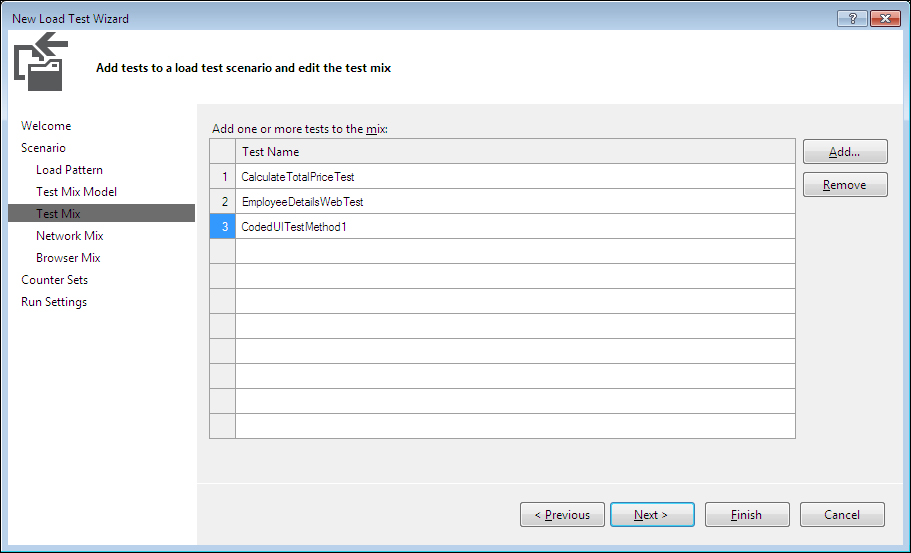
The test mix contains different web tests, each with a differing number of tests per user. The number of users is defined using load pattern.
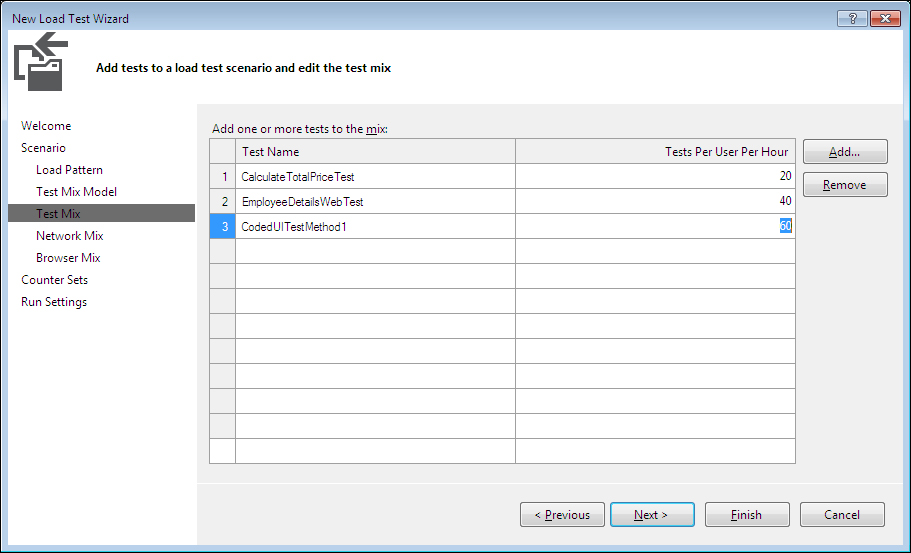
The next page in the wizard provides the option to select the tests and provide the distribution percentage, or specify the users per hour for each test for the selected model. The mix of tests is based on the percentages specified or the test per user specified for each test.
The next test to run is determined based on the selected number of times. The number of times the Test Run should match the test distribution. For example, if the test mix model is based on the total number of tests and if three tests are selected then the distribution of tests will be like the one shown in the following screenshot. The percentage shows the distribution for the selected tests.
This model determines running particular tests based on the percentage of virtual users. Selecting the next test to run depends on the percentage of virtual users and also on the percentage assigned to the tests. At any point, the number of users running a particular test matches the assigned distribution.
This option runs each test for the specified number of times per hour. This model is helpful when we want the virtual users to conduct their tests at regular pace.
With this option, the test will be conducted in the order the tests are defined. Each virtual user will start performing the test one after the other in cycles, in the same order the tests are defined, until the Load Test Run ends.
Once the Test Mix Model is setup and complete, the next step is to define the network mix and the distribution percentage.
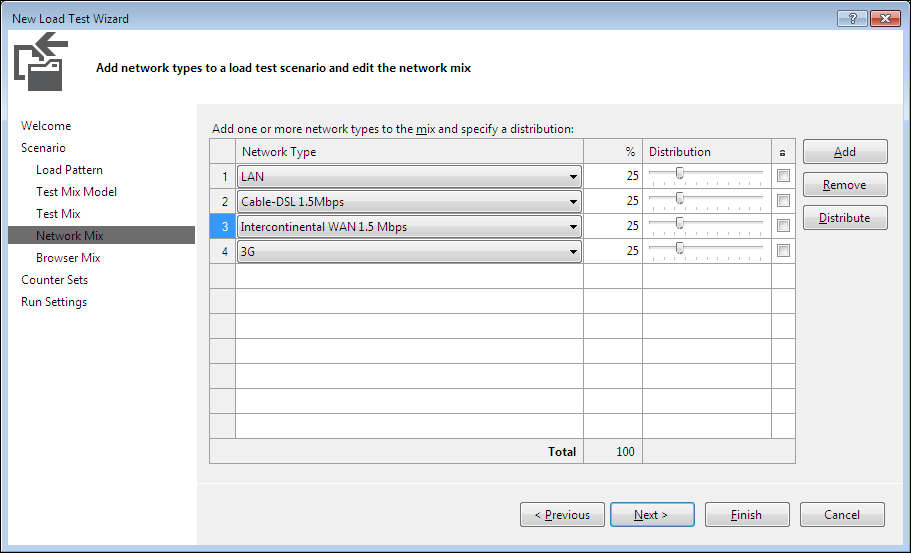
Click on Next in the wizard to specify the Network Mix values, to simulate the actual network speed of our virtual users. The speed differs based on user location and the type of network they use. It could be a LAN network, or cable, or wireless, or dial-up. This step is useful to simulate actual user scenarios. When you add a network type, it will be automatically set with an equal distribution to existing types, but this can be modified as per the need. Here is the default distribution which shows 25 percent of the tests would be tested with each type of network selected.
The next step in the wizard is to set the Browser Mix parameters, which is explained in the next sections.
The number of users and number of tests are now defined but there is always a possibility that all the users may not use the same browser. To represent a mix of different browser types, go to the next step in the wizard, select the browsers listed and give a distribution percentage for each browser type.
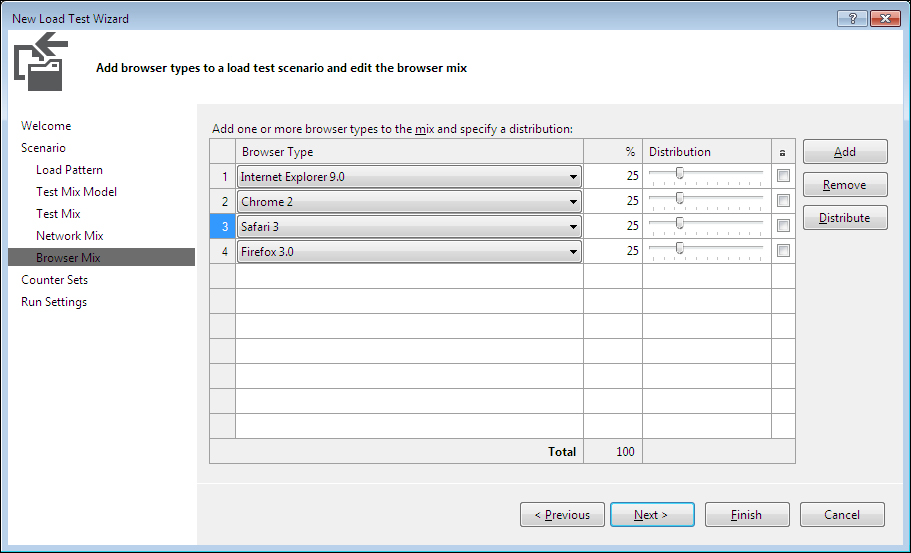
The test does not actually use the specified browser, but it sets the header information in the request to simulate the same request through the specified browser.
Testing an application by Load Test includes application-specific performance including the environmental factors. This is to know the performance of the other services required for running the Load Test or accessing the application under test. For example, the web application makes use of IIS and ASP.NET process and SQL Server. VSTS (Visual Studio Team Server) provides an option to track the performance of these supporting services using counter sets as part of a Load Test. The Load Test itself collects the counter set data during the test and represents it as a graph for easier analysis. The same data is also saved locally to analyze the results later. The counter sets are common for all the scenarios in the Load Test.
The counter set data is collected for the Controller and agents. Other systems which are part of the load testing can also be added. Most of the time the application performance is affected by the common services or the system services used. These counter set results help to understand how the services are used during the test.
The Load Test Creation Wizard provides the option to add performance counters. The wizard includes the current system by default and the common counter set for the Controller and agents. The following screenshot shows the default settings for adding systems to collect the counter sets during the Load Test.
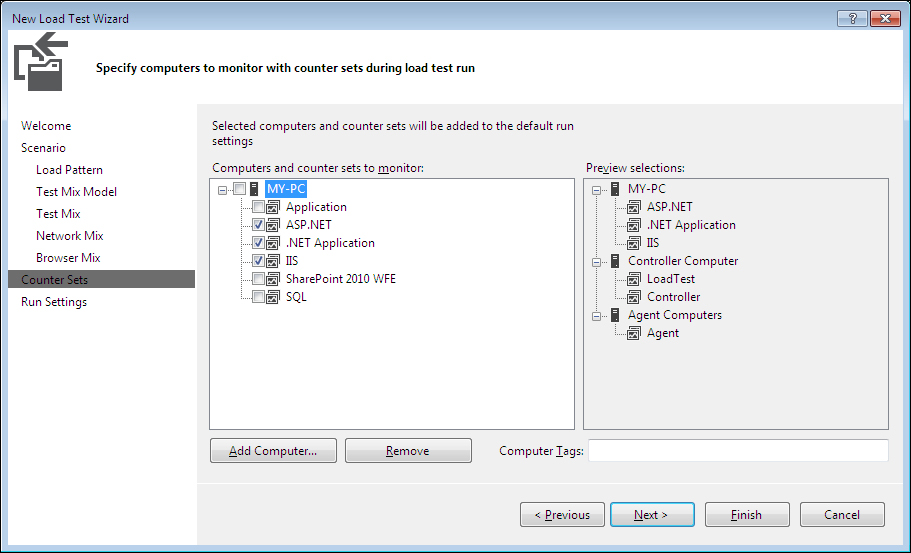
There is a list of default counters for any system that is added. The counters can be selected from the default list. For example, the above image shows that data is to be collected for ASP.Net, .Net Application, and IIS from My-PC. Using the Add Computer... option, keep adding the computers on which the tests are running and choose the counter sets for each system.
Once done with selecting the counter sets, most of the required parameters for the Load Test are complete. The Load Test is now ready but running the test requires few more parameters, and providing these is the last step in the wizard.
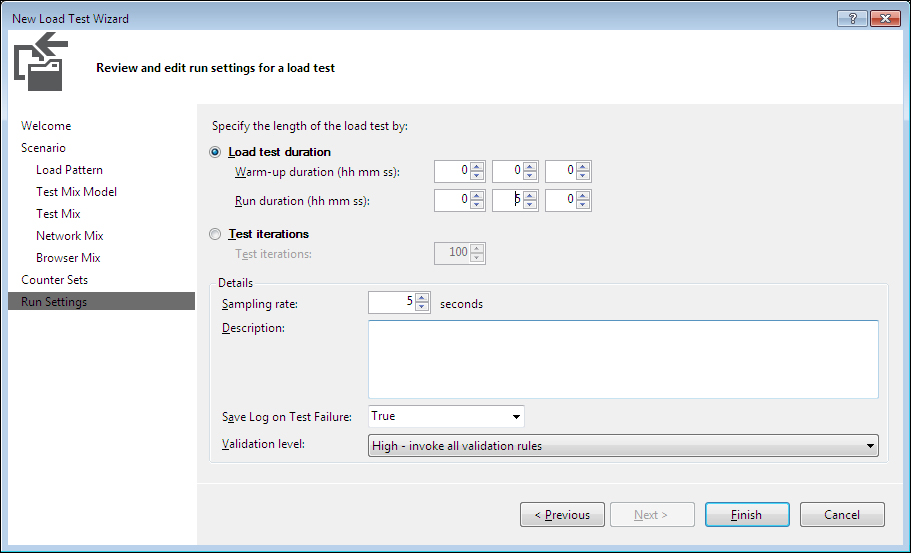
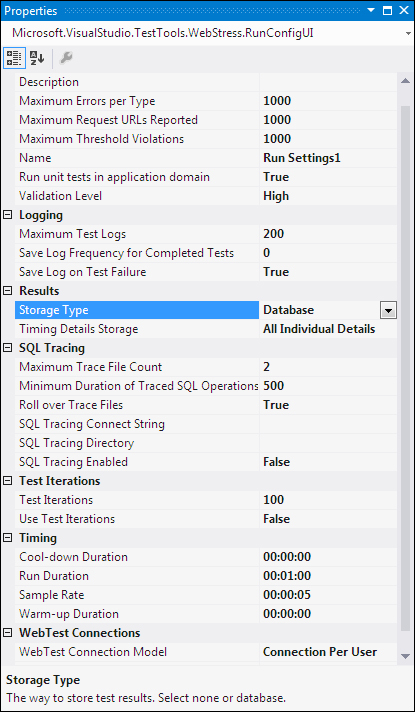
These settings are basically for controlling the Load Test Run to specify the maximum duration for the test and the time period for collecting the data about the tests. The following screenshot shows the options and the sample setting.
There are two options for the Test Run. One is to control it by a maximum time limit and the other is to provide a maximum test iteration number. The Test Run will stop once it reaches the maximum as per the option selected. For example, the following screenshot shows a test set to run for 5 minutes.
The Details section is used to specify the rate at which the test data should be collected, namely the Sampling rate, the Description, the Save Log on Test Failure boolean, and the Validation level option. The Validation level option specifies the rules that should be considered during the test. This is based on the level that is set while creating the rules.
The Save Log on Test Failure option is used to capture and save the individual Test Run details within the Load Test for the failed web or unit tests. This will help in identifying the problems that occur while running the test within the Load Test but not outside the context of Load Test.
Finish the wizard by clicking the Finish button, which actually creates the test with all the parameters from the wizard and shows the Load Test editor, as shown in the following screenshot:
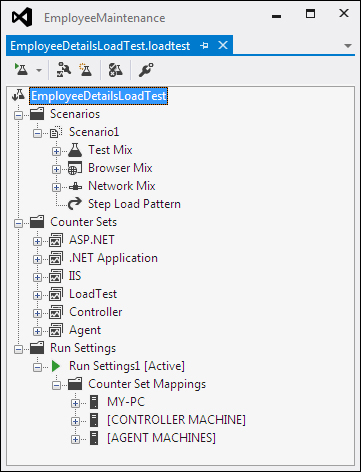
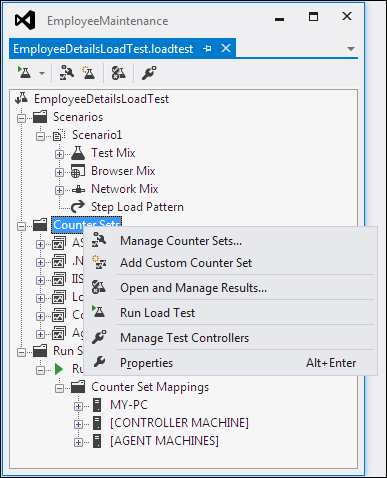
The actual run settings for the Load Test contain the counter sets selected for each system and the common run settings provided in the final wizard section. To know more about what exactly these counter sets contain and what the options are to choose from each counter set, select a counter set from the Counter Sets folder under the Load Test. Right-click on it and select the Manage Counter Sets... option for choosing more counters or adding additional systems. This option displays the same window that was shown as the last window in the wizard.
We can also add additional counters to the existing default list.
For example, the following screenshot is the default list of categories under the .NET application counter set, which is shown when you complete the wizard during Load Test creation.
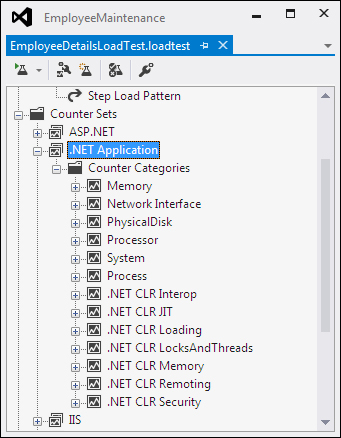
To add additional counter categories just right-click on the Counter Categories folder under .NET Applications folder and select the Add Counters option, and then choose the category you wish to add from the Performance category list. After selecting the category select the counters from the list for the selected category and select the instances you want from the list.
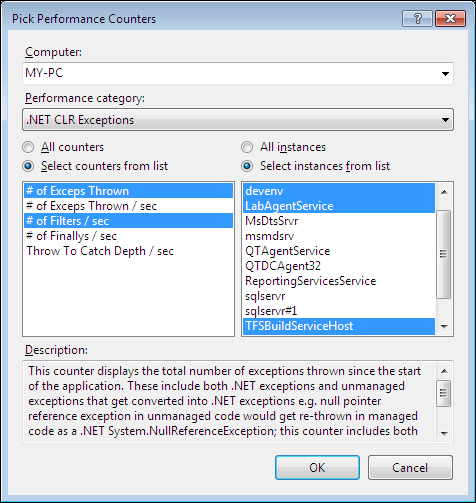
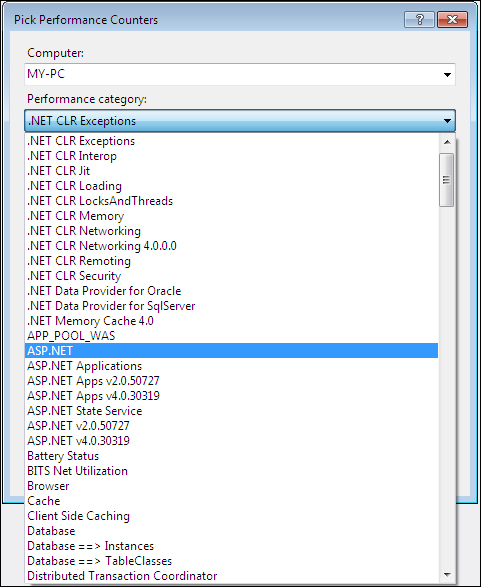
The preceding image shows the .NET CLR Exceptions category selected, along with counters such as number of exceptions thrown and number of Filters per second. The counter instances selected are devenv, LabAgentService, TFSBuildServiceHost, and TFSJobAgent. After selecting the additional counters, click on OK, which adds the selected counters to the existing list for the test. The additional counters added are for the specific computer selected. There are many other performance categories which you can choose from the Performance category drop-down as shown in the following screenshot:
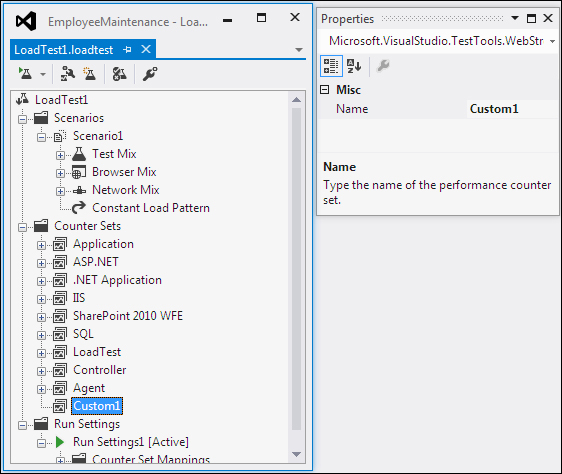
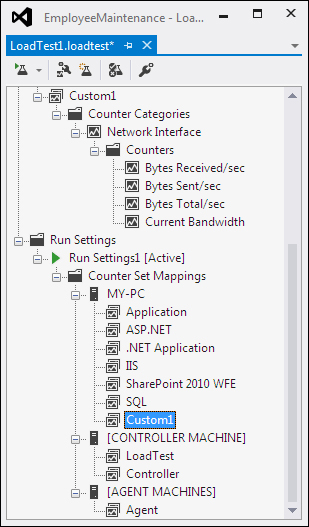
What is shown in the preceding screenshot is the existing counter sets. What if a custom performance counter needs to be added to the run settings for the test? Create a new counter by choosing the Add Custom Counter option in the context menu that opens when you right-click on the counters sets folder. The following screenshot shows a new custom performance counter added to the list.
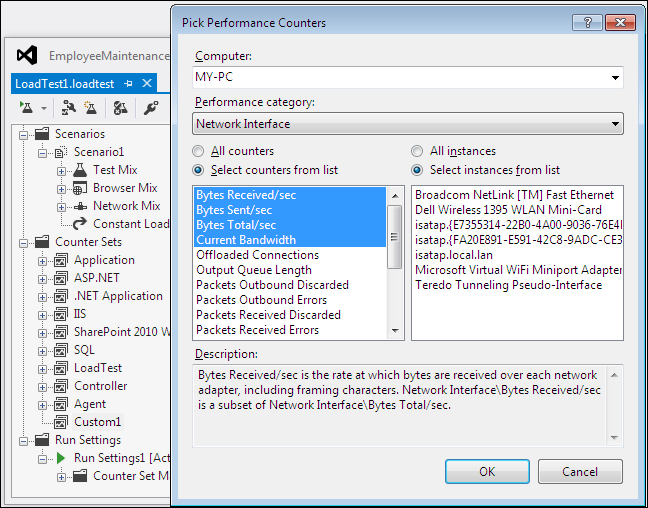
Now select the counter, right-click on it and choose the Add Counters option and select the category, and pick the counters required for the custom counter set. For example, add counters to collect the Network Interface information, such as number of bytes sent and received per second and the current bandwidth during the test. Select these counters for the counter set.
To get the custom counter set as part of all systems for the Load Test, add this as part of the run settings on all the systems. Select the Run Settings folder, right-click and choose the Manage Counter Sets option from the context menu, and choose the custom performance counter Custom1 shown under all available systems. The final list of Run Settings would look as shown in the following screenshot:
Keep adding all the custom counters and counter sets and select them for the systems used for running the test.
The main use of these counters is to collect the data during the test, but at the same time they track the readings as well. The Load Test has an option to track the counter data and indicate if it crosses the threshold values by adding rules to it, which are explained in the coming section.
The main use of the counters and counter sets are to identify the actual performance of the current application under test, and the usage of memory and time taken for the processor. Threshold limits can be set for the data collected during the test and the test engine can alerted if it crosses the threshold limit. For example, alert is required when the system memory is almost full. Also if any process takes more time than the expected maximum time, the system should notify it so that immediate action can be taken. These threshold rules can be set for each performance counter.
Select a performance counter and choose the Add Threshold Rule option, which opens a dialog for adding the rules.
There are two different types of rules that can be added. One is to compare with constant values, and the other is to compare the value with the derived value from some other performance counter. The following rules explain different ways of setting the threshold values.
- Compare Constant: This is to used compare the performance counter value with a constant value. For example, you may wish to generate a warning threshold violation if the available Mbytes reaches to 200 and a critical message if it is less than or equal to 100. The Alert If Over option can be set to true or false, where True denotes that the violation would be generated if the counter value is greater than the specified threshold value, and False denotes that the violation would be generated if the counter value is less than the specified threshold value.
In the following screenshot, the Warning threshold constant value is set to 200 to trigger the warning violation and the Critical threshold value is set to 100 for the critical violation message.
- Compare Counters: This is used to compare the performance counter value with another one. The functionality is otherwise similar to the first option. But here the performance counter values are compared instead of comparing it with constant.
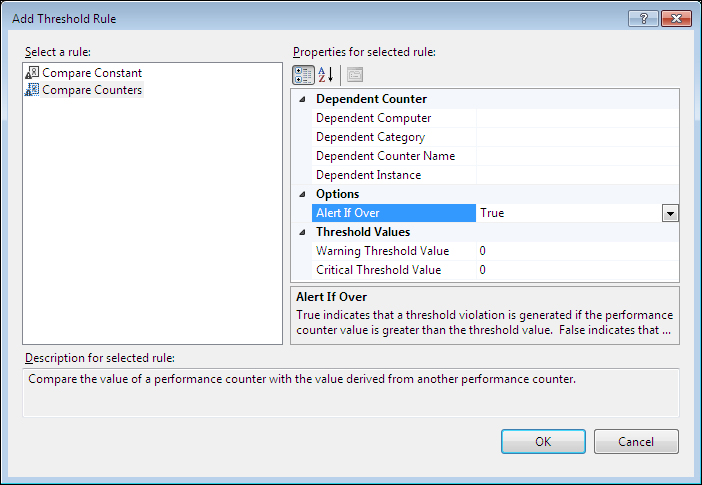
The preceding screenshot shows the options for adding Compare Counters to the counter set. The warning and critical threshold values are constants, which is multiplied by the dependent counter value and then compared with the current counter value. For example, if the dependent counter value is 50 and if the constant is set to 1.25 for warning threshold, then the violation will be raised when the current counter value reaches a value of (50 * 1.25 =) 62.5.
The following screenshot shows an example of the threshold violation whenever the value reaches above the constant defined in the rule.
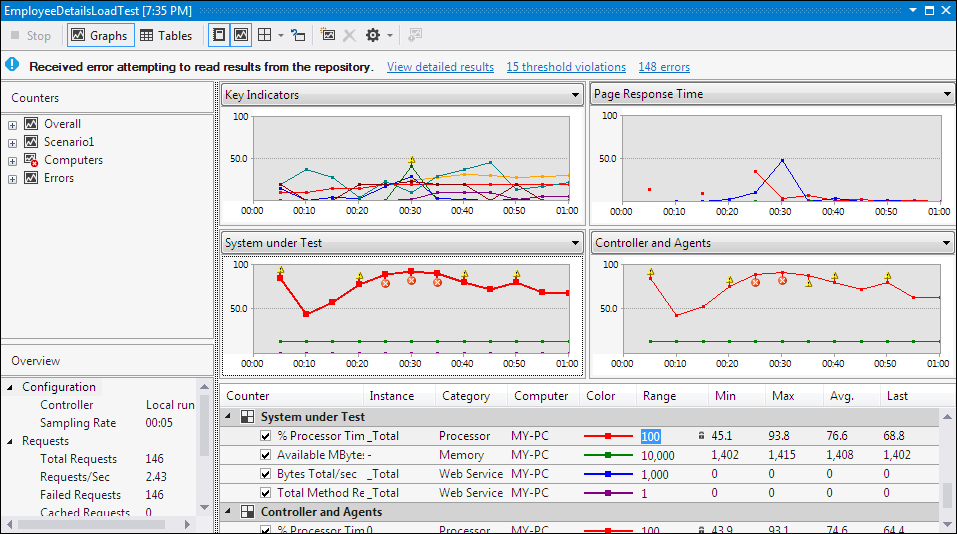
You can see from the screenshot that there were fifteen threshold violations raised during the Load Test Run as shown at the top summary information about the test. The graph also indicates when the counter value had reached a value above the constant defined in the rule. As the graph shows, the value has crossed the value 90, which is more than the allowed limit defined in the rule. If the value is above the warning level, it is indicated as yellow and it is red if it is above the critical threshold value. These rules will not fail the test but will prompt an alert, if the values are above the set thresholds.
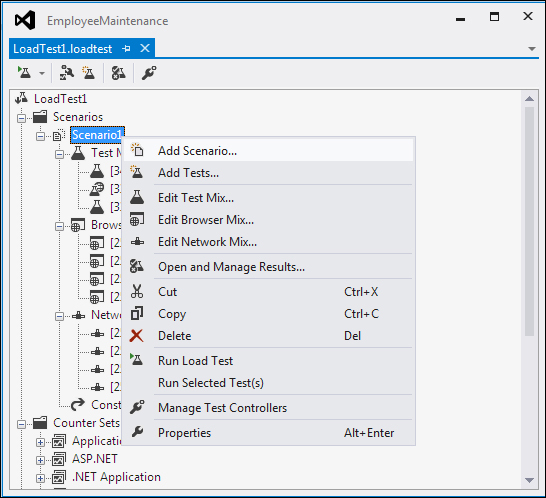
The Load Test can contain one or more scenarios for testing. These scenarios can be edited any time during the design phase. To edit a scenario, select the scenario you want to edit and right-click on it to edit the Test Mix, Browser Mix, or Network Mix in the existing scenario, or add a new scenario to the Load Test. The context menu has different options for editing as shown in the following screenshot:
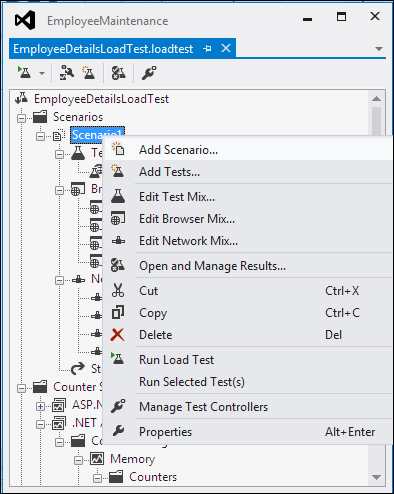
The Add Scenario... option will open the same wizard used for adding the first scenario to the Load Test when the test was created. Keep adding the scenarios as many as required for the test. The scenario Properties window also helps to modify properties such as think profile, the think time between the test iteration, and many more.
The Add Tests... option is used for adding more tests to the test mix from the tests list in the project. Adding a test also adjusts the distribution, but this can be edited using the Edit Test Mix option.
The Edit Test Mix... option is used for editing the test mix in the selected scenario. This option will open a dialog with the selected tests and distribution.
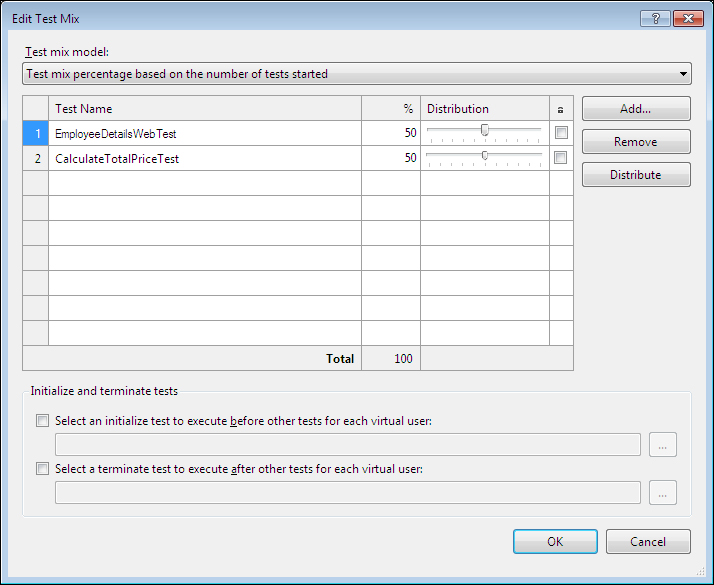
The Edit Test Mix... option can be used to:
- Change the test mix model listed in the drop–down.
- Add new tests to the list and modify the distribution percentage.
- Select an initial test which executes before other tests for each virtual server. The browse option next to it opens a dialog showing all the tests from the project, from which we can select the initial test.
- Similar to the initial test, we can choose a test as the final test to run during the test execution. Same option is used here to select the test from the list of available tests.
The Edit Browser Mix... option opens the Edit Browser Mix dialog from which you can select a new browser to be included to the browser mix and delete or change the existing browsers selected.
The Edit Network Mix... option opens the Edit Network Mix dialog from which you can add new browsers to the list and modify the distribution percentages and also can change or delete the existing network mix.
For changing the existing load pattern, select the load pattern under Scenarios and open the properties window which shows the current patterns properties. You can change or choose any pattern from the available ones in the list as shown in the following screenshot. There are three different patterns available, namely Step, Constant, and Global based.
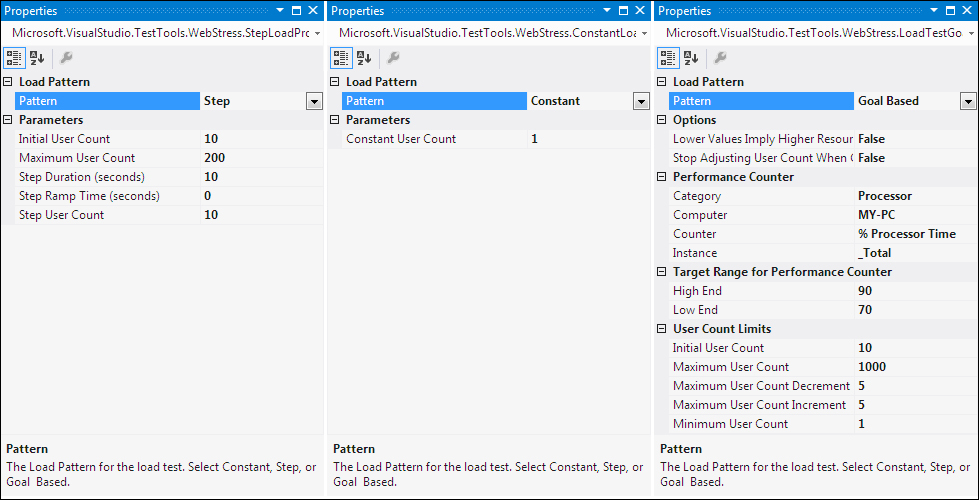
The Step Load Pattern has an initial user count and a maximum user count, along with a step duration and step user count. In the preceding screenshot, every 10 seconds the user count would be increased by 10 until the maximum user count reaches 200.
The Constant Load Pattern has only one constant user count value. The user count will remain the same throughout the test.
The Goal Based Load Pattern has lot of parameters to target a particular machine and particular counter category and counter. Parameters can be set for initial user count, minimum user count, maximum user count, user count decrement, user count increment and adjusting the user count.
There can be multiple Run Settings for Load Tests, but at any time only one can be active. To make the run settings active, select Run Settings, right-click on it and select Set as Active. The properties of your Run Settings can be modified directly using the properties window. The properties that can be modified include logging, results storage, SQL tracing, test iterations, timings, and the web test connections.
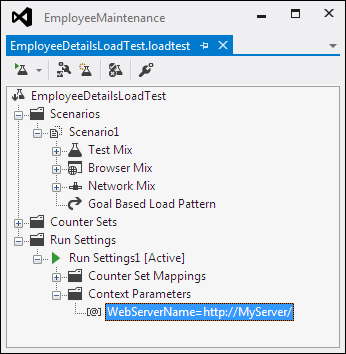
We have seen the details of context parameters in Chapter 5, Web Performance Test. Web tests can have context parameters which can be used in place of the common values used across multiple requests. For example, multiple requests may have the same web server name, which can be replaced by a context parameter. Whenever the actual web server changes, then just change the context parameter value and it will replace all the requests with the new server name during runtime.
The Load Test is created based on the web tests or unit tests are created already as part of the project. There could be a context parameter like server name used in the web test which is part of the Load Test. There is also a possibility that the server name could change for the Load Test alone. In case of change in the context parameter for the Load Test, the parameter already used as part of the web test should be overridden. To do this, just add another context parameter to the Load Test with the same name as used in the web test. The context parameter added to the Load Test will override the same context parameter used in the web tests. To add new context parameter to the Load Test, select Run Settings and right-click to choose the Add Context Parameter option, which adds a new context parameter. For example, the context parameter used in the web test has the web server value as:
this.Context.Add("WebServerName", "http://localhost:3062");Now to overwrite this in Load Tests, add a new context parameter with the same name as shown in the following screenshot:
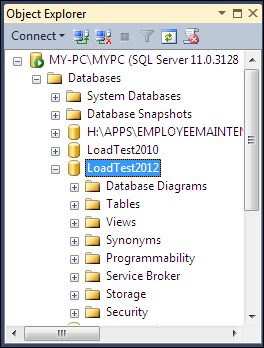
All information collected during a Load Test Run is stored in the central result store. The Load Test Results store contains all the data collected by the performance counters and the violation information and errors that occurred during the Load Test. The result store is the SQL server database created using the script loadtestresultsrepository.sql which contains all the SQL queries to create the objects required for the result store.
If there are no controllers involved in the test and if it is the local test, we can create the result store SQL database using SQL Express. Running the script creates the store using SQL Express. Running this script once on the local machine is enough for creating the result store. This is a global central store for all the Load Tests in the local machine. To create the store, open the Visual Studio Command Prompt and run the command with the actual drive where you have installed the Visual Studio.
cd c:Program FilesMicrosoft Visual Studio 10.0Common7IDEIn the same folder run the following command which creates the database store:
SQLCMD /S localhostsqlexpress -i loadtestresultsrepository.sqlIf you have any other SQL Server and if you want to use that to have the result store then you can run the script on that server and use that server in connection parameters for the Load Test. For example, if you have the SQL Server name as SQLServer1 and if the result store has to be created in that store then run the command as follows:
SQLCMD /S SQLServer1 -U <user name> -P <password> -i loadtestresultsrepository.sqlAll of these above commands create the result store database in the SQL Server.
If you are using a controller for the Load Tests, the installation of the controller itself takes care of creating the results store on the controller machine. The controller can be installed using the Microsoft Visual Studio Agents 2012 Product.
To connect to the SQL Server result store database select the Load Test option from the Visual Studio IDE and then select the Manage Test Controllers… window. This option will only be available on the controller machine. If the result store is on a different machine or the controller machine, select the controller from the list or select <Local-No controller>, if it is in the local machine without any controller. Then select the Load Test Results store using the browse button and close the Manage Test Controller window.
The controllers are used for administering the agent computers and these agents plus the controller form the rig. Multiple agents are required to simulate a large number of loads from different locations. All the performance data collected from all these agents are saved at the central result store at the controller, or any global store configured at the controller.
Load Tests are run like any other test in Visual Studio. Visual Studio also provides multiple options for running the Load Test.
One is through the Load Test menu in Visual Studio. Select the Menu option and then choose Run and Selected Test to run the tests that is currently selected.
The second is the inbuilt Run option in the Load Test editor toolbar. Open the Load Test from the project which opens the Load Test editor. The toolbar for this Load Test editor has the option to run the currently opened Load Test.
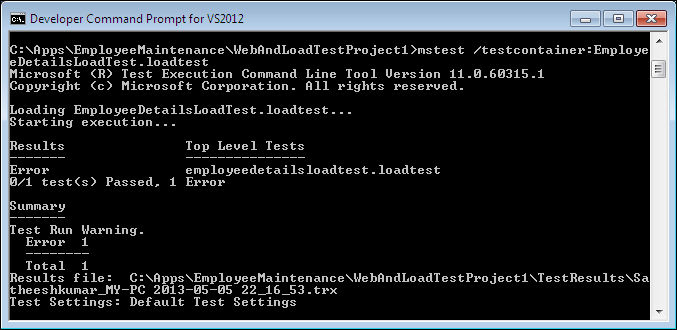
The third option is through the command line. This utility is installed along with Visual Studio. Open the Visual Studio Command Prompt and from the folder where the Load Test resides, run the command to start running the Load Test as shown:
mstest /testcontainer:LoadTest1.loadtestIn all the preceding cases of running Load Test through UI, the Load Test editor will show the progress during the Test Run, but the command-line option does not show this. Instead, it simply stores the result to the result store repository.
It can be loaded later to see the Test Result and analyze it. Follow the given steps to open the result for the tests that are already run:
- Navigate to Menu | View | Other Windows | Test Results.
- From the Connect drop-down select the location for the Test Results store. On selecting this you can see the trace files of the last run tests getting loaded in the window.
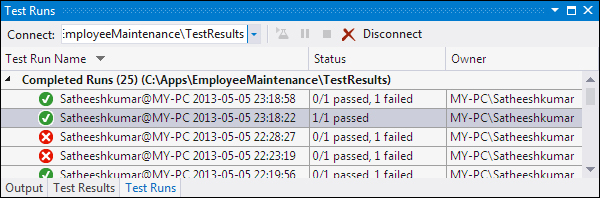
- Double-click on the desired Test Runs shown in the window that connects to the store repository and fetches the data for the selected Test Result and presents in the Load Test window. The end result of the Load Test editor window will look like the one shown as follows with all the performance counter values and the violation points.
More details about the graph is given in the Graphical View subsection.
The Load Test Result contains loads of information about the test and various counter data. All of these details are stored in the results repository store. The graph and indicators shown during the Test Run contain only the most important cached results; the actual detailed information is stored in the store. The result can be loaded later from the store for analysis.
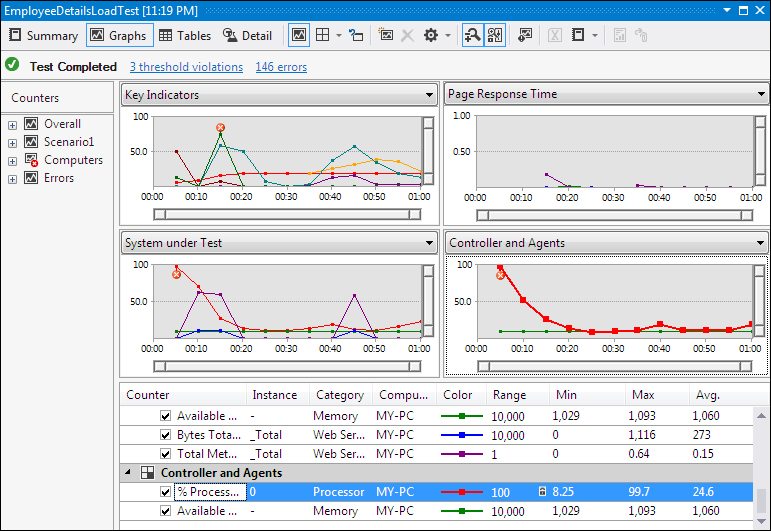
There are different ways to look at the Test Results using the options in the Load Test Results window. There are four different views which can be switched any time to look at the result. The following one is the graphical view of the Test Results. The graphical view window contains different graphs shown for different counters.
The graphical view of the result gives a high-level view of the Test Result, but the complete Test Result data is stored in the repository. By default, there are four different graphs provided with readings. Select the drop-down and choose any other counter reading for the graphical view.

- Key Indicators: This graph shows the data collected for average response time, JIT percentage, threshold violations per second, errors per second, and the user load. The details about the graph are given below the four graphs section, which describes the actual counter data collected during the test with the corresponding color coding with minimum, maximum, and average value for the counter.
- Page Response Time: This graph explains how long the response for each request took in different URLs. The details are given below the graphs.
- System under Test: This is the graph, which presents the data about different computers or agents used in test. The data includes readings such as the available memory and the processing time.
- Controller and Agents: The last graph presents the details about the system or machine involved in Load Test. The data collected would be the processor time and the available memory.
The color coded lines in the graph has corresponding summary information in the grid below the graphs area with the color legends. The details contain information such as the counter name, category, range, min, max, and average readings for each counter. The legends grid can be made visible or invisible using the option in the toolbar.
For example, in the preceding image you can see the graph Key Indicators on the top-left of all the graphs. Different types of readings are plotted in different colors in the graphs. The counters from this counter set are also presented in the table below the graphs, with all the counters and the corresponding colors for the counter used in the graph.
New graphs can be added to collect details for specific counters. Right-click on any graph area and select the option Add Graph, which adds a new graph with the given name. Now expand the counter sets and drag-and-drop the required counters on the new graph so that the readings are shown in the graph as shown in the following sample graph Graph1:
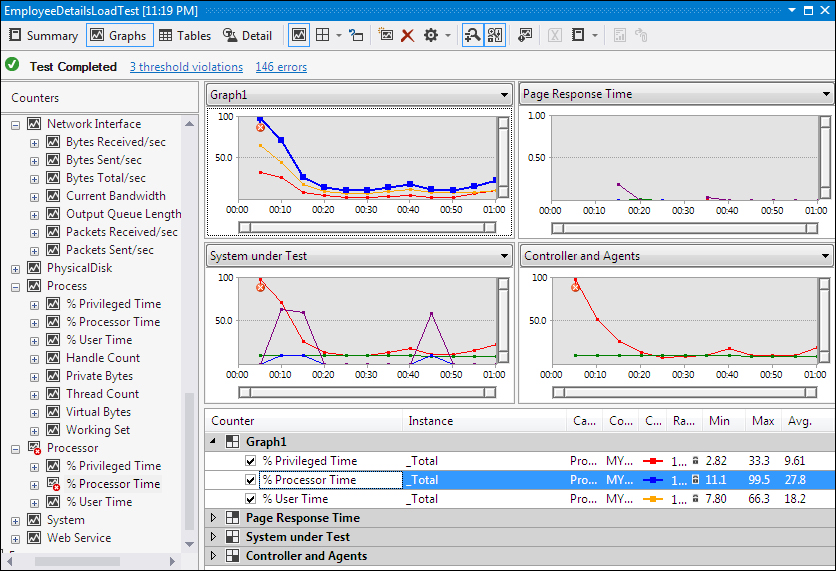
The Graph1 is the new graph added to the result with a few processor related counters added to it. The counters and readings are listed in the table below the graphs.
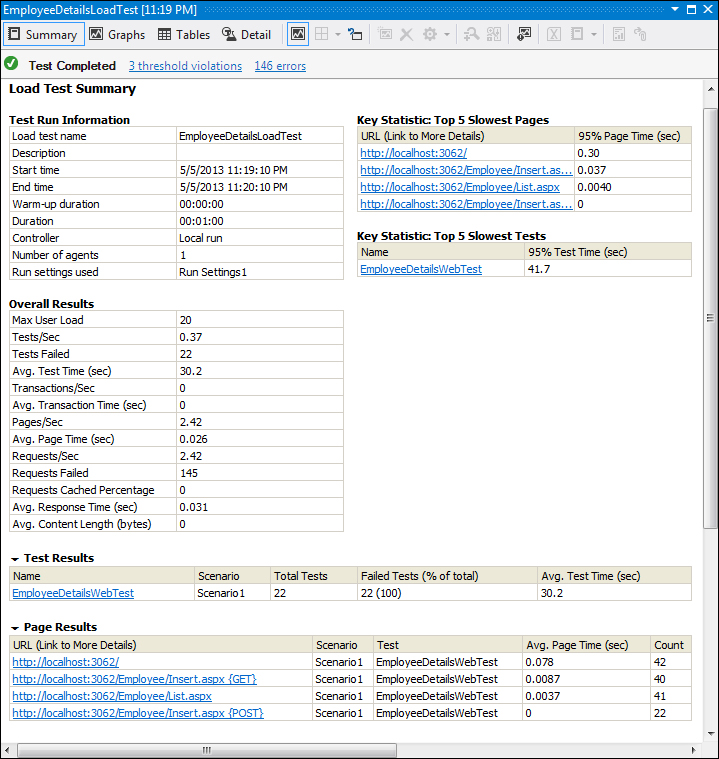
The Summary view option in the Load Test editor window toolbar presents more information on the overall Load Testing.
The most important information is the top five slowest pages and the top slowest tests. The tests are ordered based on the average test time taken for each test and the time taken for each page request.
- Test Run Information: This section provides the overall Test Run details like start date and time, end date and time, test duration, number of agents used for the test and the settings used for the entire test.
- Overall Results: Provides information such as the maximum user load, number of tests per second, request count, pages per second and the average response time during the Test Run.
- Test Results: This section shows status information such as the number of tests conducted for each test selected for Load Testing. For example, out of 100 tests run for the web test selected for Load Testing, the number of tests passed and the number of tests failed.
- Page Results: This section reports information about the different URLs used during the test. This result gives the number of times a page is requested and the average time taken for each page. The detail includes the test name to which the URL belongs.
- Transaction Results: The transaction is the set of tasks in the test. This section in the Summary view shows information such as scenario name, test name, the elapsed time for testing each transaction tests, and the number of times this transaction is tested.
- System under Test Resources: This section reports information about systems involved in testing, the processor time for the test, and the amount of memory available at the end of test completion.
- Controller and Agents Resources: This section provides details of the machines used as controller and agents for the test. Details such as processor time percentage and the available memory after the test completion are also displayed.
- Errors: This section details out the list of errors that occurred during the test, information like the error type, subtype, and number of times the same error has occurred during the test and the last message from the error stack.
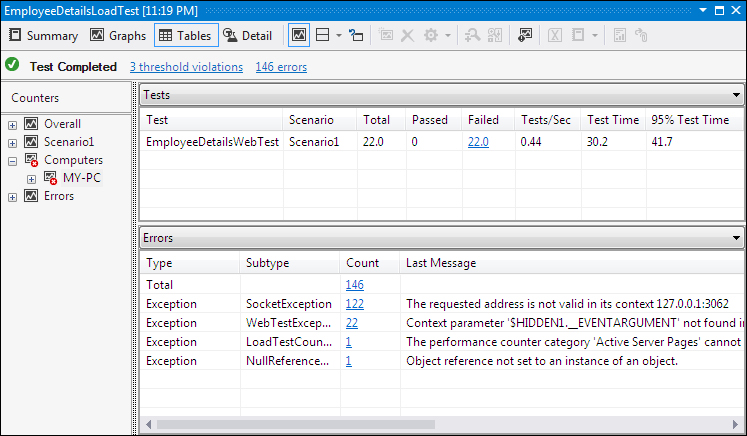
We have seen the Summary view and the Graphical view and customizing the Graphical view by adding custom graphs and counter to it. The tool bar provides a third view to the results which is the tabular view.
The Tables view provides summarized Test Result information in a tabular format. By default there are two tables shown on the right pane, with the table on top showing the list of tests run and their run details like the test name, scenario name, total number of tests run, number of tests passed, number of tests failed, and the test time. The second table below the first one shows information on Errors that occurred while testing. The details shown are the type of exceptions, subtype of the exception, number of exceptions raised, and the detailed error messages.
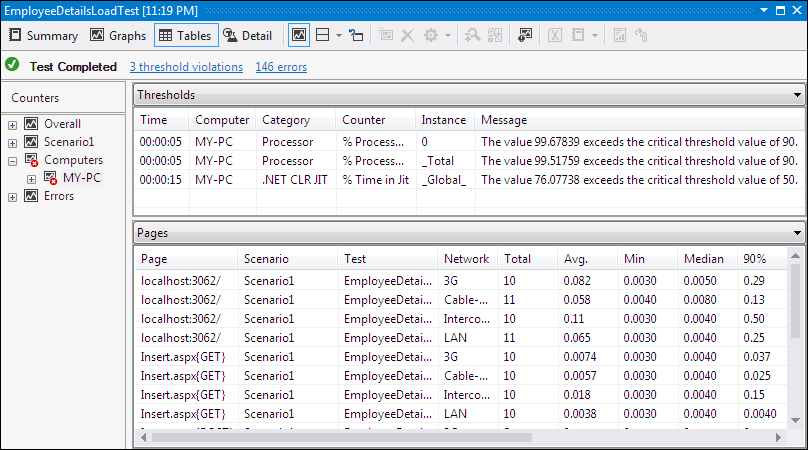
Both of these table headers are drop-downs which contain multiple options like Tests, Errors, Pages, Requests, SQL Trace, Test Details, and Thresholds and Transactions. You can select the option to get the results to be displayed in the table. For example, the following screenshot shows the tabular view of the threshold violations and the web pages during the test.
The Threshold violation table shows detailed information on each violation that occurred during the test. The counter category, the counter name, the instance type, and the detailed message explain the reason for the violation, showing the actual value and the threshold value set for the counter.
The next table below Threshold shows the pages visited during the test and the count of total visits per page, with other details such as the network used for testing and the average, minimum, and median time taken for the page visits.
This view provides tabular details for the counters which can be selected from the drop-down.
The Detail view tab shows the virtual user activity chart for the Load Test Run. The chart shows the user load, load pattern, tests failed or aborted, or slow tests during the load. This view contains three sections: one is to select the tests with color code legends; the second section is to filter the results to show in the chart; the third is the detailed chart.
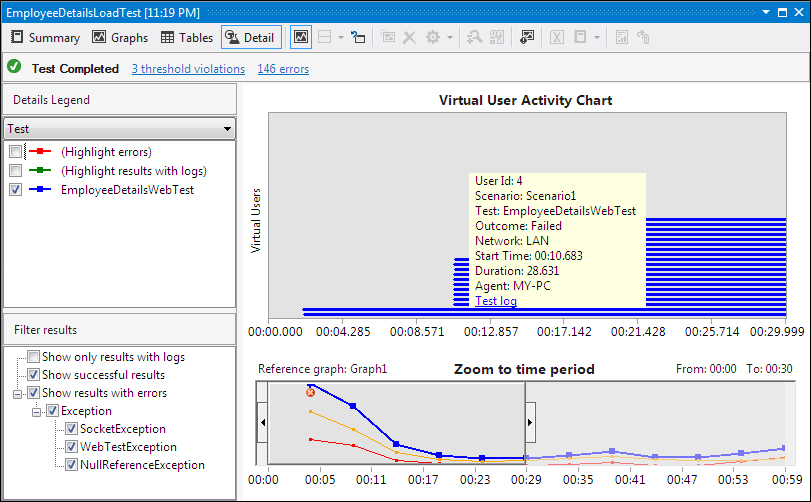
Pointing to any of the line in the activity chart shows a tool tip message for the selected user with all the activity details like virtual user ID, scenario, test name, test outcome, network, start time of the test, duration for the test, and the agent on which the test was run.
Multiple views of looking at the Load Test Result help in analyzing the result in a better manner. This can help in further fine tuning the application to improve quality and stability of the application.
Load Test Results can be exported to Excel using the Create Excel Report option in the toolbar of the Load Test Result editor. When you choose this option, Microsoft Excel opens with a wizard to name the report and configure the data required for that report.
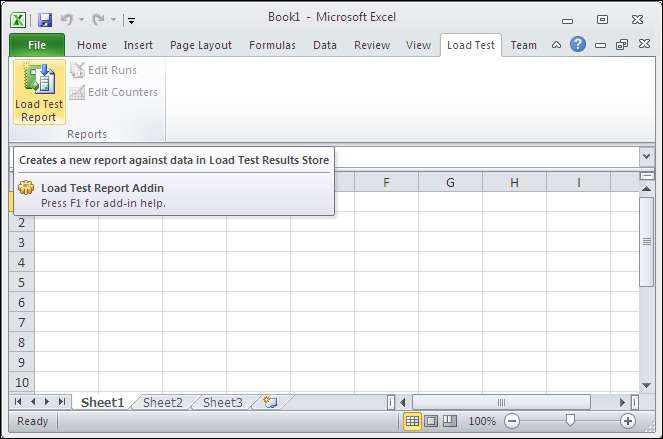
The other option is to open Microsoft Excel and select the Load Test Report option available under the Load Test menu, as shown in the following screenshot. This option directly connects to the Load Test data repository.
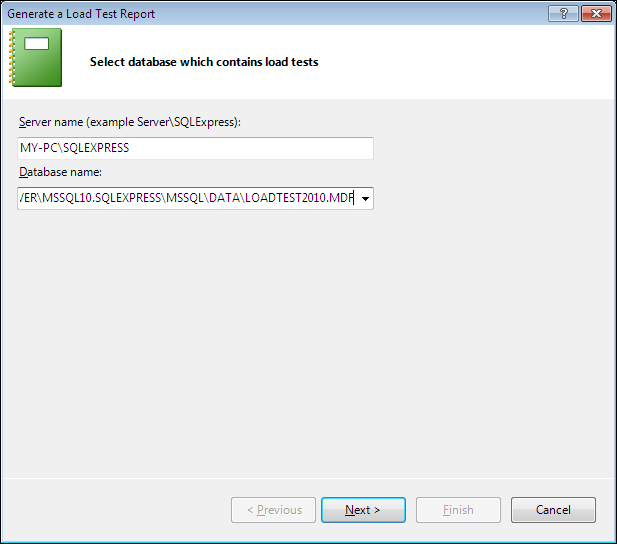
The next step is to select the database for the Load Test. Connect to the server and choose the database where all Load Test data is stored.
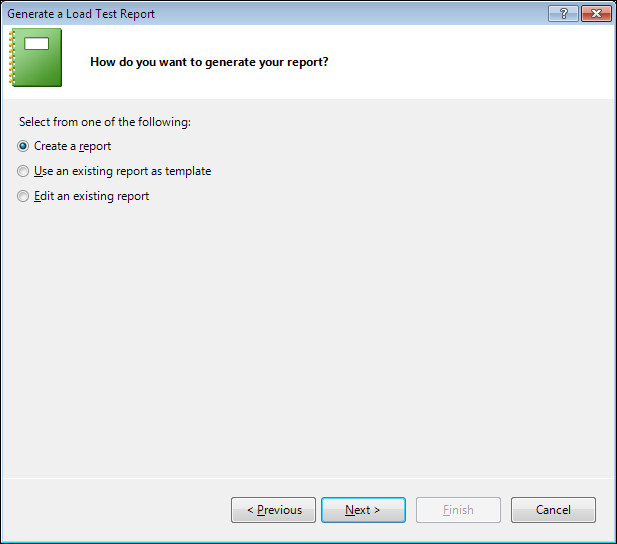
The next step in report creation is to select the option either to create a new report or use an existing report as a template, or editing an existing report. Let's choose the first option which is the default to create a new report.
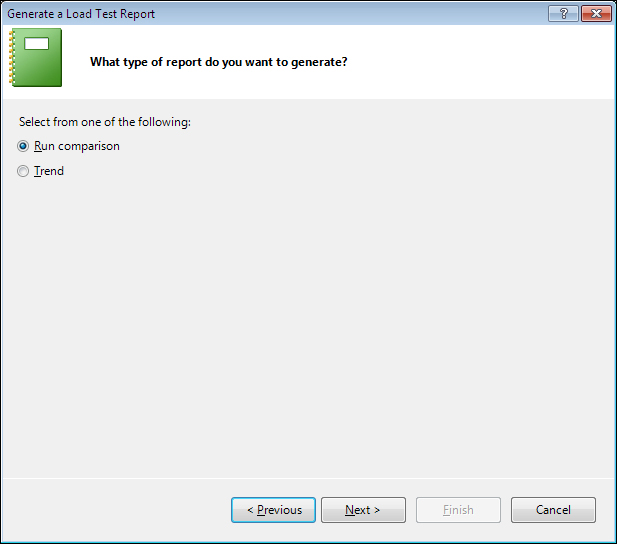
The next option is to select the type of report. There are two report types, one is to Run comparison and the second type is to generate it through Trend.
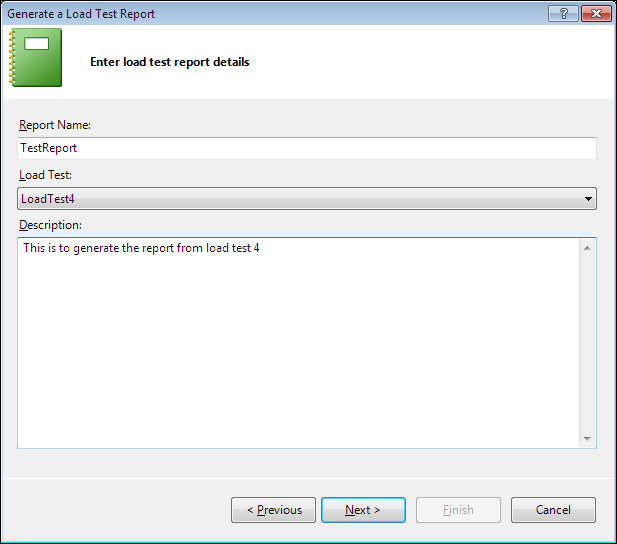
Click on Next in the wizard then provide the report name, select the corresponding Load Test from which the report has to be generated, and then provide a detailed description for the new report.
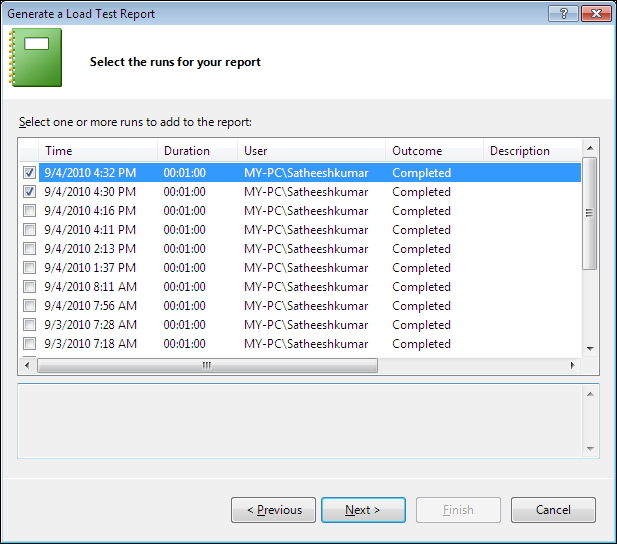
Clicking on Next in the wizard connects to the data repository and pulls the results for the selected Load Test. For each Test Result the test runtime, test duration, user name, and test outcome are shown in the list. Choose any of the two Test Results so that a comparison report will be generated for the selected Test Results.
The next step is to select the counters from the Test Results for the report as shown in the following screenshot:
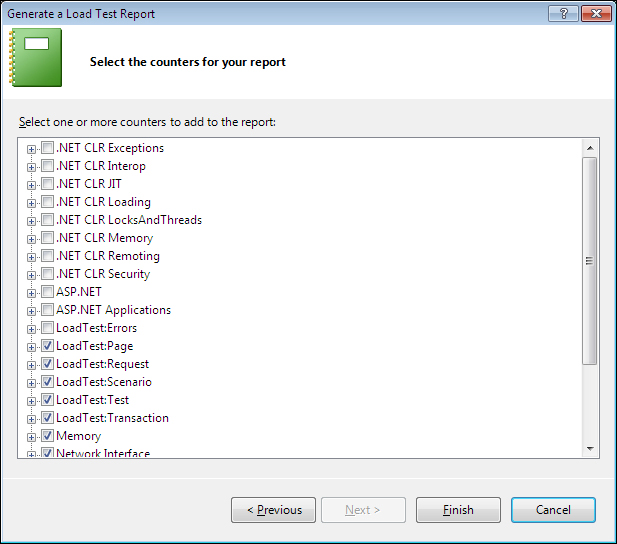
After selecting the required counters, click on Finish to complete the wizard and start the generation of the actual report. Microsoft Excel starts gathering the information from the repository and generates different reports in different worksheets.
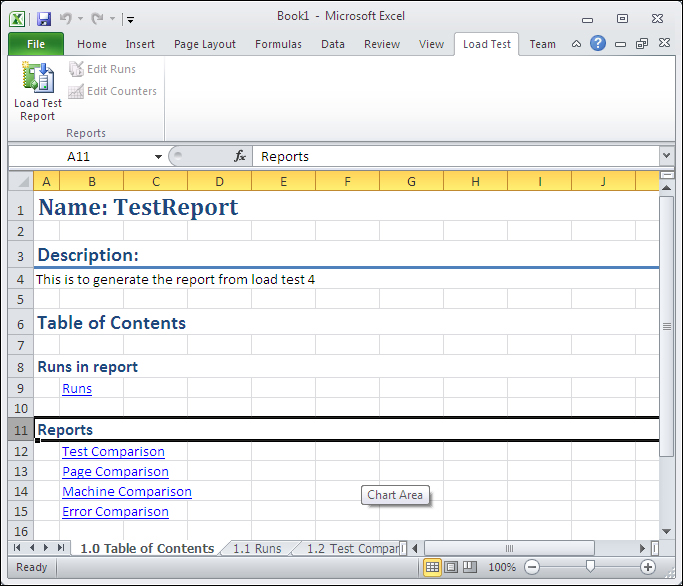
There is an initial worksheet which shows Name, Description, and Table of Contents for the reports.
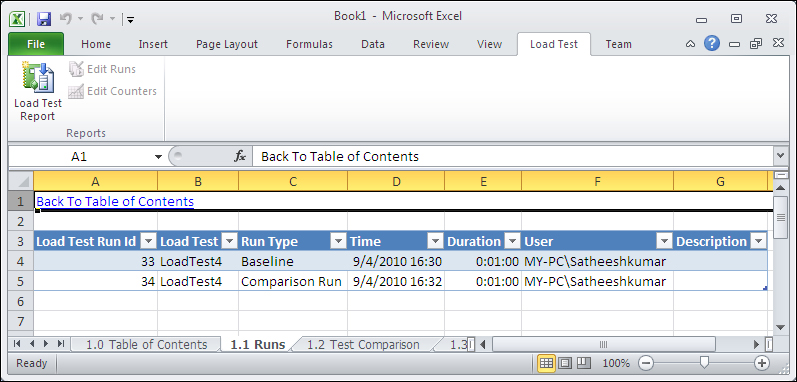
The first report page following the Table of Contents page is the Runs sheet, which shows two Test Results and indicates the type of the results. The first one is considered as the baseline type and the second is the comparison run.
The next four sheets show the comparison between the selected Test Results. The first one is the Test Comparison sheet, which shows the comparison between the results, the second is the Page Comparison sheet, the third is the Machine Comparison sheet and the last sheet shows the Error Comparison sheet. The following screenshot shows the page comparison between the test results.
The graph shows the average page response time, and the performance improvement when compared to the baseline Test Result.
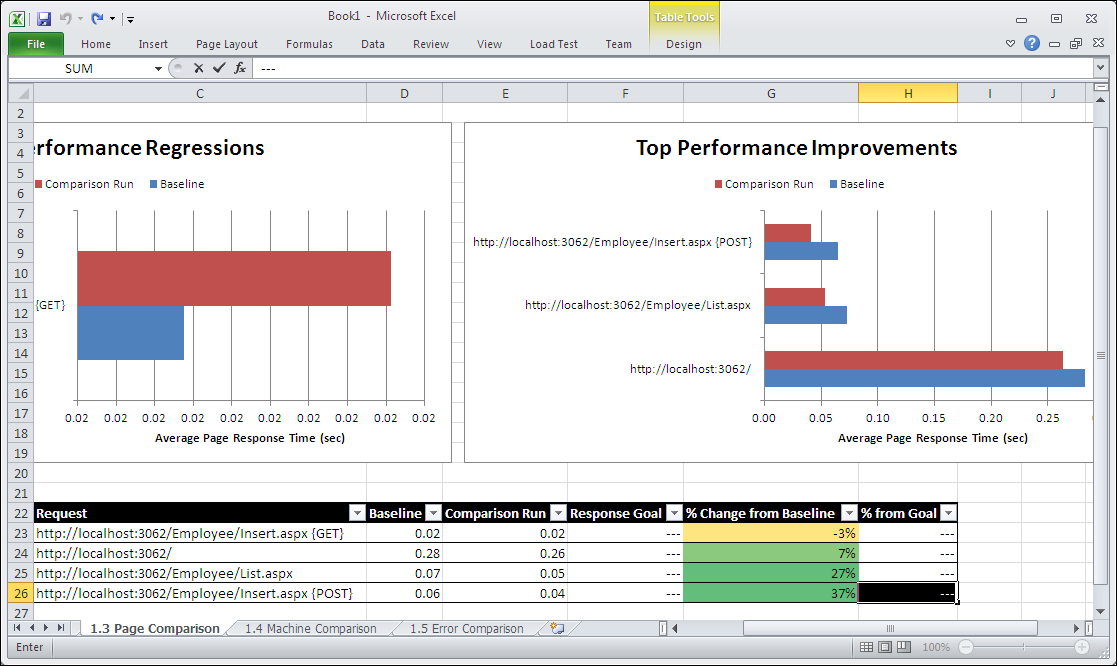
The report also shows the requests made by both results and the percent change from baseline, which show some significant change in performance. These types of reports are very helpful to compare Test Results and choose the best test. It also helps us to configure the test better for better results. Once the report is generated, it can be customized easily as per the need, as the report is generated directly in Microsoft Excel.
The Controller and Agents needs to be installed separately and configured as it doesn't come by default with Visual Studio. To install the Controller and Agent, the Visual Studio Agents installable is required and you must be a part of the Administrators security group.
Test Controller and Agent can be installed on the same machine where you have Visual Studio Ultimate, or you can install in different machines and then configure the settings appropriately.
Install Visual Studio Test Controller using the Visual Studio Agent installable. Provide all the details and then finish the installation. Once the installation is complete, select the Configure test controller now option to start configuration for the controller. The Configure Test Controller dialog is displayed:
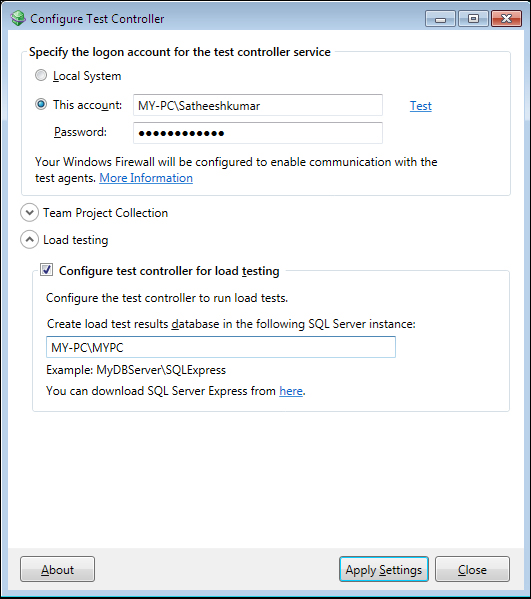
The first section in the configuration is the logon information. The user account must be a member of the Administrators group and should also be part of the Test Controller's user account to use the controller for testing.
You can register the controller with the Team Project collection in TFS to create environments. Provide the Team Project collection URL in the next section.
The next step is to provide an SQL server instance name to store the Load Test Results. It can be a local SQL Express or any other SQL instance, which you would like to use for storing the Load Test Results. The service account can be used by all agents to communicate with the controller. The details of the service account can be provided as part of the project collection.
Either one of the preceding options can be used. Either register with the TFS project collection or provide SQL instance to configure the Test controller Cor Load Test and store the Test Results.
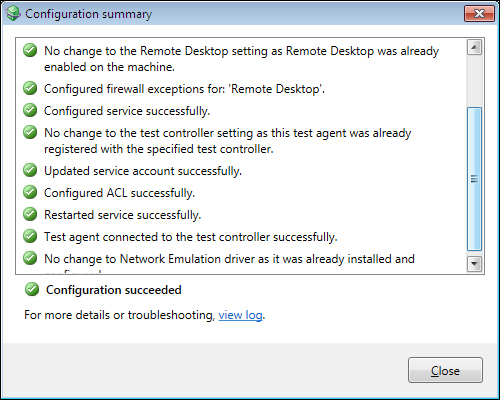
After configuring all required details, click on Apply Settings to open the Configuration summary dialog that shows the status of each step required to configure the Test Controller. Close the Configuration summary dialog and then close the Configuration Tool.
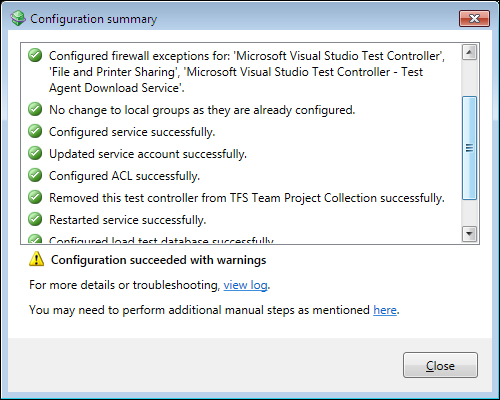
Configuring Test Controller creates the data store in the selected SQL Server instance. The next step is to install the agents using Visual Studio Agents 2012 setup.
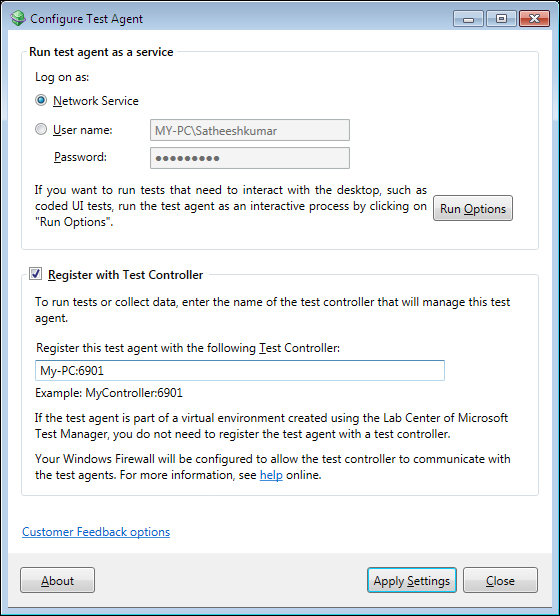
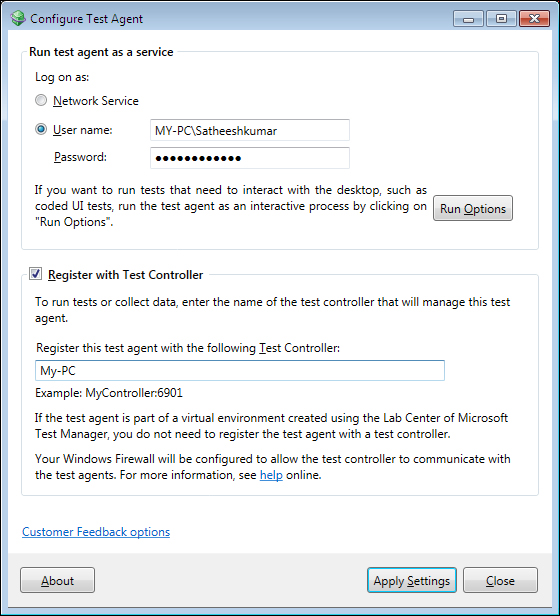
Once the installation of Test Agent is complete, the Configure Test Agent dialog is displayed. In the first section, provide the user details with which the service will run.
In case if the tests like coded UI test has to interact with the desktop, click on Run Options and then select the run option as Interactive process. In this mode, you can run the automated tests that interact with the desktop such as coded UI tests.
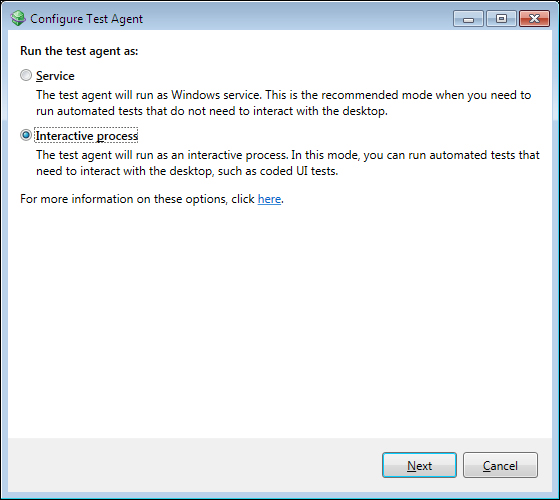
In case of interactive process, there is an option to select Log on automatically. This option encrypts the user credentials, stores them in the registry, and uses the details to run the tests automatically after reboot.
There is another option as Ensure screen saver is disabled, which should be selected in the case of interactive process to avoid the interference of the screen saver in interactive tests.
The next step is to register the agent with the Test Controller. Select the option Register with Test Controller and then provide the name of the Controller to register this Test Agent with the controller to collect the test data. If the Test Agent is part of a virtual environment created using the Lab Center of Microsoft Test Manager, there is no need of registering the Test Agent with the Test Controller. Click on Apply settings to save the configuration. This opens the configuration summary screen which shows the status of each step required to configure the Test Agent.
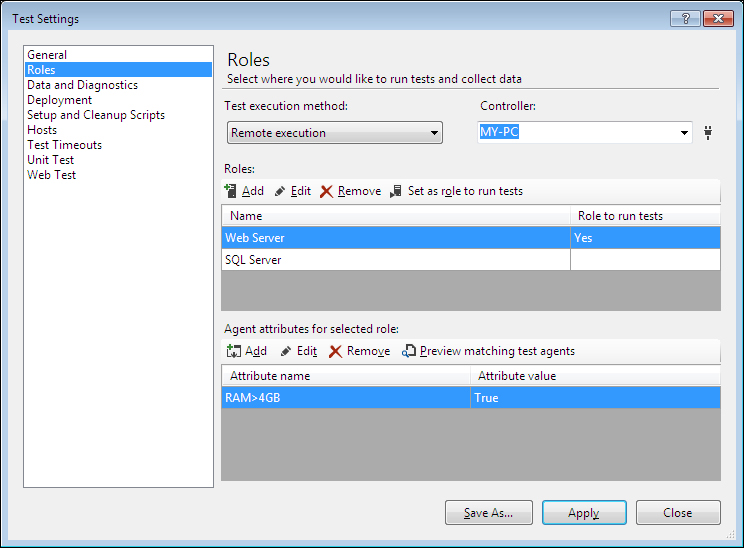
Now we can use the Test Controller and Test Agent to perform the Load Test, although we need to configure them first. Open the solution and right click on it to add new item. Select Test Settings from the template and then add a new test settings to the solution, which opens the dialog for the test settings. Enter the test setting name, description, and choose the naming scheme in the General section and then click on Roles. The Roles page is used to configure the controller and agents to collect data and run the tests. Select the test execution method as Remote execution and then select the Controller name from the Controller drop-down, which will control the agents and collect the test data.
Click on Roles to add different roles to run tests and collect data. The role could be a Web Server or SQL Server. Each role uses a Test Agent that is managed by the Controller. You can keep adding the roles. To select the role that you want to run the test, click on Set as role to run tests. The other roles will not run the test but used for data collection.
To limit the number of agents used for tests, set attributes and filters. Click on Add in the attributes section and then enter the attribute name and value for the selected role.
From the Data and Diagnostic page, we can define the diagnostic data adapter that the role will use to collect the data. If there are more data and diagnostics selected for the role and if there are available agents, the controller will make use of the available agents to collect the data. To configure data and diagnostics, select a diagnostic and click on Configure.
Complete the remaining parts of the test settings and apply them to complete the process.
Now start creating the Load Test using the new test settings and then run the Load Test. To load the Test Results collected by the controller, open the Load Test and from the toolbar choose the Open and Manage Load Test Results option. After selecting the options you can see the Test Results collected by the controller. To see the details of each Test Result, double click on it which opens the Load Test analyzer and show the details of the Test Result. The other option available is to import the existing result from the trace file into the controller repository and to export the results to a trace file repository from the controller.