
Chapter 3. Acoustic Environment
3.1. The Acoustic Environment
We are concerned about the effect the acoustic environment has on sound. We need to know the effect of a particular acoustic environment on the unaided talker or musician, on the sound system, if installed, and on unwanted sounds (noise) that may be present in the same environment.
An outdoor environment can often be a “free field.” “A sound field is said to be a free field if it is uniform, free from boundaries, and is undisturbed by other sources of sound. In practice, it is a field where the effects of the boundaries are negligible over the region of interest.” (From the GenRad instruction manual for their precision microphones.)
“Free from boundaries” is the catch phrase here. Anyone who has designed a sound system into a football stadium, a replica of a Greek theater, or a major motor racing course knows first-hand the primary influence of a boundary.
- Inverse-square-law level change.
- Excess attenuation by frequency because of humidity and related factors.
Other factors that can materially affect sound outdoors include:
- Reflection by and diffraction around solid-objects.
- Refraction and shadow formation by wind and temperature and wind variations.
- Reflection and absorption by the ground surface itself.
Research in recent years has advanced the knowledge of atmospheric absorption significantly from the original base laid by Kneser, Knudsen, followed later by Harris, and, more recently, by the work of Sutherland, Piercy, Bass, and Evans (see Figure 3.1). This prediction graph is felt to be reliable within +5% for the temperature indicated (20°C) and 10% over a range of 0 to 40°C.
Figure 3.1. Predicted atmospheric absorption in dB/100 m for a pressure of 1 atm, temperature of 20°C, and various values of relative humidity.

The June 1977 Journal of the Acoustical Society of America had an exceptional tutorial paper entitled “Review of Noise Propagation in the Atmosphere,” pages 1403–1418, and included a 96 reference bibliography.
3.2. Inverse Square Law
The geometrical spreading of sound from a coherent source (inverse square law rate of level change), which is a change in level of 6 dB for each doubling of distance for a spherical expansion from a point source, is well known to most sound technicians.(3.1)
![]() where Dr is the reference distance and Dm is the measured distance.
where Dr is the reference distance and Dm is the measured distance.
Not as well recognized is the change in level of 3 dB per doubling of distance for cylindrical expansion from an infinite line source. The ambient noise from a motor race track with the field of cars evenly spread during the early stages of a race can come very close to being effectively an infinite line source.(3.2)
![]()
Finally, there is the case of the parallel “loss free” propagation from an infinite area source—the crowd noise viewed from the center of the audience.
Descriptions of the spreading out of sound for coherent sources remain true for incoherent sources as well. The size of the near field may be more restricted and the propagation less directional but the general rate of level change remains the same. Note that this “spreading out” of sound does not constitute absorption or other loss but merely the reduction of power per unit of area as the distance is increased. Unfortunately, other processes also are going on.
3.3. Atmospheric Absorption
These other processes represent actual dissipation of sound energy. Energy is lost due to the combined action of the viscosity and heat conduction of the air and relaxation of behavior in the rotational energy states of the molecules of the air. These losses are independent of the humidity of the air. Additional losses are due to a relaxation of behavior in the vibrational states of the oxygen molecules in the air, as this behavior is strongly dependent on the presence of water molecules in the air (absolute humidity). Both of these energy loss effects cause increased attenuation with increased frequency (Figure 3.2).
Figure 3.2. Absorption of sound for different frequencies and values of relative humidity.

This frequency-discriminative attenuation is referred to as excess attenuation and must be added to the level change due to divergence of the sound wave. Total level change is the sum of inverse-square-law level change and excess attenuation. Figure 3.3 shows the excess attenuation difference between 1000 and 10,000 Hz at various distances.
Figure 3.3. Excess attenuation for different frequencies and distances from the source.

3.4. Velocity of Sound
For a given frequency, the relation of the wavelength to the velocity of sound in the medium is(3.3)
 where λ is the wavelength in feet or meters, c is the velocity of sound in ft/s or m/s, and f is the frequency in Hz.
In dealing with many acoustic interactions, the wavelength involved is significant and the ability to calculate it is important. Therefore we need to be able to both calculate and measure the velocity of sound quickly and accurately.
The velocity of sound varies with temperature to a degree sufficient to require our alertness to it. A knowledge of the exact velocity of sound when using signal-delayed signal analysis allows very precise distance measurements to be made by observing the frequency interval between comb filters from two sources and then converting from frequency to time and finally to distance.
The velocity of sound under conditions likely to be encountered in connection with architectural acoustic considerations is dependent on three fundamental factors. These are:(3.4)
![]() where c is the velocity of sound in m/s.
where c is the velocity of sound in m/s.
- γ is the ratio of specific heats and is 1.402 for diatomic molecules (air molecules).
- PS is the equilibrium gas pressure in Newtons per square meter (1.013×10⁵ N/m2).
- ρ is the density of air in kilograms per cubic meter (kg/m3).
The density of air varies with temperature, and an examination of the basic equations reveals that, indeed, temperature variations are the predominant influence on the velocity of sound in air.
The equation for calculating the density of air is(3.5)
![]()
where density of air is in kg/m3; H is the barometric pressure in centimeters of mercury, Hg; °C is the temperature in degrees Celsius; 9/5 (°C)+32=°F; and 5/9 (°F) – 32=°C. Hg in inches times 2.54 equals Hg in centimeters.
3.4.1. Example
If we were to measure a temperature of 72°F and a barometric pressure of 29.92 in cm Hg, we would first calculate the density of the air according to data gathered:
![]()
![]()
Having made the metric conversions and obtained the density figure, we can then use the basic equation for velocity(3.6)
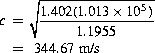
Since we started with the dimensions commonly used here in the United States, we then convert back to them by
![]()
Typical velocities in other media are shown in Table 3.1.
Table 3.1. Typical Sound Velocities in Various Media (at Approximately 15°C)
| Velocity | ||
|---|---|---|
| Media | m/s | ft/s |
| Air | 341 | 1119 |
| Water (pure) | 1440 | 4724 |
| Water (sea) | 1500 | 4921 |
| Oxygen | 317 | 1040 |
| Ice | 3200 | 10,499 |
| Marble | 3800 | 12,467 |
| Glass (soft) | 5000 | 16,404 |
| Glass (hard) | 6000 | 19,685 |
| Cast iron | 3400 | 11,155 |
| Steel | 5050 | 16,568 |
| Lead | 1200 | 3937 |
| Copper | 3500 | 11,483 |
| Beryllium | 8400 | 27,559 |
| Aluminum | 5200 | 17,060 |
3.5. Temperature-Dependent Velocity
The velocity of sound is temperature dependent. The approximate formula for calculating velocity is(3.7)
![]() where c is the velocity in feet per second (ft/s) and °F is the temperature in degrees Fahrenheit.
where c is the velocity in feet per second (ft/s) and °F is the temperature in degrees Fahrenheit.
For Celsius temperatures:(3.8)
![]() where c is the velocity in meters per second (m/s) and °C is the temperature in degrees Celsius.
where c is the velocity in meters per second (m/s) and °C is the temperature in degrees Celsius.
Therefore at a normal room temperature of 72.5°F, we can calculate:
![]()
3.6. The Effect of Altitude on the Velocity of Sound in Air
The theoretical expression for the speed of sound, c, in an ideal gas (air, for example) is(3.9)
![]() where c is the velocity in m/s, P is the ambient pressure, ρ is the gas density, and γ is the ratio of the specific heat of the gas at a constant pressure
to its heat at constant volume.
where c is the velocity in m/s, P is the ambient pressure, ρ is the gas density, and γ is the ratio of the specific heat of the gas at a constant pressure
to its heat at constant volume.
![]() where P is the ambient pressure, V is the volume, R is the gas constant, and T is the absolute temperature.
where P is the ambient pressure, V is the volume, R is the gas constant, and T is the absolute temperature.
Considering the definition of density (ρ), our first equation can be rewritten as(3.11)
![]() where M is the molecular weight of the gas.
where M is the molecular weight of the gas.
It can be seen that the velocity is dependent only on the type of gas and the temperature and is independent of changes in pressure. This is true because both P and ρ decrease with increasing altitude and the net effect is that atmospheric pressure has only a very slight effect on sound velocity. Therefore the speed of sound at the top of a mountain would be the same as at the bottom of the mountain if the temperature is the same at both locations.
3.7. Typical Wavelengths
Some typical wavelengths for midfrequency octave centers are shown in Table 3.2.
Table 3.2. Typical Wavelengths for Midfrequency Octave Centers
| Frequency (Hz) | Wavelength (ft) |
|---|---|
| 250 | 4.52 |
| 500 | 2.26 |
| 1000 | 1.13 |
| 2000 | 0.57 |
| 4000 | 0.28 |
| 8000 | 0.14 |
| 16,000 | 0.07 |
Now suppose the temperature increases 20°F to 92.5°F.
![]()
The table of frequencies and wavelengths is shown in Table 3.3.
Table 3.3. Frequencies and Wavelengths
| Frequency (Hz) | Wavelength (ft) |
|---|---|
| 250 | 4.60 |
| 500 | 2.30 |
| 1000 | 1.15 |
| 2000 | 0.58 |
| 4000 | 0.29 |
| 8000 | 0.14 |
| 16,000 | 0.07 |
Suppose we had “tuned” to the peak of a 1000-Hz standing wave in a room first at 72.5°F and then later at 92.5°F. The apparent frequency shift would be
![]() where 1151 is the velocity (ft/s) at the temperature of measurement and 1.13 is the wavelength at the original temperature.
where 1151 is the velocity (ft/s) at the temperature of measurement and 1.13 is the wavelength at the original temperature.
3.8. Doppler Effect
We have all experienced the Doppler effect—hearing the pitch change from a higher frequency to a lower frequency as a train whistle or a car horn comes toward a stationary listener and then recedes into the distance. The frequency heard by the listener due to the velocity of the source, the listener, or some combination of both is found by(3.12)
![]() where FL is the frequency heard by the listener (observer in Hz), FS is the frequency of the sound source in Hz, c is the velocity of sound in ft/s, VL is the velocity of the listener in ft/s, and VS is the velocity of the sound source in ft/s.
where FL is the frequency heard by the listener (observer in Hz), FS is the frequency of the sound source in Hz, c is the velocity of sound in ft/s, VL is the velocity of the listener in ft/s, and VS is the velocity of the sound source in ft/s.
Use minus (−) if VS in the denominator is coming toward the listener. If the listener, VL, in the numerator is moving away from the source, use minus (−), and for the listener moving toward the source, use plus (+).
Example
Assume c=1130 ft/s, VL=0, VS=60 mi/h (approaching listener), and FS=1000 Hz
![]()
As the sound source passes the listener and recedes, the pitch swings from 1084 Hz to
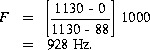
This rapid sweep of 156 Hz is called the Doppler effect. A very large excursion low-frequency driver can exhibit Doppler distortion of its signal. Moving vanes in reverberation chambers can produce Doppler effects in the reflected signals that can cause unexpected difficulties in modern spectrum analyzers.
3.9. Reflection and Refraction
Sound can be reflected by hitting an object larger than one-quarter wavelength of the sound. When the object is one-quarter wavelength or slightly smaller, it also causes diffraction of the sound (bending around the object). Refraction occurs when the sound passes from one medium to another (from air to glass to air, for example, or when it passes through layers of air having different temperatures). The velocity of sound increases with increasing temperature. Therefore sound emitted from a source located on the frozen surface of a large lake on a sunny day will encounter warmer temperatures as the wave diverges upward, causing the upper part of the wave to travel faster than the part of the wave near the surface. This causes a lens-like action to occur, which bends the sound back down toward the surface of the lake (Figure 3.4).
Figure 3.4. Effect of temperature differences between the ground and the air on the propagation of sound.

Sound will travel great distances over frozen surfaces on a quiet day. Wind blowing against a sound source causes temperature gradients near the ground surface that result in the sound being refracted upward. Wind blowing in the same direction as the sound produces temperature gradients along the ground surface that tend to refract the sound downward. We hear it said, “The wind blew the sound away.” That is not so; it refracted away. Even a 50-mph wind (and that's a strong wind) cannot blow away something traveling 1130 ft/s:
![]() 770.45 mi/h is the velocity of sound at sea level at 72.5°F.
770.45 mi/h is the velocity of sound at sea level at 72.5°F.
Wind velocities that vary with elevation can also cause “bending” of the sound velocity plus or minus the wind velocity at each elevation.
Reflections from large boundaries, when delayed in time relative to the direct sound, can be highly destructive of speech intelligibility. It is important to remember, however, that a reflection within a nondestructive time interval can be extremely useful. Reflections that are at or near (within 10 dB) equal amplitude and that are delayed more than 50 ms require careful attention on the part of a sound system designer. Figure 3.5 shows how to calculate probable levels from a reflection. Figure 3.6 shows other influences. Calculation of the time interval is found by:(3.13)
![]() where c is the velocity of sound in ft/s or m/s, DR is the distance in feet or meters traveled by the reflection, and DD is the distance the direct sound traveled in feet or meters.
where c is the velocity of sound in ft/s or m/s, DR is the distance in feet or meters traveled by the reflection, and DD is the distance the direct sound traveled in feet or meters.
Figure 3.5. Calculating relative levels of reflections.

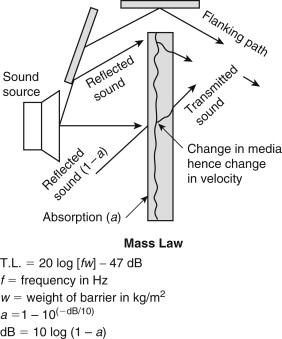
Figure 3.6. Absorption, reflection, and transmission of boundary surface areas.
A large motor speedway used to make very effective use of ground reflections on the coverage of the grandstands behind the pit area. The very high temperature gradients encountered warp the sound upward during the hot part of the day and in the cool of the morning, the ground reflection helps with the coverage of the near seating area. The directional devices are aimed straight ahead along the ground rather than up at an angle, and when the temperature gradient “bends” the sound upward, it's still covering the audience area effectively (Figure 3.4).
One caution about using ground reflections in northern climes is that a heavy snowfall can provide unbelievable attenuation, as the authors can attest after trying to demonstrate, years ago, a high-level sound system the day after a blizzard in Minnesota.
3.10. Effect of a Space Heater on Flutter Echo
The velocity of sound increases with an increase in temperature; therefore, the effect of an increase in temperature with an increase in height is a downward bending of the sound path. This illustrates why feedback modes change as air conditioners, heating, or crowds dramatically change the temperature of a room (Figure 3.7).
Figure 3.7. Effect of thermal gradients in a room.

3.11. Absorption
Absorption is the inverse of reflection. When sound strikes a large surface, part of it is reflected and part of it is absorbed. For a given material, the absorption coefficient (a) is(3.14)
![]() where EA is the absorbed acoustic energy, EI is the total incident acoustic energy (i.e., the total sound), and (1−a) is the reflected sound.
where EA is the absorbed acoustic energy, EI is the total incident acoustic energy (i.e., the total sound), and (1−a) is the reflected sound.
This theoretically makes the absorption coefficient some value between 0 and 1. For a=0, no sound is absorbed; it is all reflected. If a material has an a of 0.25, it will absorb 25% of all sound energy having the same frequency as the absorption coefficient rating, and it will reflect 75% of the sound energy having that frequency.
Example
An anechoic room absorbs 99% of the energy received from the sound source. What percentage of the LP from the source is reflected? Assume 10 W of total energy output from the source. Then the chamber absorbs 9.9 W of it.
Box 3.1 Definitions in Acoustics
Sound Energy Density—is the sound per unit volume measured in joules per cubic meter.
Sound Energy Flux—is the average rate of flow of sound energy through any specified area. The unit is joules per second (joules per second are called watts).
The Sound Intensity (or sound energy flux density)—in a specified direction at a point is the sound energy transmitted per second in the specified direction through unit area normal to this direction at the point. The unit is watts per square meter.
Sound Pressure—is exerted by sound waves on any surface area. It is measured in Newtons per square meter (now called pascals). The sound pressure is proportional to the square root of the sound density.
The Sound Pressure Level (in decibels of a sound)—20 times the logarithm to the base 10 of the ratio of the pressure of this sound to the reference pressure. Unless otherwise specified, the reference pressure is understood to be 0.00002 N/m2 (20 micropascals or 20 μPa).
The Velocity Level (in decibels of a sound)—20 times the logarithm to the base 10 of the ratio of the particle velocity of the sound to the reference particle velocity. Unless otherwise specified, the reference particle velocity is understood to be 50×10−9 meters per second (m/s).
The Intensity Level (in decibels of a sound)—10 times the logarithm to the base 10 of the ratio of the intensity of this sound to the reference intensity. Unless otherwise specified, the reference intensity is 10−12 watts per square meter (W/m2).
![]()
Therefore the LP drops by 20 dB also
![]()
In other words, 10% of the LP returns as a reflection. If the sound source had directed an LP of a 100-dB signal at the wall of the chamber, a signal of 80 dB would be reflected back. Remembering how dB are combined, we can see that this reflection will not change the 100-dB reading of the direct sound by a discernible amount on any normal sound level meter.
The desirability of a reflective surface can be seen when it is realized that the direct sound and the reflected sound from a single surface can combine to be as much as 3 dB higher than the direct sound alone. If the loudspeakers are directed to reflect off the ground during the cool early morning hours, then when the refraction effect of the sun on the hard surfaces causes the sound to bend upward during the hot part of the day, the sound bends up into the grandstand area. Most of the time, the reflected sound is assisting the direct sound, thereby saving audio power.
3.12. Classifying Sound Fields
3.12.1. Free Fields
A sound field is said to be a free field if it is uniform, free of boundaries, and is undisturbed by other sources of sound. In practice, it is a field in which the effects of the boundaries are negligible over the region of interest. The flow of sound energy is in one direction only. Anechoic chambers and well-above-the-ground outdoors are free fields. The direct sound level from a sound source in a free field is labeled LD.
3.12.2. Diffuse (Reverberant) Fields
A diffuse or reverberant sound field is one in which the time average of the mean square sound pressure is the same everywhere and the flow of energy in all directions is equally probable. This requires an enclosed space with essentially no acoustic absorption. The reverberant sound level is labeled LR.
3.12.3. Semireverberant Fields
A semireverberant field is one in which sound energy is both reflected and absorbed. The flow of energy is in more than one direction. Much of the energy is truly from a diffused field; however, there are components of the field that have a definable direction of propagation from the noise source. The semireverberant field is the one encountered in the majority of architectural acoustic environments. The early reflections, that is, under 50 ms after LD, are labeled LRE.
3.12.4. Pressure Fields
A pressure field is one in which the instantaneous pressure is uniform everywhere. There is no direction of propagation. The pressure field exists primarily in cavities, commonly called couplers, where the maximum dimension of the cavity is less than one-sixth of the wavelength of the sound. Because of ease of repeatability, this type of measurement is used by the National Bureau of Standards when they calibrate microphones. At low frequencies the pressure field can be large, that is, big enough for a listener to sit in.
3.12.5. Ambient Noise Field
The ambient noise field is composed of those sound sources not contributing to the desired LD (i.e., active sources). The ambient noise level is labeled LN.
3.12.6. Outdoor Acoustics
If, for example, the ambient noise level measured 70 dBA (not an unreasonable reading outdoors) and the most SPL you could generate at 4 ft was 110 dB LP, how far could you reach before your signal was submerged in noise?

The problem actually is more complicated than this outdoors, but this serves as an illustration of how to begin.
We have now touched on the most important basics of the acoustics environment outdoors. Before going indoors, let us apply some of this knowledge to a series of ancient outdoor problems. A simple rule of thumb dictates that when a change of +10 dB occurs, the higher level will be subjectively judged as approximately twice as loud as the level 10 dB below it. While the computation of loudness is more complex than this, the rule is useful for midrange sounds. Using such a rule, we could examine a sound source radiating hemispherically due to the presence of the surface of the earth. Figure 3.8 shows sound in an open field with no wind. The sound at 100 ft is one-half as loud as that at 30 ft, although the amplitude of the vibration of the air particles is roughly one-third. Similarly, the sound at 30 ft is one-half as loud as the sound at 10 ft. Because the sound is outdoors, atmospheric effects, ambient noise, and so on cause difficulty for the talker and listener. The ancients learned to place a back wall behind the talker, and many Native American council sites were at the foot of a stone cliff so that the talker could address more of the tribe at one time. Figure 3.9 illustrates how a reflecting structure can double the loudness as compared to totally open space. The weather and some noise still interfere with listening.
Figure 3.8. Sound in an open field with no wind.

Figure 3.9. Sound from an orchestra enclosure in an open field with no wind.

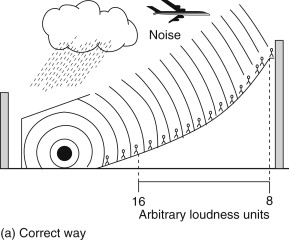
Figure 3.10 illustrates the absorptive effect of an audience on the sound traveling to the farthest listener. Figure 3.11 shows the right way and the wrong way to arrange a sound source on a hill. In Figure 3.11(a), the loudness of the sound at the rear of the audience is enhanced by sloping the seating upward. In addition, the noise from sources on the ground is reduced. Figure 3.11(b) is a poor way to listen outdoors.
Figure 3.10. Sound from an orchestra enclosure with an audience.

Figure 3.11. Sound sources and audiences on a hill.

While the Bible doesn't say which way Jesus addressed the multitudes, we can deduce from the acoustical clues present in the Bible text that the multitude arranged themselves above him because:
- He addressed groups as large as 5000. This required a very favorable position relative to the audience and a very low ambient noise level.
- Upon departing from such sessions, he could often step into a boat in the lake, suggesting that he was at the bottom of a hill or mountain.
We can further surmise that the reason Jesus led these multitudes into the countryside was to avoid the higher noise levels present even in small country villages.
The Greeks built their amphitheaters to take advantage of these acoustical facts:
- They provided a back reflector for the performer.
- They increased the talker's acoustic output by building megaphones into the special face masks they held in front of their faces to portray various emotions.
- They sloped the audiences upward and around the talker at an included angle of approximately 120°, realizing, as many modern designers do not seem to, that humans do not talk out of the back of their heads.
- They defocused the reflective “slapback” by changing the radius at the edges of the seating area.
Because there were no aircraft, cars, motorcycles, air conditioners, and so on, the ambient noise levels were relatively low, and large audiences were able to enjoy the performances. They had discovered absorption and used jars partially filled with ashes (as tuned Helmholtz resonators) to reduce the return echo of the curved stepped seats back to the performers. It remained only for some unnamed innovative genius to provide walls and a roof to have the first auditorium, “a place to hear” (Figure 3.12). No enhancement of sound is provided in Figure 3.12 because there is no reverberation in a room whose walls are highly sound absorbent.
Figure 3.12. Means of eliminating noise and weather while preserving outdoor conditions.

Sometimes acoustic progress was backward. For example, the Romans, when adopting Christianity, took over the ancient echo-ridden pagan temples and had to convert the spoken service into a chanted or sung service pitched to the predominant room modes of these large, hard structures. Today, churches still often have serious acoustical shortcomings and require a very carefully designed sound system in order to allow the normally spoken word to be understood.
It is also of real interest to note that in large halls and arenas the correct place for the loudspeaker system is most often where the roof should have gone if the building had been designed specifically for hearing. A loudspeaker is therefore usually an electroacoustic replacement for a natural reflecting surface that has not been provided.
3.13. The Acoustic Environment Indoors
The moment we enclose the sound source, we greatly complicate the transmission of its output. We have considered one extreme when we put the sound source in a well-elevated position and observed the sound being totally absorbed by the “space” around it. Now, let us go to the opposite extreme and imagine an enclosed space that is completely reflective. The sound source would put out sound energy, and none of it would be absorbed. If we continued to put energy into the enclosure long enough, we could theoretically arrive at a pressure that would be explosive. Human speech power is quite small. It has been stated by Harvey Fletcher in his book Speech and Hearing in Communication that it would take “…500 people talking continuously for one year to produce enough energy to heat a cup of tea.” Measured at 39.37 in (3.28 ft), a typical male talker generates 67.2 dB-SPL, or 34 μW of power, and a typical female talker generates 64.2 dB-SPL, or 18 μW. From a shout at this distance (3.28 ft) to a whisper, the dB LP ranges from 86 to 26 dB, or a dynamic range of about 60 dB. Not only does the produced sound energy tend to remain in the enclosure (dying out slowly), but it tends to travel about in the process.
Let us now examine the essential parameters of a typical room to see what does happen. First, an enclosed space has an internal volume (V), usually measured in cubic feet. Second, it has a total boundary surface area (S), measured in square feet (floor, ceiling, two side walls, and two end walls). Next, each of the many individual surface areas has an absorption coefficient. The average absorption coefficient (a) for all the surfaces together is found by(3.15)
![]() where s1,2,...n are the individual boundary surface areas in square feet,
where s1,2,...n are the individual boundary surface areas in square feet,
![]() are the individual absorption coefficients of the individual boundary surface areas, and S is the total boundary surface area in square feet.
are the individual absorption coefficients of the individual boundary surface areas, and S is the total boundary surface area in square feet.
![]()
Table 3.4 gives typical absorption coefficients for common materials. These coefficients are used to calculate the absorption of boundary surfaces (walls, floors, ceilings, etc.).
Table 3.4. Sound Absorption Coefficients of General Building Materials and Furnishings
| Materials | Coefficient | |||||
|---|---|---|---|---|---|---|
| 125 Hz | 250 Hz | 500 Hz | 1 kHz | 2 kHz | 4 kHz | |
| Acoustical plaster (“Zonolite”) | ||||||
| 1/2-in.-thick trowel application | 0.31 | 0.32 | 0.52 | 0.81 | 0.88 | 0.84 |
| 1-in.-thick trowel application | 0.25 | 0.45 | 0.78 | 0.92 | 0.89 | 0.87 |
| Acoustile, surface glazed and perforated structural clay tile, perforate surface backed with 4-in. glass fiber blanket of 1 lb/ft2 density | 0.26 | 0.57 | 0.63 | 0.96 | 0.44 | 0.56 |
| Air (Sabins per 1000 ft3) | 2.3 | 7.2 | ||||
| Brick, unglazed | 0.03 | 0.03 | 0.03 | 0.04 | 0.05 | 0.07 |
| Brick, unglazed, painted | 0.01 | 0.01 | 0.02 | 0.02 | 0.02 | 0.03 |
| Carpet, heavy | ||||||
| On concrete | 0.02 | 0.06 | 0.14 | 0.37 | 0.60 | 0.65 |
| On 40-oz hairfelt or foam rubber with impermeable latex backing | 0.08 | 0.24 | 0.57 | 0.69 | 0.71 | 0.73 |
| On 40-oz hairfelt or foam rubber | ||||||
| 40-oz hairfelt or foam rubber | 0.08 | 0.27 | 0.39 | 0.34 | 0.48 | 0.63 |
| Concrete block | ||||||
| Coarse | 0.36 | 0.44 | 0.31 | 0.29 | 0.39 | 0.25 |
| Painted | 0.10 | 0.05 | 0.06 | 0.07 | 0.09 | 0.08 |
| Fabrics | ||||||
| Light velour, 10 oz/yd2, hung straight in contact with wall | 0.03 | 0.04 | 0.11 | 0.17 | 0.24 | 0.35 |
| Medium velour, 10 oz/yd2, draped to half area | 0.07 | 0.31 | 0.49 | 0.75 | 0.70 | 0.60 |
| Heavy velour, 18 oz/s yd2 draped to half area | 0.14 | 0.35 | 0.55 | 0.72 | 0.70 | 0.65 |
| Fiberboards, 1/2-in. normal soft, mounted against solid backing | ||||||
| Unpainted | 0.05 | 0.10 | 0.15 | 0.25 | 0.30 | 0.3 |
| Some painted | 0.05 | 0.10 | 0.10 | 0.10 | 0.10 | 0.15 |
| Fiberboards, 1/2-in. normal soft, mounted over 1-in. air space | ||||||
| Unpainted | 0.30 | 0.15 | 0.10 | |||
| Some painted | 0.30 | 0.15 | 0.10 | |||
| Fiberglass insulation blankets | ||||||
| AF100, 1 in., mounting #4 | 0.07 | 0.23 | 0.42 | 0.77 | 0.73 | 0.70 |
| AF100, 2 in., mounting #4 | 0.19 | 0.51 | 0.79 | 0.92 | 0.82 | 0.78 |
| AF530, 1 in., mounting #4 | 0.09 | 0.25 | 0.60 | 0.81 | 0.75 | 0.74 |
| AF530, 2 in., mounting #4 | 0.20 | 0.56 | 0.89 | 0.93 | 0.84 | 0.80 |
| AF530, 4 in., mounting #4 | 0.39 | 0.91 | 0.99 | 0.98 | 0.93 | 0.88 |
| Flexboard,3/16-in.unperforatedcement asbestos board mounted over 2-in. air space | 0.18 | 0.11 | 0.09 | 0.07 | 0.03 | 0.03 |
| Floors | ||||||
| Concrete or terrazzo | 0.01 | 0.01 | 0.015 | 0.02 | 0.02 | 0.02 |
| Linoleum, asphalt, rubber, or cork tile on concrete | 0.02 | 0.03 | 0.03 | 0.03 | 0.03 | 0.02 |
| Wood | 0.15 | 0.11 | 0.10 | 0.07 | 0.06 | 0.07 |
| Wood parquet in asphalt on concrete | 0.04 | 0.04 | 0.07 | 0.06 | 0.06 | 0.07 |
| Geoacoustic, 13 1/2 in.×13 1/2 in., 2-in.-thick cellular glass tile installed | 0.13 | 0.74 | 2.35 | 2.53 | 2.03 | 1.73 |
| Glass | ||||||
| Large panes of heavy plate glass | 0.18 | 0.06 | 0.04 | 0.03 | 0.02 | 0.02 |
| Ordinary window glass | 0.35 | 0.25 | 0.18 | 0.12 | 0.07 | 0.04 |
| Gypsum board, 1/2 in. nailed to 2 in.×4 in., 16 in. o.c. | 0.29 | 0.10 | 0.05 | 0.04 | 0.07 | 0.09 |
| Hardboard panel, 1/8 in., 1 lb/ft 2 with bituminous roofing felt stuck to back, mounted over 2-in. air space | 0.90 | 0.45 | 0.25 | 0.15 | 0.10 | 0.10 |
| Marble or glazed tile | 0.01 | 0.01 | 0.01 | 0.01 | 0.02 | 0.02 |
| Masonite, 1/2 in., mounted over 1-in. air space | 0.12 | 0.28 | 0.19 | 0.18 | 0.19 | 0.15 |
| Mineral or glass wool blanket, 1 in., 5–15 lb/ft 2 density mounted against solid backing | 0.15 | 0.35 | 0.70 | 0.85 | 0.90 | 0.90 |
| Covered with 5% perforated hardboard | 0.10 | 0.35 | 0.85 | 0.85 | 0.35 | 0.15 |
| Covered with 10% perforated or 20% slotted hardboard | 0.15 | 0.30 | 0.75 | 0.85 | 0.75 | 0.40 |
| Mineral or glass wool blanket, 2 in., 5–15 lb/ft 2 density mounted over 1-in. air space | ||||||
| Covered with open weave fabric | 0.35 | 0.70 | 0.90 | 0.90 | 0.95 | 0.90 |
| Covered with 10% perforated or 20% slotted hardboard | 0.40 | 0.80 | 0.90 | 0.85 | 0.75 | |
| Openings | ||||||
| Stage, depending on furnishings | 0.25–0.75 | |||||
| Deep balcony, upholstered seats | 0.50–1.00 | |||||
| Grills, ventilating | 0.15–0.50 | |||||
| Plaster, gypsum or lime | ||||||
| Smooth finish, on tile or brick | 0.013 | 0.015 | 0.02 | 0.03 | 0.04 | 0.05 |
| Rough finish on lath | 0.02 | 0.03 | 0.04 | 0.05 | 0.04 | 0.03 |
| Smooth finish on lath | 0.02 | 0.02 | 0.03 | 0.04 | 0.04 | 0.03 |
| Plywood panels | ||||||
| 2 in., glued to 2 1/2 -in. thick plaster wall on metal lath | 0.05 | 0.05 | 0.02 | |||
| 1/4 in., mounted over 3-in. air space, with 1-in. glassfiber batts right behind the panel | 0.60 | 0.30 | 0.10 | 0.09 | 0.09 | 0.09 |
| 3/8 in. | 0.28 | 0.22 | 0.17 | 0.09 | 0.10 | 0.11 |
| Rockwool blanket, 2-in. thick batt | ||||||
| (Semi-Thik) | ||||||
| Mounted against solid backing | 0.34 | 0.52 | 0.94 | 0.83 | 0.81 | 0.69 |
| Mounted over 1-in. air space | 0.36 | 0.62 | 0.99 | 0.92 | 0.92 | 0.86 |
| Mounted over 2-in. air space | 0.31 | 0.70 | 0.99 | 0.98 | 0.92 | 0.84 |
| Rockwoolblanket,2-in.-thickbatt (Semi-Thik), covered with 3/16 in.-thick perforated cement-asbestos board (Transite), 11% open area | ||||||
| Mounted against solid backing | 0.23 | 0.53 | 0.99 | 0.91 | 0.62 | 0.84 |
| Mounted over 1-in. air space | 0.39 | 0.77 | 0.99 | 0.83 | 0.58 | 0.50 |
| Mounted over 2-in. air space | 0.39 | 0.67 | 0.99 | 0.92 | 0.58 | 0.48 |
| Rockwall blanket, 4-in.-thick batt (Full-Thik) | ||||||
| Mounted against solid backing | 0.28 | 0.59 | 0.88 | 0.88 | 0.88 | 0.72 |
| Mounted over 1-in. air space | 0.41 | 0.81 | 0.99 | 0.99 | 0.92 | 0.83 |
| Mounted over 2-in. air space | 0.52 | 0.89 | 0.99 | 0.98 | 0.94 | 0.86 |
| Rockwool blanket, 4-in.-thick batt (Full-Thik), covered with 3/16-in.-thick perforated cement–asbestos board (Transite), 11% open area | ||||||
| Mounted against solid backing | 0.50 | 0.88 | 0.99 | 0.75 | 0.56 | 0.45 |
| Mounted over 1-in. air space | 0.44 | 0.88 | 0.99 | 0.88 | 0.70 | 0.30 |
| Mounted over 2-in. air space | 0.62 | 0.89 | 0.99 | 0.92 | 0.70 | 0.58 |
| Roofing felt, bituminous, two layers, 0.8 lb/ft2, mounted over 10-in. air space | 0.50 | 0.30 | 0.20 | 0.10 | 0.10 | 0.10 |
| Spincoustic blanket | ||||||
| 1 in., mounted against solid backing | 0.13 | 0.38 | 0.79 | 0.92 | 0.83 | 0.76 |
| 2 in., mounted against solid backing | 0.45 | 0.77 | 0.99 | 0.99 | 0.91 | 0.78 |
| Spincoustic blanket, 2 in., covered with 3/16-in. perforated cement–asbestos board (Transite), 11% open area | 0.25 | 0.80 | 0.99 | 0.93 | 0.72 | 0.58 |
| Sprayed “Limpet” asbestos | ||||||
| ¾ in., 1 coat, unpainted on solid backing | 0.08 | 0.19 | 0.70 | 0.89 | 0.95 | 0.85 |
| 1 in., 1coat, unpainted on solid backing | 0.30 | 0.42 | 0.74 | 0.96 | 0.95 | 0.96 |
| ¾ in.,1 coat, unpainted on metal lath | 0.41 | 0.88 | 0.90 | 0.88 | 0.91 | 0.81 |
| Transite, 3/16-in. perforated, cement–asbestos board, 11% open area | ||||||
| Mounted against solid backing | 0.01 | 0.02 | 0.02 | 0.05 | 0.03 | 0.08 |
| Mounted over 1 in. air space | 0.02 | 0.05 | 0.06 | 0.16 | 0.19 | 0.12 |
| Mounted over 2 in. air space | 0.02 | 0.03 | 0.12 | 0.27 | 0.06 | 0.09 |
| Mounted over 4 in. air space | 0.02 | 0.05 | 0.17 | 0.17 | 0.11 | 0.17 |
| Paper-backed board, mounted over 4-in. air space | 0.34 | 0.57 | 0.77 | 0.79 | 0.43 | 0.45 |
| Water surface, as in a swimming pool | 0.008 | 0.008 | 0.013 | 0.015 | 0.02 | 0.025 |
| Wood paneling, 3/8 in. to 1/2 in. thick, mounted over 2-in. to 4-in. air space | 0.30 | 0.25 | 0.20 | 0.17 | 0.15 | 0.10 |
Table 3.5 gives typical absorption units in sabins rather than percentage figures. Sabins are either in per-unit figures or in units per length.
Table 3.5. Absorption of Seats and Audiencea
| Materials | 125 Hz | 250 Hz | 500 Hz | 1 kHz | 2 kHz | 4 kHz |
|---|---|---|---|---|---|---|
| Audience, seated, depending on spacing and upholstery of seats | 2.5–4.0 | 3.5–5.0 | 4.0–5.5 | 4.5–6.5 | 5.0–7.0 | 4.5–7.0 |
| Seats | ||||||
| Heavily upholstered with fabric | 1.5–3.5 | 3.5–4.5 | 4.0–5.0 | 4.0–5.5 | 3.5–5.5 | 3.5–4.5 |
| Heavily upholstered with leather, plastic, etc. | 2.5–3.5 | 3.0–4.5 | 3.0–4.0 | 2.0–4.0 | 1.5–4.0 | 1.0–3.0 |
| Lightly upholstered with leather, plastic, etc. | 1.5–2.0 | |||||
| Wood veneer, no upholstery | 0.15 | 0.20 | 0.25 | 0.30 | 0.50 | 0.50 |
| Wood pews | ||||||
| No cushions, per 18-in. length | 0.40 | |||||
| Cushioned, per 18-in. length | 1.8–2.3 |
a Values given are in sabins per person or unit of seating.
Finally, the room will possess a reverberation time, RT60. This is the time in seconds that it will take a steady-state sound, once its input power is terminated, to attenuate 60 dB. For the sake of illustration, assume a room with the following characteristics:
![]()
![]()
3.13.1. The Mean Free Path (MFP)
The mean free path is the average distance between reflections in a space. For our sample space:

If a sound is generated in the sample space, part of it will travel directly to a listener and undergo inverse-square-law level change on its way. Some more of it will arrive after having traveled first to some reflecting surface, and still more will finally arrive having undergone several successive reflections (each 47 ft apart on the average). Each of these signals will have had more attenuation at some frequencies than at others because of divergence, absorption, reflection, refraction, diffraction, etc.
We can look at this situation in a different manner. Each sound made will have traveled 4.5 s×1130 ft/s, or 5085 ft. Since the mean free path is 47 ft, then we can assume each sound underwent approximately 108 reflections in this sample space before becoming inaudible. The result is a lot different than hearing the sound just once.
3.13.2. Build-Up of the Reverberant Sound Field
Figure 3.13 shows the paths of direct sound and several reflected sound waves in a concert hall. Reflections also occur from balcony faces, rear wall, niches, and any other reflecting surfaces. We can obtain a chart such as that shown in Figure 3.14 if we plot the amplitude of a short-duration signal vertically and the time interval horizontally. This diagram shows that at listener's ears, the sound that travels directly from the performer arrives first, and after a gap, reflections from the walls, ceiling, stage enclosure, and other reflecting surfaces arrive in rapid succession. The height of a bar suggests the loudness of the sound. This kind of diagram is called a reflection pattern. The initial-signal-delay gap can be measured from it.
Figure 3.13. Sound paths in a concert hall.
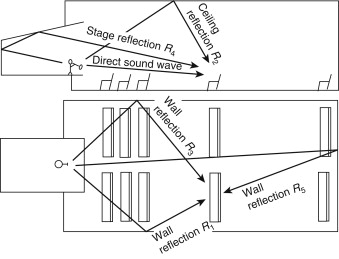
Figure 3.14. Time relationship of direct and reflected sounds.
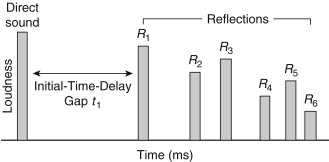
Figure 3.14 illustrates the decay of the reverberant field. Here the direct sound enters at the left of the diagram. The initial-signal-delay gap is followed by a succession of sound reflections. The reverberation time of the room is defined as the length of time required for the reverberant sound to decay 60 dB.
We will encounter the effects of delay versus attenuation again when we approach the calculation of articulation losses of consonants in speech.
Figure 3.15 shows measurements from an analyzer made in both large and small rooms. Figure 3.16 shows that the sound arriving at the listener has at least three distinct divisions:
- The direct sound level LD.
- The early reflections level LRE.
- The reverberant sound level LR.
Figure 3.15. Vivid proof that there is a fundamental difference between a small reverberant space and a large reverberant hall.

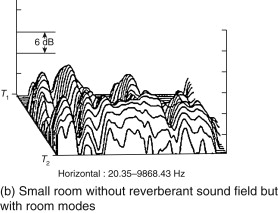


Figure 3.16. Comparison of direct, early, and reverberant sound fields in an auditorium (reflection adjusted for purposes of illustration).
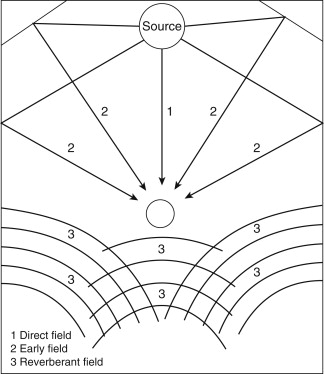
The direct sound, by definition, undergoes no reflections and follows inverse-square-law level change. The reverberant sound tends to remain at a constant level if the sound source continues to put energy into the room at a reasonably regular rate. This gives rise to a number of basic sound fields (Figure 3.17):
- The near field.
- The far free field.
- The far reverberant field.
Figure 3.17. Graphic representation of near field, free field, and reverberant field.

The near field does not behave predictably in terms of LP versus distance because the particle velocity is not necessarily in the direction of travel of the wave, and an appreciable tangential velocity component may exist at any point. This is why measurements are usually not made closer than twice the largest dimension of the sound source. In the far free field, the inverse-square-law level change prevails. In the far reverberant field, or diffuse field, the sound-energy density is very nearly uniform. Measuring low-frequency loudspeakers is an exception to the rule, and such measurements are often made in the pressure response zone of the device.
3.14. Conclusion
The study of acoustics for sound system engineers divides into outdoors and indoors with indoor acoustics again divided into large room acoustics and small room acoustics. Classical Sabinian acoustics are rapidly being refined where applicable, discarded where misapplied, and reexamined where the “fine structure of reverberation” is the meaningful parameter. The digital computer has fueled basic research into the mathematics of enclosed spaces, and modern analyzers have served to verify or deny the validity of the theories put forward.
Further Reading
Acoustical et al., Acoustical Materials Assoc., The use of architectural materials—theory and practice.
Davis and Davis, 1985 Davis D., Davis C., What reverberation is and what it is not Syn-Aud-Con Tech Topic 12 13 1985
Kinsler and Frey, 1962 Kinsler L.E., Frey A.R., Fundamentals of acoustics 2nd ed. 1962 Wiley New York
Knudsen and Harris, 1950 Knudsen V.O., Harris C.M., Acoustical designing in architecture 1950 Wiley New York
Kuttruff, 1973 Kuttruff H., Room acoustics 1973 Halstead Press New York
Lindsay, 1973 Lindsay B.R., Acoustics—historical and philosophical development 1973 Dowden, Hutchinson & Ross Stroudsburg, PA
MacKenzie, 1975 MacKenzie R., Auditorium acoustics 1975 Applied Science Publishers London
Olson, 1966 Olson H.F., Music, physics, and engineering 1966 Dover New York
Pierce, 1981 Pierce A.D., Acoustics: An introduction to its physical principles and applications 1981 McGraw-Hill New York
Pierce, 1983 Pierce J.R., The science of musical sound 1983 Scientific American Books New York
Rossing, 1982 Rossing T.D., The science of sound 1982 Addison-Wesley Reading, MA
Sabine, 1932 Sabine P.E., Acoustics and architecture 1932 McGraw-Hill New York
Sabine, 1922 Sabine W.C., Collected papers on acoustics 1922 Harvard Univ. Press Cambridge, MA
Sivian et al., 1959 May–June Sivian L.J., Dunn H.K., White S.D., Absolute amplitudes and spectra of certain musical instruments and orchestras IRE Trans. on Audio 1959 May–47-75
Strutt and Rayleigh, 1945 Strutt J.W., Rayleigh B., The theory of sound vols. I and II 2nd ed. 1945 Dover, New York