20
Changes in Land Use and Cropping Pattern
P. M. Thomas
20.1 Introduction
The total land area in India, which amounts to 297 million hectares, constitutes only about 2.3 per cent of the total world land area. However, the country has 158.7 million hectares of arable land, which amounts to 11.2 per cent of the total cultivable land in the entire world. Indian agriculture sector supports 579.8 million people, which comes to 22.2 per cent of the global agrarian population. Out of the 1287.2 million economically active people, in the world’s agricultural sector, 258.6 million (20.1 per cent) belong to India.1 Again, the country is one of the leading producers of important crops like rice, wheat, coarse cereals, pulses, vegetables, oilseeds, jute, sugar cane and tea.2 As a sector, which still contributes nearly 18 per cent of the Gross Domestic Product (GDP) of the country, and provides livelihood to 127.3 million people as cultivators and another 106.8 million people as agricultural labourers (as per Census 2001), the performance of the Indian agriculture sector with its linkages to other producing sectors is a crucial determinant of the overall development of the economy.
Even though the process of liberalization of the Indian economy had begun during the 1980s itself, the pace of liberalization picked up momentum in the country only after the introduction of the economic reforms during the early 1990s. The Agreement on Agriculture (AoA) of the WTO aimed to remove the trade barriers in international trade, and thereby enhance the market access of the agricultural products in a phased manner. The agreement restricted the Aggregate Measure of Support (AMS), given to the agricultural products, to 10 per cent in the developing countries. However, Indian farmers were least affected by this provision as the support they used to receive had been far below this stipulated limit. The economic reforms introduced in the country, in line with the WTO agreement, altered the incentive framework of the Indian agriculture and accelerated the private sector capital formation in this sector. Again, as a result of the liberalization of exchange rates and removal of trade restrictions, the terms of trade between the agricultural and non-agricultural sectors of the economy, tilted in favour of the former—since the beginning of the 1990s.
The basic purpose of the chapter, which is divided into two sections, is to examine the performance of the agricultural crop sector of the country, with a special reference to the changes in the land use and cropping pattern during the 1980s and the post-reforms period.3 A review of the overall performance of the Indian agriculture is given in the first section. The share of agricultural income in the State Domestic Product (SDP) of the country, the rate of capital formation in the agricultural sector, changes in the land use pattern, the cropping pattern changes as well as production and the yield of major crops are taken as the indicators of performance. Some of the major factors that determine the performance of this sector like rainfall and irrigation, the crop-wise coverage of quality seeds, the use of fertilizers and size of land holdings are discussed in the second section. If not specified otherwise, compound growth rates are used to assess the growth trends.
20.2 Review of Agricultural Performance
20.2.1 Share of Agricultural Production Sector in GDP
In India, at present, the primary sector of the economy contributes to nearly 22 per cent of the SDP at factor cost.4 During the period 1980–81 to 1989–90, the GDP of the country (at 1999–2000 prices) increased from 641.92 to 1029.18 thousand crores rupees showing an annual growth rate of 5.39 per cent, whereas the GDP from the primary sector increased from 256.34 to 353.04 thousand crores rupees, registering an annual growth rate of 3.62 per cent. The relatively lower growth rate in the GDP from the primary sector resulted in the decline of the share of this sector in the GDP of the economy from 39.93 to 34.30 per cent. The GDP of the country increased from 1083.57 to 2871.12 thousand crores rupees, during the period from 1990–91 to 2006–07 showing an annual growth rate of 6.28 per cent. However, the corresponding growth rate in the GDP from the primary sector was only 2.99 per cent and, as a result of it, the share of the primary sector in the GDP of the economy further declined to 20.60 per cent by the year 2006–07 (Table 20.1).
The agriculture sector (excluding forestry and fishing) accounts for more than 80 per cent of the SDP generated within the primary sector. During the period from 1993–94 to 1999–2000, GDP from agriculture (at 1993–94 prices) increased from 221.83 to 263.26 thousand crores rupees, registering an average annual growth rate of 2.89 per cent. Meanwhile, the total GDP of the economy had increased at a higher growth rate of 6.28 per cent per year.5 Again, from 1999–2000 to 2005–06, the GDP from agriculture showed an annual average growth rate of 2.24 per cent, while the growth rate in the GDP during this period amounted to 6.54 per cent. Due to the relatively lower annual growth rate, the percentage share of the agriculture sector in the total GDP declined from 22.9 to 17.9 during the period 1999–2000 to 2005–06, registering an annual negative growth rate of —4.02 per cent.
A period-wise analysis shows the average annual growth rate in the GDP at factor cost from agriculture during the 1980s (4.75 per cent), which had been substantially higher than that of the 1990s (3.21 per cent) and the later years (3.37 per cent). Again, the growth rates during the first halves of both the decades are also found to be relatively higher to those of the second halves. On an average, the GDP at factor cost in agriculture increased at the annual rate of 3.56 per cent during the period from 1980–81 to 2006–07, while the corresponding growth rate in the GDP from the primary sector is estimated as 3.28 per cent (Table 20.2).
TABLE 20.1 Gross Domestic Product from Primary Sector (1980–81 to 2006–07) (at 1999–2000 Prices) (Rs ′000 Crores)

Source: Government of India (GOI), Economic Survey, 2003–04, 2008–09.
TABLE 20.2 Annual Growth Rates in GDP at Factor Cost in Agriculture from 1980–81 to 2006–07

Source: Estimated from GOI, Directorate of Economics and Statistics (DES); Ministry of Agriculture, Agricultural Statistics at a Glance (Various Issues); Government of India (GOI), Economic Survey, 2008–09.
20.2.2 Capital Formation in Agriculture and Allied Sectors
Even though the absolute amount of capital formation in the agriculture and allied sectors in India had shown positive growth trends, the percentage share of this sector in the Gross Capital Formation (GCF) of the economy shows declining trends since the beginning of the 1980s. Another distinct feature to be noted in this regard is the incessant decrease in the proportion of the public sector capital formation, during the last two decades of the past century.
During the year 1980–81, the GCF in the agriculture sector of the country amounted to the Rs 14233 crores (at 1980–81 prices), and a major part of it (51.30 per cent) originated from the public sector. By the year 1990–91, the GCF originating from this sector increased to Rs 16416 crores, but the share of the public sector shrunk to 30.41 per cent and the combined contribution of both the private and public sectors to the total GCF of the economy declined to 9.9 per cent. Again, during the year 2000–01 the GCF in the agriculture and allied sectors increased to Rs 45480 crores (at 1999–2000 prices), which amounted only to 9.7 per cent of the total GCF of the country, and the contribution of public sector further declined to 17.77 per cent. However, by the year 2006–07, the GCF from the primary sector increased to Rs 71208 crores and the contribution of the public sector increased to 26.28 per cent. The annual growth rate in GCF of the economy during the period from 1980–81 to 1989–90 is estimated as 6.28 per cent, whereas the corresponding growth rate in the GCF originated from the agriculture and allied sectors is found to be negative. The growth rate of the GCF from the primary sector has shown a positive growth trend since the beginning of the 1990s, and its pace increased substantially from the early years of the present century (Table 20.3).
TABLE 20.3 Gross Capital Formation in Agriculture and Allied Sectors During 1980–81 to 2006–07 (Rupees in Crore)

Source: Estimated from GOI, Directorate of Economics and Statistics (DES); Ministry of Agriculture, Agricultural Statistics at a Glance (Various Issues); Government of India (GOI), Economic Survey, 2008–09.
20.2.3 Land Use Pattern
India is the seventh largest country in the world, with a Total Geographical Area (TGA) of 328.73 million hectares, of which 305.27 million hectares are the Reporting Area of Land Utilization Statistics. At present, almost 23 per cent of the country’s reported land area is earmarked as forests, while the barren and uncultivable land constitutes more than 5 per cent of the land area of the country. Again, nearly 3.5 per cent of the land area is set aside as permanent pastures and miscellaneous tree crops are grown in 1.1 per cent of the area. During the period 1980–81 to 1990–91, the Net Area Sown (NAS) in the country increased from 140.27 to 143 million hectares, but during the next decade it had marginally decreased. As a result of a substantial increase in the area sown more than once, the Gross Cropped Area (GCA) in the country increased from 172.63 million hectares in 1980–81 to 192.80 million hectares by the year 2005–06. The overall increase in the GCA in India during this period is estimated as 11.68 per cent, and the annual compound growth rate is found to be negligible (0.44 per cent). Meanwhile, the area under non-agricultural use had shown a relatively higher annual compound growth of 0.97 per cent (Table 20.4).
20.2.4 Changes in Cropping Pattern
At present, the cumulative area under the eight principal crops (or subgroups of crops) accounts for nearly 85 per cent of the GCA in India. These crops and subgroups of crops are rice, wheat, coarse cereals (jowar, bajra, maize, barley and small millets), pulses (gram, tur etc.), nine oilseeds (groundnut, sesamum, rapeseed and mustard, linseed, castor seed, safflower, niger seed, soyabean and sunflower), cotton, jute (including mesta) and sugar cane. Among these crops the cumulative area under rice, wheat and coarse cereals amounts to more than 50 per cent of the GCA in the country.
During the period from 1980–81 to 2005–06, even though the absolute area under rice had increased from 40.15 to 43.66 million hectares, the proportion of its area to the GCA in the country has marginally declined. Meanwhile, both the area under wheat and its relative share in the GCA had increased. Other major crops, the relative shares of which had substantially increased during this period, are the nine oilseeds and sugar cane. Over this period, the area under coarse cereals declined from 41.78 to 29.04 million hectares, registering an aggregate decrease of more than 30 per cent, and the relative share of this group of crops in the gross cropped area declined from 24.20 per cent to 15.06 per cent. Another group of crop that lost its absolute and relative area is jute and mesta (Table 20.5).
The index number of the area under the food grain crops in India had declined from 99.8 to 97.5 during the period from 1980–81 to 2006–07, while the index number of the area under non-food grain crops increased from 99.4 to 142.5.6 The growth trends in opposite directions in the area under these two categories of crops clearly indicates that a gradual shift in favour of the non-food grain crops at the expense of food grain crops has been going on in the country’s cropping pattern since the early 1980s.
20.2.5 Production and Productivity of Major Crops
A comparative analysis of the performance of the food grain crops and the non-food grain crops in India, from 1980–81 onwards, vividly shows that in terms of production the performance of non-food grain crops had been relatively better; whereas, in terms of per hectare yield, the performance of the food grain crops was comparatively better. During the period from 1980–81 to 2006–07, the index numbers related to the production of all crops in the country increased from 102.1 to 200.1, showing an aggregate increase of 96 per cent and an average annual compound growth rate of 2.62 per cent. Compared to the post-reforms period, the annual growth rates in production of both the food grain and the non-food grain crops are found to be higher during the 1980s. During the period from 1980–81 to 1990–91, the index number of the production of food grain crops registered an annual compound growth rate of 3.20 per cent, but during the period from 1990–91 to 2006–07 it declined to 1.27 per cent. In the case of the non-food grain crops, the respective growth rates were 4.84 and 2.75 per cent. Similarly, the index numbers of the yield of all the crops increased from 102.9 in 1980–81 to 185.5 in 2006–07 registering a positive compound growth rate of 2.29 per cent. While the index numbers of the yield of the food grain crops increased at the annual rate of 2.75 per cent during the period 1980–81 to 1990–91, the annual growth rate in the yield of the non-food grain crops was 2.58 per cent. Similarly, the annual growth rate in the yield of food crops during the period from 1990–91 to 2006–07 is found to be 3.43 per cent while the corresponding figure for the non-food grain crops was only 1.76 per cent (Table 20.6).
TABLE 20.4 Distribution of Agricultural Land by Use (1980–81 to 2005–06) (in Million Hectares)

Note: Percentages to the reporting area for land utilization are given in brackets.
*Provisional.
Source: Estimated from GOI, Directorate of Economics and Statistics (DES); Ministry of Agriculture, Agricultural Statistics at a Glance (Various Issues); (GOI), Economic Survey, 2008–09.
TABLE 20.5 Area Under Major Crops and Percentage Change in Area from 1980–81 to 2005–06 (Area in Million Hectare)
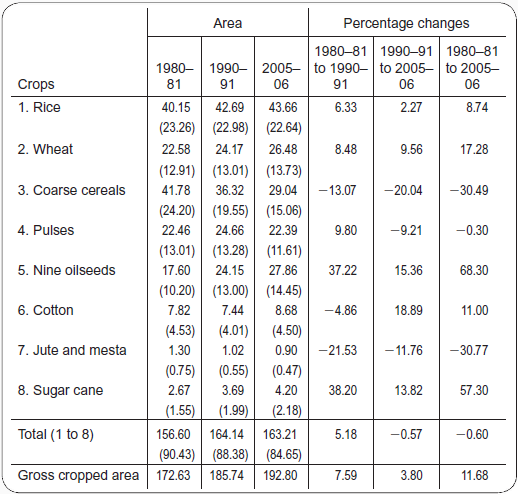
Note: Percentages to the reporting area for land utilization are given in brackets.
Source: Estimated from GOI, Directorate of Economics and Statistics (DES); Ministry of Agriculture, Agricultural Statistics at a Glance (Various Issues); (GOI), Economic Survey, 2008–09.
TABLE 20.6 Index Numbers of Production and Yield of Food Grain and Non-food Grain Crops (Base: Triennium Ending 1981–82 = 100)

Source: Estimated from GOI, Directorate of Economics and Statistics (DES); Ministry of Agriculture, Agricultural Statistics at a Glance (Various Issues); (GOI), Economic Survey, 2008–09.
20.2.5.1 Rice Rice, which is the predominant food grain crop in India, is extensively cultivated in almost all parts of the country. In the year 2007, the country accounted for 28.09 per cent of the total area under this crop in the world. In the production of rice India ranks second next to China, and the country contributes nearly 22 per cent of the global rice production. The principal rice producing states in India are West Bengal, Andhra Pradesh and Uttar Pradesh, and the respective shares of these states in the domestic production of rice in 2006–07 are estimated at 15.80, 12.72 and 11.91 per cent.7 During the period from 1980–81 to 2006–07, rice production in India increased from 53.63 million tonnes to 93.35 million tonnes registering an overall increase of 74.06 per cent and an annual compound growth rate of 2.15 per cent. Meanwhile the per hectare yield of the crop in the country increased from 1336 to 2131 kilograms, and the annual growth rate in the yield during this period is found to be 1.81 per cent (Table 20.7). Compared to the 1980s annual growth rates in the area, the production and yield are found to be lower during the post-reforms period.
Compared to the global average, paddy productivity in India is miserably poor. In the year 2007, the per hectare yield of the crop in Egypt, the United States and Japan amounted to 10,288, 8092 and 6511 kilograms, respectively, and the world average yield was 4233 kilograms, while the yield of rice in India remained as low as 3303 kilograms.
20.2.5.2 Wheat India holds second position among the wheat producing countries of the world, next only to China. In 2007 the country accounted for 12.50 per cent of the wheat growing lands and 12.51 per cent of the world’s wheat production. Uttar Pradesh, Punjab and Haryana are the major wheat producing states in India. In the year 2006–07, the cumulative contribution of these three states came up to 65.54 per cent of the country’s total production of wheat, in which the respective shares of the above states were 33.02, 19.26 and 13.27 per cent.
TABLE 20.7 Area, Production and Yield of Rice from 1980–81 to 2006–07 Alongwith Percentage Coverage Under Irrigation (Area in Million Hectare, Production in Million Tonnes, Yield in Kg/Hectare)
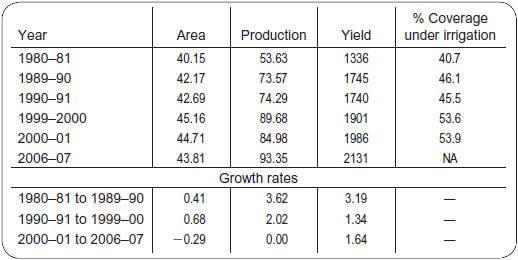
Source: Estimated from GOI, Directorate of Economics and Statistics (DES); Ministry of Agriculture, Agricultural Statistics at a Glance (Various Issues); (GOI), Economic Survey, 2008–09.
Within a period of 26 years from 1980–81 to 2006–07, wheat production in India increased from 36.31 million tonnes to 75.8 million tonnes, showing a more than two-fold increase. Compared to the 1980s, the annual growth rate in production is found to be relatively lower during the 1990s. During the period from 1980–81 to 2006–07 the per hectare yield of wheat in India increased from 1630 to 2708 kilograms, showing a rather impressive aggregate increase of 66.13 per cent. Thereafter, the yield remained more or less stagnant around 2700 kilograms (Table 20.8).
Both the area effect and the yield effect had contributed for the country’s better performance in wheat production, during the last two decades of the last century. As per the FAO statistics, the world’s average yield of wheat in 2006 was 2804 kilograms per hectare and the yield of the crop in India in that year amounted to 2619 kilograms, which is 7 per cent less than the global average.
20.2.5.3 Coarse Cereals The subgroup of the coarse cereals consists of six cereals, viz., jowar, bajra, maize, ragi, barley and millets. In India, the coarse cereals are grown mainly in the rainfed areas of the country, where the coverage of irrigation is only about 12 per cent. In the production of the coarse cereals, India holds the sixth position in the world. More than 20 per cent of the area under coarse cereals in India lies in Maharashtra, and the state accounted for 18.10 per cent of the country’s total production of the crop in the year 2006–07. Other major producing states of this group of crops in that year were Rajastan and Karnataka, and their respective shares of the total production amounted to 16.21 and 14.92 per cent.
TABLE 20.8 Area, Production and Yield of Wheat from 1980–81 to 2006–07 Alongwith Percentage Coverage Under Irrigation (Area in Million Hectare, Production in Million Tonnes, Yield in Kg/Hectare)

Source: Estimated from GOI, Directorate of Economics and Statistics (DES); Ministry of Agriculture, Agricultural Statistics at a Glance (Various Issues); (GOI), Economic Survey, 2008–09.
During the year 1980–81 the country produced 29.02 million tonnes of the coarse cereals, and it increased to 32.70 million tonnes by the year 1990–91. Since the early years of the 1990s production of the coarse cereals in India stagnated around 30million tonnes. The average annual growth rate in the production during the period from 1980–81 to 1989–90 had been 2.03 per cent, and during the period from 1990–91 to 2006–07 it declined to 0.23 per cent. However, over the past several years, in spite of the declining trend in the area under the crop, the per hectare yield of the coarse cereals had substantially increased. The per hectare yield which was 695 kgs in 1980–81 increased to 1182 kgs by the year 2006–07 and, compared to the 1980s, the annual growth rates in the yield have increased during the post-reforms period (Table 20.9).
20.2.5.4 Pulses In the production of pulses, India ranks first in the world and the crop is widely cultivated in almost all of the states in the country. The leading pulse producing states are Madhya Pradesh, Maharashtra and Uttar Pradesh. In the year 2006–07 the respective shares of these three states in the country’s total output of pulses were 23.96, 16.06 and 15.26 per cent. During the period from 1980–81 to 2006–07, the total production of pulses in the country increased from 10.63 million tonnes to 14.20 million tonnes showing an aggregate increase of 33.58 per cent. Over this period, the area under the crop marginally increased from 22.46 to 23.19 million hectares. The increase in production was mainly due to improvement in the per hectare productivity of the crop, which increased from 473 kilograms in 1980–81 to 612 kilograms by the year 2006–07. Compared to the 1980s, the annual growth rates in both the production and the productivity of pulses are found to be lower during the1990s, but showed better rates in the later years (Table 20.10).
TABLE 20.9 Area, Production and Yield of Coarse Cereals from 1980–81 to 2006–07 (Area in Million Hectare, Production in Million Tonnes, Yield in Kg/Hectare)

Source: Estimated from GOI, Directorate of Economics and Statistics (DES); Ministry of Agriculture, Agricultural Statistics at a Glance (Various Issues); (GOI), Economic Survey, 2008–09.
TABLE 20.10 Area, Production and Yield of Pulses from 1980–81 to 2006–07 Alongwith Percentage Coverage Under Irrigation (Area in Million Hectare, Production in Million Tonnes, Yield in Kg/Hectare)

Source: Estimated from GOI, Directorate of Economics and Statistics (DES); Ministry of Agriculture, Agricultural Statistics at a Glance (Various Issues); (GOI), Economic Survey, 2008–09.
20.2.5.5 Nine Oilseeds The subgroup of nine oilseeds consists of groundnut, castor seed, linseed, niger seed, safflower, sesamum, soyabean, sunflower, rapeseed and mustard. Nearly 25 per cent of the global production of groundnut comes from India, and it is the second largest producer of the crop, the first being China. Similarly, the country holds the second position in the production of rapeseed and mustard also. Madhya Pradesh, Rajasthan and Maharashtra are the leading producers of the nine oilseeds in India, and the respective shares of these states in the domestic production of this group of crops amounted to 23.92, 21.28 and 15.31 per cent during the year 2006–07. With a few exceptions, the area under the nine oilseeds had shown a continuous increase in the country during the 1980s, but stagnated during the next decade. Per hectare yield of the crop had shown wide annual variations even though the long-term trend is positive. During the period from 1980–81 to 2006–07, the yield of the crop increased from 532 to 916 kilograms per hectare showing an annual growth rate of 2.03 per cent. Meanwhile the total annual production of the crop increased from 9.37 to 24.29 million tonnes, registering an overall increase of 169.90 per cent and an annual growth rate of 3.59 per cent. It is to be noted that among the different categories of food crops, the average annual growth rate in the production of the nine oilseeds is found to be the highest during the past two and a half decades in the country (Table 20.11).
TABLE 20.11 Area, Production and Yield of Nine Oilseeds from 1980–81 to 2006–07 Alongwith Percentage Coverage under Irrigation (Area in Million Hectare, Production in Million Tonnes, Yield in Kg/Hectare)

Source: Estimated from GOI, Directorate of Economics and Statistics (DES); Ministry of Agriculture, Agricultural Statistics at a Glance (Various Issues); (GOI), Economic Survey, 2008–09.
20.2.5.6 Cotton Cotton is one of the important commercial crops cultivated in India. Next to China and the United States, India commands the third position among the cotton producing countries of the world. The states of Gujarat, Maharashtra and Punjab are the principal producers of this crop within the country. The respective shares of these three states in the total domestic production of cotton in 2006–07 were 38.84, 20.42 and 11. 84 per cent. Both the production and per hectare yield of cotton had shown positive growth trends in India, during the 1980s in spite of a decrease in the area under the crop. The domestic production of cotton, which was 7.01 million bales in 1980–81, increased to 22.63 million bales by the year 2006–07, registering a more than three-fold increase. Compared to the 1980s and 1990s, the performance of this crop both in terms of the growth rates in production and yield had been relatively much better since the early years of the present century (Table 20.12).
TABLE 20.12 Area, Production and Yield of Cotton Along with Percentage Coverage under Irrigation (Area in Million Hectare, Production in Million Bales of 170 Kg Each, Yield in Kg/Hectare)

Source: Estimated from GOI, Directorate of Economics and Statistics (DES); Ministry of Agriculture, Agricultural Statistics at a Glance (Various Issues); (GOI), Economic Survey, 2008–09.
20.2.5.7 Jute andMesta India holds first position in the world in the production ofjute and jute—like fibres. In the country, the state of West Bengal has a unique position both in the area under jute cultivation and its production. In the year 2006–07, 63.0 per cent of the jute growing areas in the country belonged to this single state, and its share in the production of jute and mesta amounted to 75.42 per cent. Other important states engaged in the production of jute are Bihar and Assam. Even though the total area under this crop remained more or less stagnant, since the beginning of the 1980s, the crop registered moderate growth rates both in production and in per hectare yield during the period from 1980–81 to 2006–07. The production of jute and mesta increased from 8.16 to 10.84 million bales during this period. Meanwhile the per hectare yield of the crop increased from 1130 to 2173 kilograms, showing an aggregate increase of 92.30 per cent and an annual growth rate of 2.45 per cent. Compared to the post-reforms period, better growth rates in the yield were observed during the 1980s (Table 20.13).
20.2.5.8 Sugar Cane Among the sugar cane growing countries of the world, India holds the second position next to Brazil in the production of this crop. In the year 2006, 20.19 per cent of the global production of sugar cane came from this country. The major sugar cane producing states in the country are Uttar Pradesh and Maharashtra. The respective shares of these states in the total domestic production of sugar cane during the year 2006–07 were 37.68 and 22.10 per cent. Other sugar cane producing states are Tamil Nadu, Karnataka and Andhra Pradesh. Both the production and the yield of the crop had shown incessant positive growth trends, from the beginning of the 1980s. Within the period from 1980–81 to 2006–07, the production of sugar cane increased from 154.25 to 355.52 million tonnes showing an aggregate increase of 130.48 per cent, and an impressive annual growth rate of 3.26 per cent. Compared to the 1980s, the average annual growth rate in the per hectare yield of the crop substantially declined during the 1990s. Since the early years of the present century there has been a perceptible increase in per hectare yield (Table 20.14). However, compared to Egypt and Guatemala, where the per hectare yield of sugar cane in 2006 was 119893 and 94789 kilograms, respectively, the yield of the sugar cane crop in India is much low.
TABLE 20.13 Area, Production and Yield of Jute and Mesta from 1980–81 to 2006–07 (Area in Million Hectare, Production in Million Tonnes, Yield in Kg/Hectare)

Source: Estimated from GOI, Directorate of Economics and Statistics (DES); Ministry of Agriculture, Agricultural Statistics at a Glance (Various Issues); (GOI), Economic Survey, 2008–09.
20.2.5.9 Plantation Crops The performance of plantation crops deserves a special significance from the national point of view, as they are generally export-oriented or import substituting. Tea, coffee and natural rubber are the three important plantation crops cultivated in India.
India is the second largest producer of tea in the world, and its share in the global production of the crop amounts to more than 25 per cent. At present the crop is grown in nearly 6 lakh hectares of land in this country. During the period from 1982–83 to 2007–08, the production of tea in India increased from 561 to 987 million kilograms and the annual compound growth rate in production during this period is estimated as 2.29 per cent. Since the introduction of the economic reforms, import of tea to the country from Nepal, Indonesia and Vietnam has substantially increased. The tea plantations are mainly located in the rural hill and backward areas of the north-eastern and southern states of the country.
TABLE 20.14 Area, Production and Yield of Sugar Cane Alongwith Percentage Coverage Under Irrigation (Area in Million Hectare, Production in Million Tonnes, Yield in Kg/Hectare)

Source: Estimated from, GOI, Directorate of Economics and Statistics (DES); Ministry of Agriculture, Agricultural Statistics at a Glance (Various Issues); (GOI), Economic Survey, 2008–09.
In the production of coffee, India holds the sixth position in the world. Robusta and Arabica are the two major varieties of coffee cultivated in the country. In 2007–08 the area under this crop in India amounted to 388 lakh hectares. The total production of the crop during that year had been 262 million kilograms. Coffee is a highly export-dependant crop and nearly 80 per cent of the domestic output is exported. During the year 2005–06 the country exported 2.02 lakh tonnes of coffee, and the value of it amounted to 1510 crores rupees.
India is the third largest producer of natural rubber in the world, next to Thailand and Indonesia. However, the country’s share in the global natural rubber production amounts to only 9 per cent. In the country, Kerala has near monopoly in the production of natural rubber. More than 80 per cent of the total area under this crop is in Kerala, and the state’s share in the total domestic production amounts to nearly 90 per cent. During the period from 1990–91 to 2007–08, the production of natural rubber in the country increased from 3.3 to 8.2 lakh tonnes, showing an overall increase of 148.48 per cent and an annual compound growth rate of 5.5 per cent.
In addition to the major crops, mentioned above, a wide variety of condiments and spices like pepper, ginger, garlic, chilly, turmeric, arecanut, coriander, cardamom, etc., and fruits and vegetables like potato, onion, banana, cashew nut, tapioca, sweet potato, etc., are also cultivated in India.
20.3 Factors Affecting Agricultural Performance
Even though so many factors such as the public sector outlays and the expenditure for the agricultural sector, the agricultural subsidies, the procurement and support prices of agricultural products have their own impacts in the performance of the country’s agricultural sector, the crucial factors which determine the area, yield and production of various crops in India can be identified as (1) rainfall and irrigation, (2) use of fertilizers (3) coverage of quality seeds and (4) size of operational holdings. In this section, we examine how far these determinants have influenced the performance of the agricultural sector in India, during the past two and a half decades.
20.3.1 Rainfall and Irrigation
Since the inception of the economic planning in India, and especially after the introduction of the New Agricultural Strategy of the mid-1960s, the role of irrigation in both intensive and extensive cultivation have been duly acknowledged. Accordingly, strenuous efforts were made by the central and the state governments of the country to enhance its irrigation potential by setting up a large number of major, medium and minor irrigation projects. In spite of this, even at the beginning of the present century, nearly 60 per cent of the gross sown area in India remains unirrigated and the adage that, ‘Indian agriculture is a gamble on monsoon’ still holds good. During the year 2005–06, even though 52.3 per cent of the area under cereals and 45.5 per cent of the area under food grain crops had been provided with irrigation facilities, the coverage of the net irrigated area in the net sown area in the country was only 42.22 per cent. Again, wide disparities can be observed among the different states in the distribution of the percentage coverage of the irrigated area under different crops. For instance, in 2005–06 the percentage of gross irrigated area to the total sown area in Punjab, Haryana and Uttar Pradesh had been as high as 96.6, 83.7 and 73.1 per cent, respectively, while the corresponding figures for the states of Kerala, Maharashtra, Karnataka and Madhya Pradesh were 15.4, 18.8, 27.9 and 30.0 per cent, respectively.8 The proportion of the irrigated area in some other states like Arunachal Pradesh (16.7 per cent), Assam (4.3 per cent), Himachal Pradesh (18.8 per cent), Mizoram (19.4 per cent) and Sikkim (8.2 per cent), are also found to be much lower. Again, in India, the non-cereal crops like oilseeds, pulses and plantation crops are mainly grown in the rainfed or unirrigated areas. Thus, the quantum of annual rainfall and its seasonal and spatial spread play a decisive role in determining the pace of agricultural development in India.
More than 75 per cent of the annual rainfall in the country is received during the south-west monsoon season. In the year 2009, the deficit in south-west monsoon rainfall amounted to 23 per cent and out of the 36 meteorological subdivisions in the country, 23 sub divisions (63.89 per cent), and out of the 526 meteorological districts, 311 districts (57 per cent), received deficit or scanty rainfall9 (Table 20.15). Even in those years in which the country had received more rainfall than its long period average, some parts of the country were under the grip of severe droughts. For instance, during the year 1990, the annual rainfall in India exceeded to its normal by 19 per cent. In spite of this, in 8.57 per cent of the meteorological sub divisions and 12 per cent of the districts, rainfall had been scanty or deficient. Similarly, during the year 1994 even though the country as a whole received 10 per cent more rainfall than its long period average, in 10 meteorological sub divisions and 23 districts, the rainfall had been deficit or scanty. In this context, it is pertinent to note that in almost every year while some parts of the country are affected by droughts and others experience floods, both result in crop destruction. In short, it can be reasonably asserted that in the absence of a proper and integrated water management system, aberrations of monsoons play havoc with the prospects of the Indian agricultural sector.
TABLE 20.15 Performance of South-West Monsoon During 1989 to 2009 (1 June-30 September)

Note: Excess: +20% or more of normal rainfall.
Normal: Between +19 and —19% of normal rainfall.
Deficient: Between —20 and —59% of normal rainfall.
Scanty: Between —60 and —99% of normal rainfall.
Source: GOI, Economic Survey 2003–04, 2009–10.
Since the beginning of the 1980s, the area under irrigation and the percentage coverage of the irrigated area under various crops have steadily increased in the country. Within the period from 1980–81 to 2005–06 the net irrigated area in India increased from 38.72 to 55.11 million hectares, showing an overall increase of 42.33 per cent, whereas the gross irrigated area increased from 49.78 to 82.63 million hectares, showing an aggregate increase of 66 per cent (Table 20.16).
Compared to the 1980s, the annual growth rates in the net irrigated area show a marginal decrease during 1990s, and the early half of the first decade of the present century. Within the period from 1980–81 to 2005–06, the gross irrigated area in the country increased from 49.78 to 82.63 million hectares, registering an aggregate increase of 54.68 per cent and an average annual growth rate of 2.14 per cent. However, compared to the 1980s, the average annual growth rate in the gross irrigated area has marginally declined during the period from 1990–91 to 2005–06. Under the utilization of the Created Irrigation Potential (CIP) the major and medium irrigation projects is a persistent problem in India. For instance, even though the total CIP of the country by the end of the year 2006–07 amounted to 102.2 million hectares the actual gross irrigated area was only 87.2 million hectares, which shows that nearly 15 per cent of the created potential remained unutilized.10 The inordinate delay in the completion of many major and medium irrigation projects, due to the financial constraints of the state governments, is another impediment to bring more areas under irrigation. In order to tackle this problem, the central government had initiated a special programme called the Accelerated Irrigation Benefits Programme in 1996–97. This programme aims to provide central loan assistance to the states, for the timely completion of the ongoing irrigation and multipurpose projects. Later, in 2002, a Fast Track Programme with full central assistance has also been launched for the speedy completion of the ongoing major and medium irrigation projects.
TABLE 20.16 Area Under Irrigation and Percentage Coverage of Irrigated Area (Area in Million Hectare)

*Provisional.
Source: Estimated from GOI, Directorate of Economics and Statistics (DES); Ministry of Agriculture, Agricultural Statistics at a Glance (Various Issues); (GOI), Economic Survey, 2008–09.
20.3.2 Use of Fertilizers
The total consumption and per hectare use of chemical fertilizers in India show impressive annual growth rates both in the 1980s and the post-reforms period. Within a period of 26 years from 1980–81 to 2006–2007 the total consumption of the chemical fertilizers (N + P+K) in the country increased from 55.16 lakh tonnes to 216.52 lakh tonnes, registering a nearly four-fold increase. Meanwhile, the per hectare use of it rose from 31.95 to 112.67 kilograms, showing an overall increase of 252.64 per cent and an average annual growth rate of 4.97 per cent (Table 20.17). Compared to the period from 1990–01 to 2006–07, during which the average annual growth rates in the total consumption and per hectare use of chemical fertilizers were 3.47 and 3.26 per cent, respectively, the corresponding annual growth rates during the 1980s, estimated as 8.08 and 7.69 per cent, respectively, had been much better.
TABLE 20.17 Consumption of Fertilizers (NPK) and per Hectare Use (1980–81 to 2006–07)
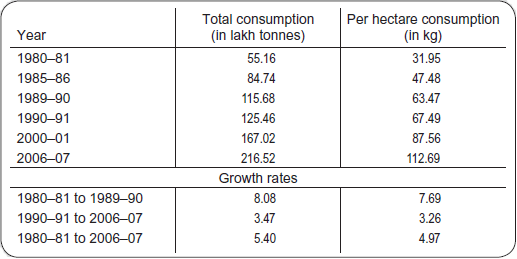
Source: Estimated from GOI, Directorate of Economics and Statistics (DES); Ministry of Agriculture, Agricultural Statistics at a Glance (Various Issues); (GOI), Economic Survey, 2008–09.
The nitrogenous fertilizers (N) constitute a major portion of the total quantity of chemical fertilizers used in India. During the year 2007–08, out of the total consumption of 225.70 lakh tones of chemical fertilizers, the respective shares of nitrogenous, phosphatic and potassic fertilizers were 63.89 per cent (144.19 lakh tonnes), 24.44 per cent (55.15 lakh tonnes) and 11.68 per cent (26.36 lakh tones).11 It is to be noted that the entire quantity of the potash fertilizers used in the country are imported.
During the year 2004–05, per hectare use of fertilizers in India amounted to 102.1 kilograms while the world average during that year was only 31.3 kilograms. Compared to the other countries like Egypt (555.1 kgs), Korea Republic (394.7 kgs) and Netherlands (249.4 kgs), the fertilizer consumption in India is much lower. However, compared to Australia (5.5 kgs) Russian Federation (8.2 kgs), South Africa (8.4 kgs) and some of the developing countries, per hectare use of fertilizers in India is relatively higher.12
20.3.3 Coverage of HYV Seeds
The high yielding variety seeds were introduced in India on a massive scale, as an integral part of the New Agricultural Policy of the mid-1960s. Till the beginning of the 1990s, its adoption was more or less confined to cereals like wheat, rice, jowar, bajra, maize and ragi. However, in the recent years, better quality seeds are increasingly used in the cultivation of pulses and oilseeds also.
Over the past several years, the quantity of certified/quality seeds distributed in India has shown persistent positive annual growth rates. Within the period from 1990–91 to 2006–07, the total amount of certified/quality seeds distributed within the country increased from 57.10 to 155.01 lakh quintals, showing an aggregate increase of 171.47 per cent and an average annual growth rate of 6.65 per cent (Table 20.18).
TABLE 20.18 Distribution of Certified/Quality Seeds (1990–91 to 2006–07) (Lakh Quintals)

Source: DES, Agricultural Statistics 2005, 2008; GOI, Economic Survey 2003–04.
In the production and distribution of the superior quality seed varieties, wide variations can be observed among the different categories of crops. During the period from 1990–91 to 2006–07, compared to fibres and miscellaneous crops, the annual growth rates in the distribution of the superior quality seeds had been much better for cereals, pulses and oilseeds. With a view to provide the superior quality seeds and planting materials to the farmers, the central government had formulated and implemented the National Seeds Policy in the year 2002. Again in line with the country’s obligation to the TRIPs Agreement of the WTO, the Protection of Plant Varieties and Farmers’ Rights Act was enacted in 2003. This Act intends to protect the intellectual property rights of the farmers, and to promote investments in the R&D for the development of better plant varieties.13
20.3.4 Size of Operational Holdings
The ability of the traditional Indian farmers to adopt modern technology in farming is invariably related to the size of their operational holdings. Due to an increase in the number of operational holdings over the past years, the average size of holdings in India shows a persistent tendency to decline. Within a period of 15 years from 1985–86 to 2000–01, the number of operational land holdings in India increased from 971.55 to 1199.31 lakh and the average size of holdings declined from 1.69 to 1.33 hectares. During this period, the number of marginal holdings, the average size of which amounts to only 0.40 hectares, increased from 561.47 to 754.08 lakh and its percentage to the total number of holdings increased from 57.8 to 62.3 per cent.14 As a result, the percentage share of the operational area under marginal holdings to the GCA in the country increased from 13.4 to 18.7 per cent. Meanwhile, the number of small holdings also increased from 179.22 to 226.95 lakh and its share in the total operated area increased from 15.6 to 19.0 per cent. Thus, during the year 2001–02, more than three-fourths of the total number of operational holdings and nearly one-third of the total operated area were either marginal or small holdings. On the other hand, the number of medium size holdings decreased from 79.16 to 65.77 lakh, and its relative share in the total operated area declined from 28.6 to 24.0 per cent. During this period, the number of large holdings decreased from 19.18 to 12.30 lakh, and its percentage to the total operated area declined from 20.1 to 13.2 per cent. All the above clearly indicates a diminishing tendency in the average size of holdings, which in many ways restricts the momentum of modernization in the Indian agricultural sector (Table 20.19).
TABLE 20.19 Distribution of Operational Holdings (Number of Holdings: ′000; Area: ′000 Hectares; Average Size: Hectares)

Note: Figures in parentheses indicate percentage to all holdings.
*Excluding Jharkhand.
Source: DES, Agricultural Statistics 2005, 2008; GOI, Economic Survey 2003–04.
20.4 Conclusion
This chapter, with its focus on the changes in the land use and cropping pattern along with the overall performance of the Indian agricultural sector since the beginning of the 1980s, indicates that akin to the experience of the other developing countries, the relative share of the primary sector in the GDP of the country has been showing persistent decrease. Similarly, the percentage share of the agricultural sector in the GCF of the economy also shows negative growth trends. There is no valid evidence to suggest that the introduction of the economic reforms had played any crucial role in enhancing the productivity of the major agricultural crops in India. However, it can be reasonably asserted that the reforms had accelerated the process of commercialization of the Indian agriculture. During the post-liberalization period, the areas under commercial crops like oilseeds and cotton in this country have substantially increased. At the same time, the area under the food crops like coarse cereals and pulses showed declining growth trends. Generally, over this period, a shift in favour of the non-food crops is discernible in the cropping pattern changes. Even though the per hectare yield of all the major crops in India had considerably increased over the past two decades, compared to the competing countries in the global market, India’s achievement in this respect is far from satisfactory. In spite of the strenuous efforts made so far to expand the coverage of the irrigated area under different crops, the quantum of annual rainfall and its seasonal and spatial spread continue to be the crucial factors that determine the fortunes of Indian farmers. In spite of a declining tendency in the average size of operational holdings, the country has made noteworthy achievements in the use of fertilizers and the adoption of high quality seeds. Another distinct notable feature of the performance of the agricultural sector during the post-reforms period is the accelerated growth rates in the private sector capital formation and the simultaneous decrease in the proportion of the public sector capital formation in the GCF of the agriculture and allied sectors of the economy.
References
Bhalla, G. S., and Singh, G. (2001). Indian agriculture—Four decades of development. New Delhi: Sage Publications.
Dandekar, V. M. (1996). The Indian economy. New Delhi: Sage Publications.
Government of India. Economic survey (various issues).
Government of India. Agricultural statistics at a glance (various issues). New Delhi: Directorate of Economics and Statistics.
Gupta, K. R. (2000). Issues in Indian economy. New Delhi: Atlantic Publishers and Distributors.
Hanumantha Rao, C. H. (2004). A viable agriculture in new international trade regime. In U. Kapila (Ed.), Indian economy since independence. Faridabad: Academic Foundation.
Kapila, R., and Kapila, U. (2001). India’s economy in the 21st century. New Delhi: Academic Foundation Publishers.
Parikh, K. S. (1999). India development report 1999–2000. New Delhi: Oxford University Press.
Koti, R. K. et al. (1996). Studies in Indian economy. Nagpur: Himalaya Publishing House.
Parthasarathi, G. (2003). Economic reforms and rural development in India. New Delhi: Academic Foundations.
Patel, S. J. (1994). Indian economy towards the21st Century. New Delhi: Oxford University Press.
Rangarajan, C. (2004). Selected essays on Indian economy. New Delhi: Academic Foundation.
Tandon, B. B., and Tandon, K.K. (1997). Indian economy. New Delhi: Tata McGraw Hill Publishing Company Limited.
Vyas, V. S. (2003). India’s agrarian structure, economic policies and sustainable Development. New Delhi: Academic Foundation.
APPENDIX 20.1 India’s Position in World Agriculture During 2007 (Area in Million Hectares, Production in Million Tonnes)

Source: DES, Agricultural Statistics at a Glance 2008.
APPENDIX 20.2 Gross Domestic Product at Factor Cost from Agriculture (in Rs ′000 Crore)

Source: DES, Agricultural Statistics at a Glance 2005, 2008.
APPENDIX 20.3 Three Largest Producing States in Important Crops During 2006–07 (Production in Million Tonnes)

*Production in million bales of 170 kg each.
**Production in million bales of 180 kg each.
Source: DES, Agricultural Statistics at a Glance 2008, Table 4.2.
APPENDIX 20.4 State-wise Percentage Coverage of Irrigated Area Under Major Group of Crops (2005–06)

Source: DES, Agricultural Statistics at a Glance 2005, 2008.