Chapter 15. Debugging Embedded Linux Applications
In This Chapter
![]() 15.2 Remote (Cross) Debugging 424
15.2 Remote (Cross) Debugging 424
![]() 15.3 Debugging with Shared Libraries 429
15.3 Debugging with Shared Libraries 429
![]() 15.4 Debugging Multiple Tasks 435
15.4 Debugging Multiple Tasks 435
The preceding chapter explored the use of GDB for debugging kernel code and code resident in Flash, such as bootloader code. This chapter continues our coverage of GDB for debugging application code in user space. We extend our coverage of remote debugging and the tools and techniques used for this particular debugging environment.
15.1 Target Debugging
We explored several important debugging tools in Chapter 13, “Development Tools.” strace and ltrace can be used to observe and characterize a process’s behavior and often isolate problems. dmalloc can help isolate memory leaks and profile memory usage. ps and top are useful for examining the state of processes. These relatively small tools are designed to run directly on the target hardware.
Debugging Linux application code on an embedded system has its own unique challenges. Resources on your embedded target are often limited. RAM and nonvolatile storage limitations might prevent you from running target-based development tools. You might not have an Ethernet port or other high-speed connection. Your target embedded system might not have a graphical display, keyboard, or mouse.
This is where your cross-development tools and an NFS root mount environment can yield large dividends. Many tools, especially GDB, have been architected to execute on your development host while actually debugging code on a remote target. GDB can be used to interactively debug your target code or to perform a postmortem analysis of a core file generated by an application crash. We covered the details of application core dump analysis in Chapter 13.
15.2 Remote (Cross) Debugging
Cross-development tools were developed primarily to overcome the resource limitations of embedded platforms. A modest-size application compiled with symbolic debug information can easily exceed several megabytes. With cross debugging, the heavy lifting can be done on your development host. When you invoke your cross version of GDB on your development host, you pass it an ELF file compiled with symbolic debug information. On your target, you can strip1 the ELF file of all unnecessary debugging information to keep the resulting image to its minimum size.
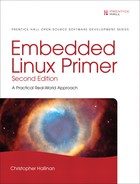
We introduced the readelf utility in Chapter 13. In Chapter 14, “Kernel Debugging Techniques,” we used it to examine the debug information in an ELF file compiled with symbolic debugging information. Listing 15-1 contains the output of readelf for a relatively small web server application compiled for the ARM architecture.
Listing 15-1. ELF File Debug Information for the Sample Program
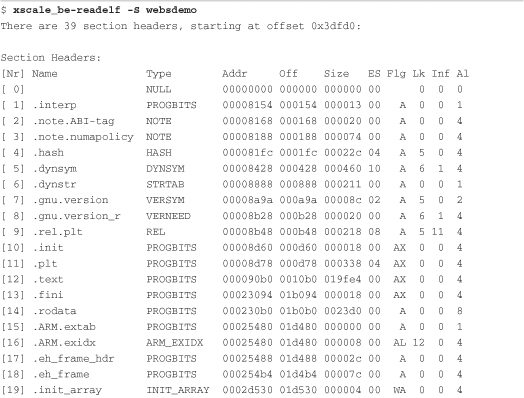
You can see from Listing 15-1 that many sections contain debug information. A section with the name .comment contains more than 2KB (0x940) of information that is not necessary for the application to function. The size of this sample file, including debug information, is more than 275KB, as shown here:
$ ls -l websdemo
-rwxrwxr-x 1 chris chris 283511 Nov 8 18:48 websdemo
If we strip this file using our cross-strip utility, we can minimize its size to preserve resources on our target system. Listing 15-2 shows the results.
Listing 15-2. Strip Target Application

Here we strip both the symbolic debug information and the .comment section from the executable file. We specify the name of the stripped binary using the -o command-line switch. You can see that the stripped binary is less than half its original size. Of course, for larger applications, this space savings can be even more significant. A recent Linux kernel compiled with debug information was larger than 18MB. After stripping, as in Listing 15-2, the resulting binary was slightly larger than 2MB!
For debugging in this fashion, you place the stripped version of the binary on your target system and keep a local unstripped copy on your development workstation containing symbolic information needed for debugging. You use gdbserver on your target board to provide an interface back to your development host, where you run the full-blown version of GDB (your cross-gdb, of course) on your unstripped binary.
15.2.1 gdbserver
Using gdbserver allows you to run GDB from a development workstation rather than on the target embedded Linux platform. This configuration has obvious benefits. For starters, it is common for your development workstation to have far more CPU power, memory, and hard-drive storage than your embedded platform. In addition, it is common for the source code for your application under debug to exist on the development workstation and not on the embedded platform.
gdbserver is a small program that runs on the target board and allows remote debugging of a process on the board. It is invoked on the target board specifying the program to be debugged, as well as an IP address and port number on which it will listen for connection requests from GDB. Listing 15-3 shows the startup sequence for initiating a debug session on your target board.
Listing 15-3. Starting gdbserver on Your Target Board

This example starts gdbserver configured to listen for an Ethernet TCP/IP connection on port 2001, ready to debug our stripped binary program called websdemo-stripped.
From our development workstation, we launch GDB, passing it the name of the binary executable containing symbolic debug information that we want to debug as an argument. After GDB initializes, we issue a command to connect to the remote target board. Listing 15-4 shows this sequence.
Listing 15-4. Starting a Remote GDB Session

Listing 15-4 invokes cross-gdb on your development host. When GDB is running, we issue the GDB target remote command. This command causes GDB to initiate a TCP/IP connection from your development workstation to your target board, with the indicated IP address on port 2001. When gdbserver accepts the connection request, it prints a line similar to this:
Remote debugging from host 192.168.0.10
Now GDB is connected to the target board’s gdbserver process, ready to accept commands from GDB. The rest of the session is exactly the same as if you were debugging an application locally. This is a powerful tool. It lets you use the power of your development workstation for the debug session, leaving only a small, relatively unobtrusive GDB stub and your program being debugged on the target board. In case you were wondering, gdbserver for this particular ARM target is only 54KB, as shown here:
![]()
The one caveat is often the subject of the frequently asked questions (FAQ) on mailing lists. You must be using a GDB on your development host that was configured as a cross debugger. It is a binary program that runs on your development workstation (usually x86) and that understands binary executable images compiled for another architecture. This is an important and frequently overlooked fact. You cannot debug a Power Architecture target with a native GDB such as that found in a typical Ubuntu desktop Linux installation. You must have a GDB configured for your host and target combination.
When GDB is invoked, it displays a banner consisting of several lines of information, and then it displays its compiled configuration. Listing 15-5 is an example of the GDB used for some examples in this book. It is part of an embedded Linux distribution provided by MontaVista Software configured for Power Architecture cross-development.
Listing 15-5. Invocation of cross-gdb

Notice the last lines of this GDB startup message. This is the configuration compiled into this version of GDB. It was compiled to execute on an x86 (i686) PC host running GNU/Linux and to debug binary programs compiled for a Power Architecture processor running GNU/Linux. This is specified by the --host and --target variables displayed by the banner text. It is also a part of the configuration string passed to ./configure when building GDB.
15.3 Debugging with Shared Libraries
Now that you understand how to invoke a remote debug session using GDB on the host and gdbserver on the target, we turn our attention to the complexities of shared libraries and debug symbols. Unless your application is a statically linked executable (linked with the -static linker command-line switch), many symbols in your application will reference code outside your application. Obvious examples include the use of standard C library routines such as fopen, printf, malloc, and memcpy. Less obvious examples might include calls to application-specific functions such as jack_transport_locate() (a routine from the JACK low-latency audio server), which calls a library function outside the standard C libraries.
To have symbols from these routines available, you must satisfy two requirements for GDB:
• You must have debug versions of the libraries available.
• GDB must know where to find them.
If you don’t have debug versions of the libraries available, you can still debug your application; you just won’t have any debug information available for library routines called by your application. Often this is perfectly acceptable—unless, of course, you are developing a shared library object as part of your embedded project.
Look back at Listing 15-4, where we invoked GDB on a remote target. After GDB connected using the target remote command, GDB issued a two-line response:
![]()
This confirms that GDB connected to our target at the indicated IP address and port. GDB then reports the location of the program counter as 0x40000790. Why do we get question marks instead of a symbolic location? Because this is the Linux dynamic loader (ld-x.y.z.so), and this particular platform does not have debug symbols available for this shared library. How do we know this?
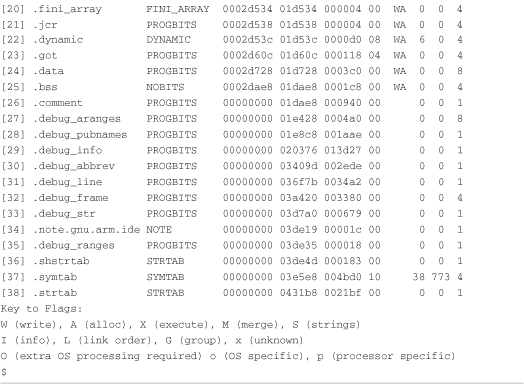
Recall the discussion of the /proc file system in Chapter 9, “File Systems.” One of the more useful entries was the maps entry (see Listing 9-16 in Chapter 9) in the per-process directory structure. We know the process ID (PID) of our target application from the gdbserver output shown in Listing 15-3. Our process was assigned PID 197. Given that, we can see the memory segments in use right after process startup, as shown in Listing 15-6.
Listing 15-6. Initial Target Memory Segment Mapping
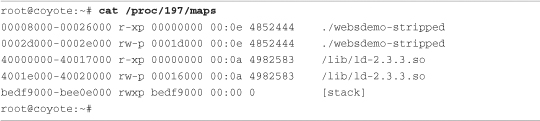
Here we see the target websdemo-stripped application occupying two memory segments. The first is the read-only executable segment at 0x8000, and the second is a read-write data segment at 0x2d000. The third memory segment is the one of interest. It is the Linux dynamic linker’s executable code segment. Notice that it starts at address 0x40000000. If we investigate further, we can confirm that GDB is actually sitting at the first line of code for the dynamic linker, before any code from our own application has been executed. Using our cross version of readelf, we can confirm the linker’s starting address as follows:
![]()
From this data, we conclude that the address that GDB reports on startup is the first instruction from ld-2.3.3.so, the Linux dynamic linker/loader. You can use this technique to get a rough idea of where your code is if you don’t have symbolic debug information for a process or shared library.
Remember that we are executing this cross readelf command on our development host. Therefore, the ld-2.3.3.so file, itself an XScale binary object, must be accessible to your development host. Most typically, this file resides on your development host and is a component of your embedded Linux distribution installed on your host.
15.3.1 Shared Library Events in GDB
GDB can alert you to shared library events. This can be useful for understanding your application’s behavior or the behavior of the Linux loader, or for setting breakpoints in shared library routines you want to debug or step through. Listing 15-7 illustrates this technique. Normally, the complete path to the library is displayed. This listing has been edited for better readability.
Listing 15-7. Stopping GDB on Shared Library Events

When the debug session is first started, no shared libraries are loaded. You can see this with the first i shared command. This command displays the shared libraries that are currently loaded. Setting a breakpoint at our application’s main() function, we see that two shared libraries are now loaded. These are the Linux dynamic linker/loader and the standard C library component libc.
From here, we issue the set stop-on-solib-event command and continue program execution. When the application tries to execute a function from another shared library, that library is loaded. In case you are wondering, the gethostbyname() function is encountered and causes the next shared object to load.
This example illustrates an important cross-development concept. The binary application (ELF image) running on the target contains information on the libraries it needs to resolve its external references. We can view this information easily using the ldd command, introduced in Chapter 11, “BusyBox,” and detailed in Chapter 13. Listing 15-8 shows the output of ldd invoked from the target board.
Listing 15-8. ldd Executed on the Target Board

Notice that the paths to the shared libraries on the target are absolute paths starting at /lib on the root file system. But GDB running on your host development workstation cannot use these paths to find the libraries. You should realize that doing so would result in your host GDB loading libraries from the wrong architecture. Your host is likely x86, whereas in this example, the target is ARM XScale.
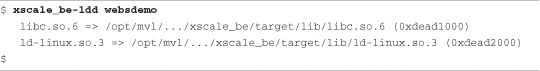
If you invoke your cross version of ldd, you will see the paths that were preconfigured into your toolchain. Your toolchain must know where these files exist on your host development system.2 Listing 15-9 illustrates this. Again, we have edited the listing for readability; long paths have been abbreviated.
Listing 15-9. ldd Executed on the Development Host
Your cross toolchain should be preconfigured with these library locations. Not only does your host GDB need to know where they are located, but, of course, your compiler and linker also need to know.3 GDB can tell you where it is configured to look for these libraries using the show solib-absolute-prefix command:

You can set or change where GDB searches for shared libraries using the GDB commands set solib-absolute-prefix and set solib-search-path. If you are developing your own shared library modules or have custom library locations on your system, you can use solib-search-path to instruct GDB where to look for your libraries. For more details about these and other GDB commands, consult the online GDB manual referenced at the end of this chapter.
One final note about ldd. You might have noticed the addresses from Listing 15-8 and Listing 15-9 associated with the libraries. ldd displays the load address for the start of these code segments as they would be if the program were loaded by the Linux dynamic linker/loader. Executed on the target, the addresses shown in Listing 15-5 make perfect sense, and we can correlate these with the /proc/<pid>/maps listing of the running process on the target. Listing 15-10 displays the memory segments for this target process after it is completely loaded and running.
Listing 15-10. Memory Segments from /proc/<pid>/maps on Target
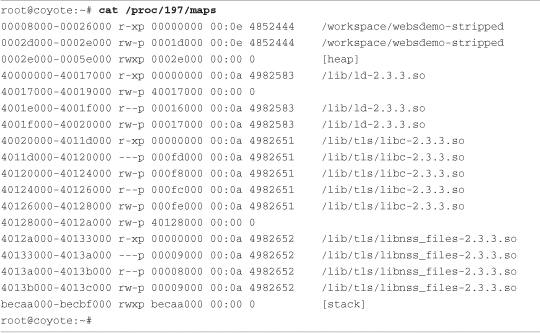
Notice the correlation of the target ldd output from Listing 15-8 to the memory segments displayed in the /proc file system for this process. The start of the Linux loader (the beginning of the .text segment) is 0x40000000, and the start of libc is at 0x40020000. These are the virtual addresses where these portions of the application have been loaded; they are reported by the target invocation of ldd. However, the load addresses reported by the cross version of ldd in Listing 15-9 (0xdead1000 and 0xdead2000) are there to remind you that these libraries cannot be loaded on your host system (they are ARM architecture binaries). These load addresses are simply placeholders.
15.4 Debugging Multiple Tasks
Generally the developer is presented with two different debugging scenarios when dealing with multiple threads of execution. Processes can exist in their own address space or can share an address space (and other system resources) with other threads of execution. The first scenario (independent processes not sharing common address space) must be debugged using separate independent debug sessions. Nothing prevents you from using gdbserver on multiple processes on your target system and using a separate invocation of GDB on your development host to coordinate a debug session for multiple cooperating but independent processes.
15.4.1 Debugging Multiple Processes
When a process being debugged under GDB uses the fork() system call4 to spawn a new process, GDB can take one of two courses of action. It can continue to control and debug the parent process, or it can stop debugging the parent process and attach to the newly formed child process. You can control this behavior using the set follow-fork-mode command. The two modes are follow parent and follow child. The default behavior is for GDB to follow the parent. In this case, the child process executes immediately upon a successful fork.
Listing 15-11 reproduces a snippet of a simple program that forks multiple processes from its main() routine.
Listing 15-11. Using fork() to Spawn a Child Process

This simple loop creates MAX_PROCESSES new processes using the fork() system call. Each newly spawned process executes a body of code defined by the function worker_process(). When this code is run under GDB in default mode, GDB detects the creation of the new threads of execution (processes) but remains attached to the parent’s thread of execution. Listing 15-12 illustrates this GDB session.
Listing 15-12. GDB in follow-fork-mode = parent

Notice that eight child processes were spawned, with PID values from 357 to 364. The parent process was instantiated with PID 356. When the breakpoint in main() was hit, we entered a breakpoint at the worker_process() routine, which each child process executes upon fork(). Letting the program continue from main, we see each of the new processes spawned and detached by the debugger. They never hit the breakpoint because GDB is attached to the main process, which never executes the worker_process() routine.
If you need to debug each process, you must execute a separate independent GDB session and attach to the child process after it is forked(). The GDB documentation referenced at the end of this chapter outlines a useful technique to place a call to sleep() in the child process, giving you time to attach a debugger to the new process. Attaching to a new process is explained in Section 15.5.2, “Attaching to a Running Process.”
If you simply need to follow the child process, set follow-fork-mode to follow child before your parent reaches the fork() system call, as shown in Listing 15-13.
Listing 15-13. GDB in follow-fork-mode = child
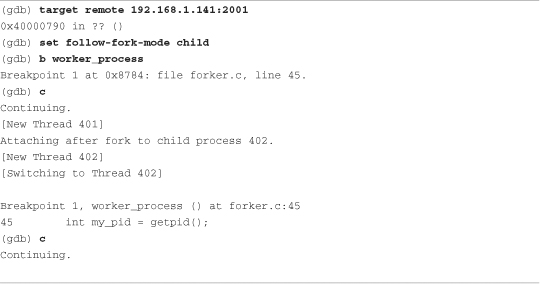
Here we see the parent process being instantiated as PID 401. When the first child is spawned by the fork() system call, GDB detaches silently from the parent thread of execution and attaches to the newly spawned child process having PID 402. GDB is now in control of the first child process and honors the breakpoint set at worker_process(). Notice, however, that the other child processes spawned by the code snippet from Listing 15-11 are not debugged and continue to run to their own completion.
In summary, using GDB in this fashion, you are limited to debugging a single process at a time. You can debug through the fork() system call, but you have to decide which thread of execution to follow through the fork() call—the parent or the child. As mentioned in the introduction to this section, you can use multiple independent GDB sessions if you must debug more than one cooperating process at a time.
15.4.2 Debugging Multithreaded Applications
If your application uses the POSIX thread library for its threading functions, GDB has additional capabilities to handle concurrent debugging of a multithreaded application. The Native POSIX Thread Library (NPTL) has become the de facto standard thread library in use on Linux systems, including embedded Linux systems. The rest of this discussion assumes that you are using this thread library.
For this section, we use a demonstration program that spawns a number of threads using the pthread_create() library function in a simple loop. After the threads are spawned, the main() routine simply waits for keyboard input to terminate the application. Each thread displays a short message on the screen and sleeps for a predetermined time. Listing 15-14 shows the startup sequence on the target board.
Listing 15-14. Target Threads Demo Startup

As in our previous examples, gdbserver prepares the application for running and waits for a connection from our host-based cross-gdb. When GDB connects, gdbserver reports the connection with the Remote debugging... message. Now we start GDB on the host and connect. Listing 15-15 reproduces this half of the session.
Listing 15-15. Host GDB Connecting to Target Threads Demo
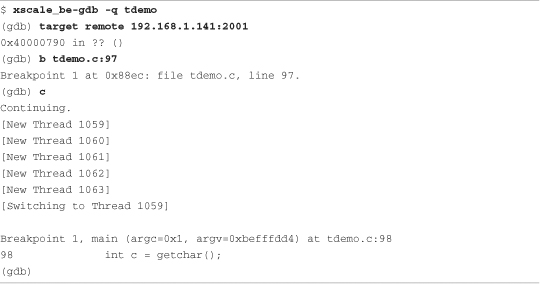
Here we connect to the target (resulting in the Remote debugging...message shown in Listing 15-14), set a breakpoint just past the loop where we spawned the new threads, and continue. When the new thread is created, GDB displays a notice along with the thread ID. Thread 1059 is the tdemo application, doing its work directly from the main() function. Threads 1060 through 1063 are the new threads created from the call to pthread_create().
When GDB hits the breakpoint, it displays the message [Switching to Thread 1059], indicating that this was the thread of execution that encountered the breakpoint. It is the active thread for the debugging session, referred to as the current thread in the GDB documentation.
GDB enables us to switch between threads and perform the usual debugging operations such as setting additional breakpoints, examining data, displaying a backtrace, and working with the individual stack frames within the current thread. Listing 15-16 provides examples of these operations, continuing with our debugging session started in Listing 15-15.
Listing 15-16. GDB Operations on Threads
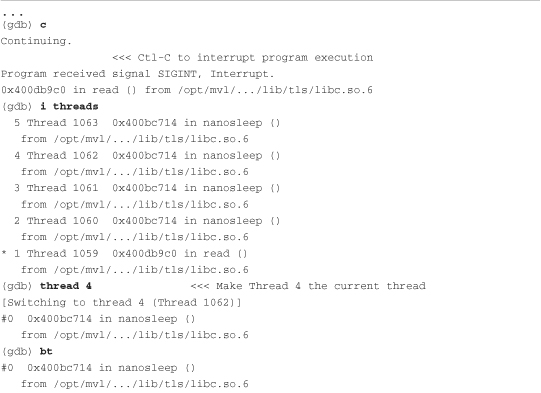

A few points are worth mentioning. GDB assigns its own integer value to each thread and uses these values to reference the individual threads. When a breakpoint is hit in a thread, all threads within the process are halted for examination. GDB marks the current thread with an asterisk (*). You can set unique breakpoints within each thread—assuming, of course, that they exist in a unique context. If you set a breakpoint in a common portion of code where all threads execute, the thread that hits the breakpoint first is arbitrary.
The GDB user documentation referenced at the end of this chapter contains more useful information related to debugging in a multithreaded environment.
15.4.3 Debugging Bootloader/Flash Code
Debugging Flash resident code presents its own unique challenges. The most obvious limitation is the way in which GDB and gdbserver cooperate in setting target breakpoints. When we discussed the GDB remote serial protocol in Chapter 14, you learned how breakpoints are inserted into an application.5 GDB replaces the opcode at the breakpoint location with an architecture-specific opcode that passes control to the debugger. However, in ROM or Flash, GDB cannot overwrite the opcode, so this method of setting breakpoints is useless.
Most modern processors contain some number of debug registers that can be used to get around this limitation. These capabilities must be supported by architecture- and processor-specific hardware probes or stubs. The most common technique for debugging Flash and ROM resident code is to use JTAG hardware probes. These probes support the setting of processor-specific hardware breakpoints. This topic was covered in detail in Chapter 14. Refer to Section 14.4.2, “Debugging with a JTAG Probe,” for details.
15.5 Additional Remote Debug Options
Sometimes you might want to use a serial port for remote debugging. For other tasks, you might find it useful to attach the debugger to a process that is already running. These simple but useful operations are detailed here.
15.5.1 Debugging Using a Serial Port
Debugging using a serial port is quite straightforward. Of course, you must have a serial port available on your target that is not being used by another process, such as a serial console. The same limitation applies to your host. A serial port must be available. If both of these conditions can be met, simply replace the IP address:port number specification passed to gdbserver with a serial port specification. Use the same technique when connecting to your target from your host-based GDB.
On your target:
![]()
From your host:

15.5.2 Attaching to a Running Process
It is often advantageous to connect to a process to examine its state while it is running instead of killing the process and starting it again. With gdbserver, this task is trivial:

When you are finished examining the process under debug, you can issue the GDB detach command. This detaches the gdbserver from the application on the target and terminates the debug session. The application continues where it left off. This is a very useful technique for examining a running program. Be aware, though, that when you attach to the process, it halts, waiting for instructions from you. It does not resume execution until instructed to do so, using either the continue or detach command. Also note that you can use the detach command at almost any time to end the debug session and leave the application running on the target.
15.6 Summary
• Remote (cross) debugging enables symbolic debugging using host development workstation resources for the heavy lifting, preserving often-scarce target resources.
• gdbserver runs on the target system and acts as the glue between the cross-gdb running on a development host and the process being debugged on the target.
• GDB on the host typically uses IP connections via Ethernet to send commands to and receive commands from gdbserver running on the target. The GDB remote protocol is used between GDB and gdbserver.
• GDB can halt on shared library events and can automatically load shared library symbols when available. Your toolchain should be configured for the default paths on your cross-development system. Alternatively, you can use GDB commands to set the search paths for shared library objects.
• GDB can be used to debug multiple independent processes using multiple concurrent GDB sessions.
• GDB can be configured to follow a forked process on a fork() system call. Its default mode is to continue debugging the parent—the caller of fork().
• GDB has features to facilitate debugging multithreaded applications written to POSIX thread APIs. The current default Linux thread library is the Native POSIX Thread Library (NPTL).
• GDB supports attaching to and detaching from a running process.
15.6.1 Suggestions for Additional Reading
GDB: The GNU Project Debugger
Online documentation
http://sourceware.org/gdb/onlinedocs/
GDB Pocket Reference
Arnold Robbins
O’Reilly Media, 2005