
To visualize the losses for the training, start the TensorBoard server as follows:
tensorboard --logdir=logs
Now, open localhost:6006 in your browser. The SCALARS section of TensorBoard contains plots for both losses, as shown in the following examples:
The loss plot for the discriminator network is shown as follows:

The loss plot for the generator network is shown as follows:
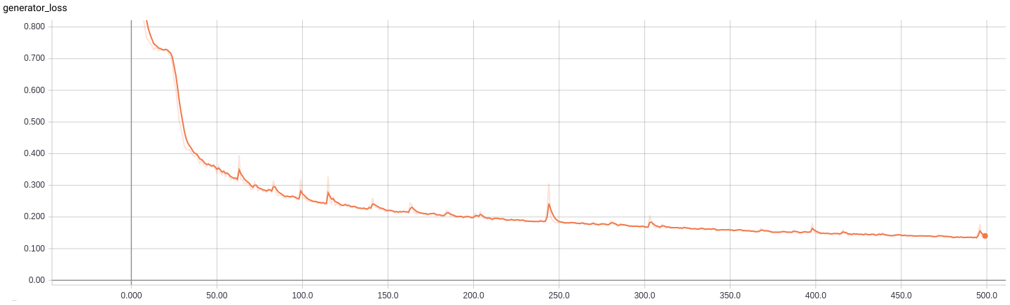
These plots will help you to decide whether to continue or stop the training. If the losses are no longer decreasing, you can stop the training, as there is no chance of improvement. If the losses keep increasing, you must stop the training. Play with the hyperparameters and select a set of hyperparameters that you think can provide better results. If the losses are decreasing gradually, keep training the model.