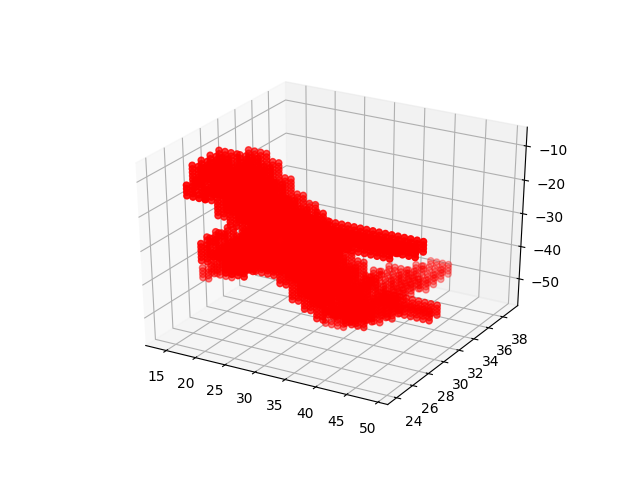
Let's visualize a 3D image using matplotlib, as shown in the following code:
- Start by creating a matplotlib figure and adding a subplot to it:
fig = plt.figure()
ax = fig.gca(projection='3d')
ax.set_aspect('equal')
- Next, add voxels to the plot:
ax.voxels(voxels, edgecolor="red")
- Next, show the figure and save it as an image, so that we can visualize and understand it later:
plt.show()
plt.savefig(file_path)
The first screenshot represents an aircraft in a 3D plane:

The second screenshot represents a table in a 3D plane:

The third screenshot represents a chair in a 3D plane:

We have successfully downloaded, extracted, and explored the dataset. We have also looked at how to use voxels. In the next section, we will implement a 3D-GAN in the Keras framework.
