
Rather than a big list of all the terms, let's go through the basic Tableau life cycle.
When you open Tableau Desktop, you start working on a Workbook. After you've finished working, you will save your work in a .twb or .twbx file. You can open multiple instances of Tableau, each of them being a different Workbook.
The first page you see when you open Tableau Desktop is the Start page. Here, you can connect to data, open recent workbooks, discover the Viz of the Week, and open your saved data sources quickly.
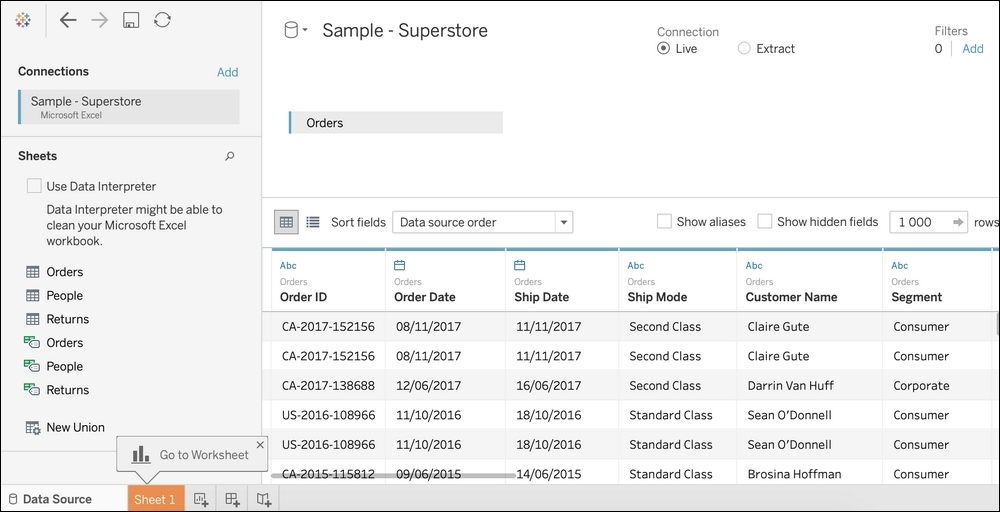
After choosing your connector (a Comma Separated Values (CSV) file, an Excel file, or a database on a server), Tableau opens the data source workplace. On this page, you create the data source by choosing tables (or sheets) and creating joins, unions, or other transformations. The following screenshot illustrates the Data Source workplace:
When you're done with the Data Source, you can start building a visualization in a Worksheet. Sheet 1 is your first Worksheet. Here's the Worksheet workplace:
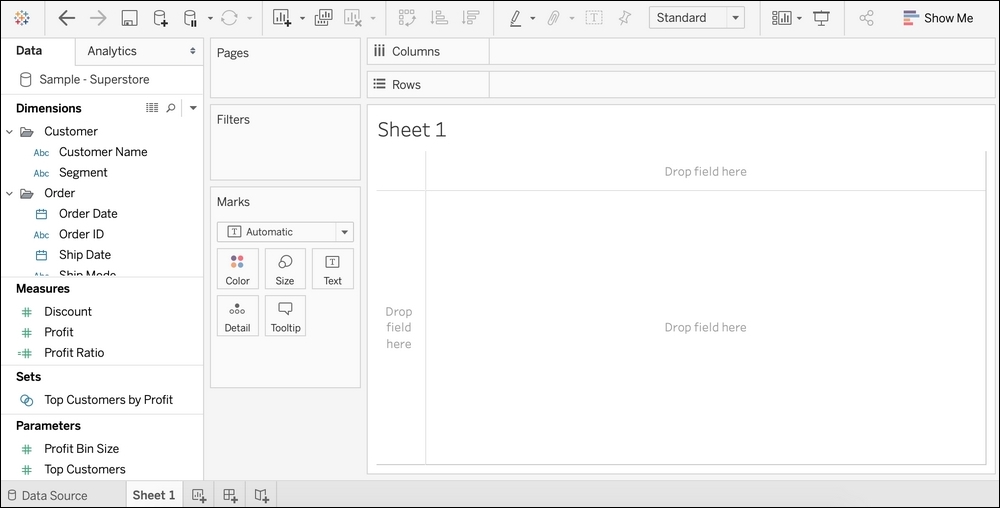
On the left, you can see your Data Source with all the fields split between two elements: Measures and Dimensions. Each field has a data type (Text, Number, Boolean, and so on). Later, you'll learn how to create new fields or elements, such as Groups, Bins, Hierarchies, Sets, Parameters, or Calculated Fields.
The big blank part is the View. It is here that your visualization will be displayed. Around the View, you can see different shelves (Rows, Columns, Pages, Filters, and Marks). To create visualizations, you have to put fields on those shelves. Once a field is on a shelf, it is called a pill. Pills can be green if Continuous, or blue if Discrete.
In the View, every distinct element you can select (click on) is called a Mark. Each Mark has one type (Bar, Circle, Line, and so on) and can have some properties (Color, Size, Label, and so on).
In Tableau, one Worksheet is one idea, one way of answering a question, and one visualization. You can create as many Worksheets as you want to find the best way to represent your data. Once you have enough Worksheets to answer all your questions, you can create a Dashboard.
A Dashboard is a combination of multiple Worksheets and objects (Containers, Image, Extensions, and so on). You can use actions to add interactivity between the different Worksheets.
If you want to tell a Story with your data, you can create a Story. The goal of the Story is to prepare a succession of Story points (each of them could be a Dashboard or a Worksheet). Each Story point is a new insight into your Story where you can customize the filters and captions and add some text. When presenting or sharing a Story, every interaction or explanation is already done.
After all of that, you can publish your Dashboard and Stories by using Tableau Server/Online or Tableau Public Voilà, you're done!
A bit overwhelmed? Don't worry, each chapter of this book focuses on a specific part of Tableau, and you'll have plenty of time to get familiar with these words with real examples. However, two words do require more in-depth explanations: Dimension and Measure.