
There are five Mark properties that are always available: Color, Size, Text/Label, Detail, and Tooltip. There are also three properties available only when using a specific Mark type: Shape, Path, and Angle.
Any unaggregated field, returning more than one value that is used in a Mark property splits the number of Marks (except for the Tooltip property).
For example, if you put a Dimension that contains three different values in the Color property, the number of Marks is split by three.
Let's examine each property with the different options you have to make better visualizations. For each property, you'll find an example that you can reproduce with Sample – Superstore
and
World Indicators.
Note
You can also download the Mark Properties ZIP file from my website (https://tableau2019.ladataviz.com) in Chapter 6, Design Insightful Visualizations, or click on this direct link: http://ladataviz.com/wp-content/uploads/2019/05/Mark-Properties.zip. When you unzip the file, you'll find a Tableau Package Workbook with an example of each Mark type.
Let's start with the most frequently used property: Color.
Color is represented by the following icon: ![]() . It is probably the most useful and widely used property. It can be used to change the color of all the Marks, slice a Mark if you use a Dimension, or display another insight if you use a Measure.
. It is probably the most useful and widely used property. It can be used to change the color of all the Marks, slice a Mark if you use a Dimension, or display another insight if you use a Measure.
If you don't place any fields on the Color property, then clicking on the Color button opens a menu where you can set the color of the Marks, change the opacity, and add borders and a halo. You can also click on More colors... to open a menu where you can choose the exact color of your choice. If you drag and drop a field on Color, Tableau uses colors to add a new layer of information. The behavior is different between a Continuous field and a Discrete field.
If you use a Discrete field (in blue and usually a Dimension), each value of the field has a distinct color. Tableau uses a default set of colors, but you can edit them by clicking on the Color button and then on Edit Colors.
A new window opens where you can choose between different color palettes and assign a specific color to each value. Here's an example of a Discrete field on Color, with the Edit Colors window:
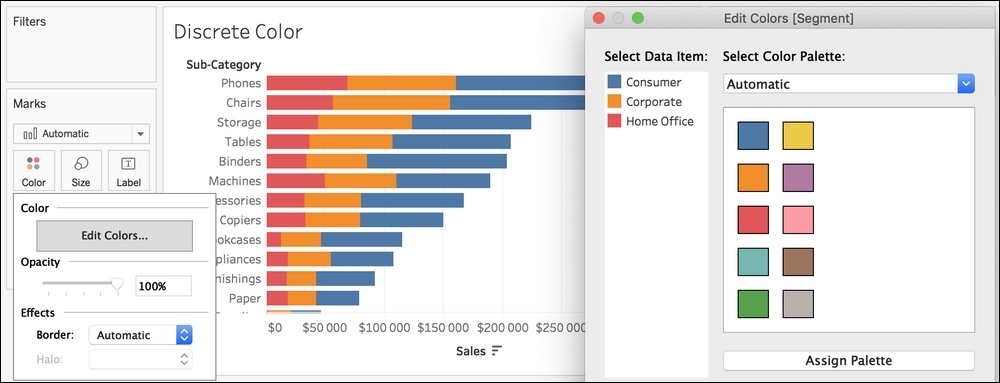
Additionally, on the Edit Colors window, to personalize your visualization even more, you can double-click on a data item to open another menu where you can choose any color of your choice. Using this menu, you can also use a color picker to select a color on your screen.
Note
It's possible to add a custom color palette by editing Preference.tps in your Tableau repository, as explained in the Tableau documentation at https://onlinehelp.tableau.com/current/pro/desktop/en-us/formatting_create_custom_colors.html.
If you use a Continuous field (in green and usually a Measure), Tableau uses a color gradient from the minimum value to the maximum value. If there are positive and negative values, Tableau automatically chooses a diverging palette. Again, the default color palette can be edited by clicking on the Color and Edit Colors options. If you edit the color of a Continuous Field, a different window opens. Here's an example of using a Continuous Field in Color with the Edit Colors window opened:
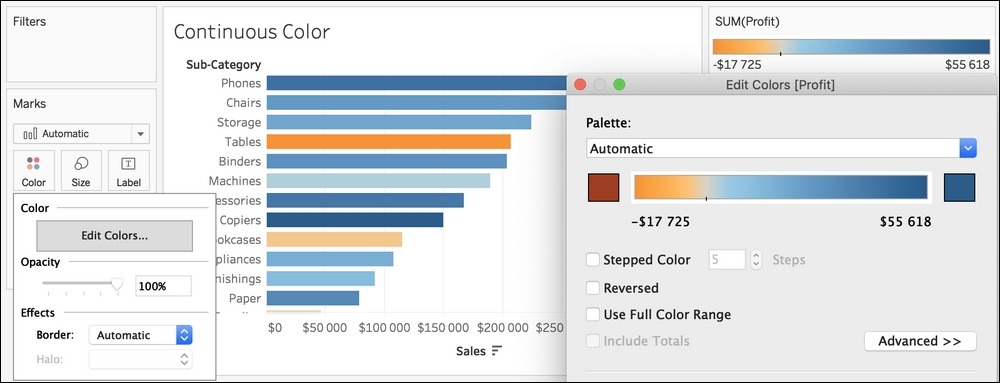
Using this menu, you have many options to configure your palette. You can set the number of steps, reverse the palette and, after clicking on the Advanced button, set the Start, Middle, and Center of the palette. Again, if you click on a color box, it opens an advanced menu to choose the exact color of your choice.
After Color, the second property is Size.
Size is represented by the following icon:  . Size is used almost all the time when designing a visualization. It can be used to simply change the size of the Marks or, as with Color, to add more information.
If you don't put any fields on the Size property, then clicking on the Size button opens a small menu where you can change the size of the Marks. If you put a field on the Size property, the values of the field will be represented with different sizes. If you use a Discrete field, each value has a specific size. If you use a Continuous field, Tableau uses a scale from the minimum value to the maximum value.
The following screenshot is an example of a Continuous field in Size:
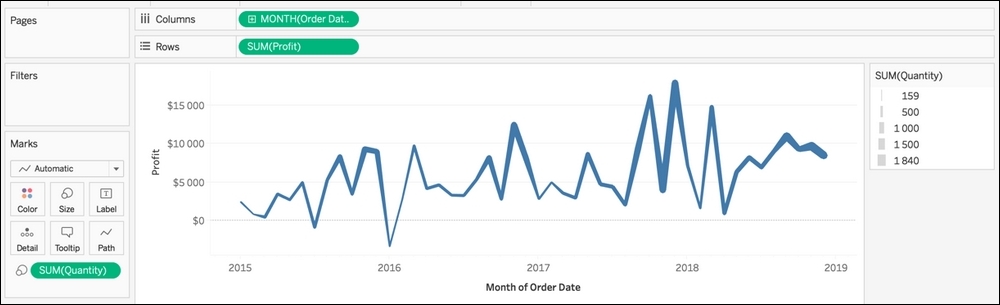
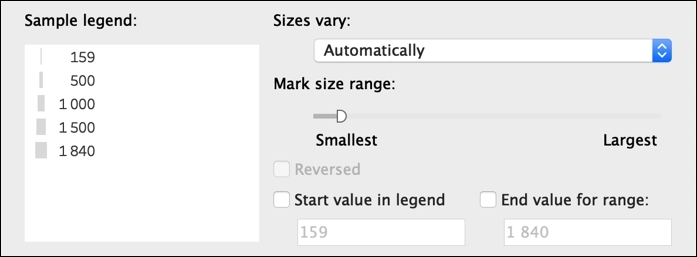
When using a field in the Size property, a legend appears (usually on the right-hand side). If you double-click on the legend, a new menu opens. Using this menu, you can choose how the size varies, but also set the Start, End, and Size range. Here is the menu:
The next property reacts differently depending on the Mark type.
Label (or text) is represented by this icon:  . There are two different cases: when you use the text Mark type, and if you use any other type. In both cases, you can drag and drop multiple fields on the property.
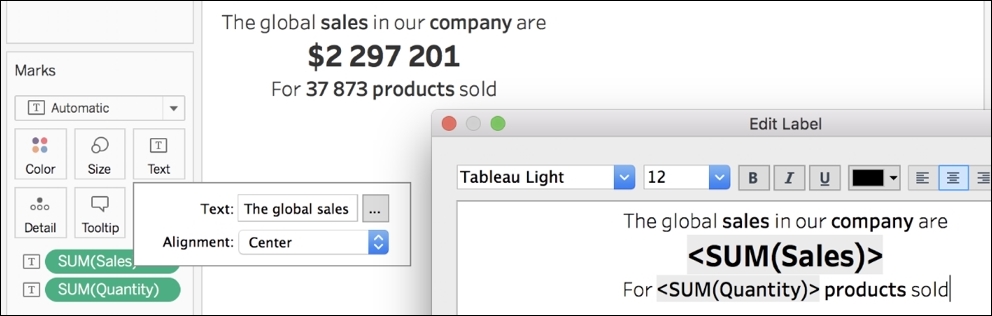
If you use the text Mark type, this property is named Text. If you put a Measure in this property, the aggregated value is displayed. If you put a Dimension in this property, then all the different values are displayed, multiplying the number of Marks.
If you click on the Text button, you'll find an option to change the alignment and, if you click on the box with the three dots (...), Tableau opens the Edit Label window. This window is a text editor where you can modify the font, the size, the color, and write any text you want. Here's an example of Sales and Quantity in Text with the Edit Label window and the result:
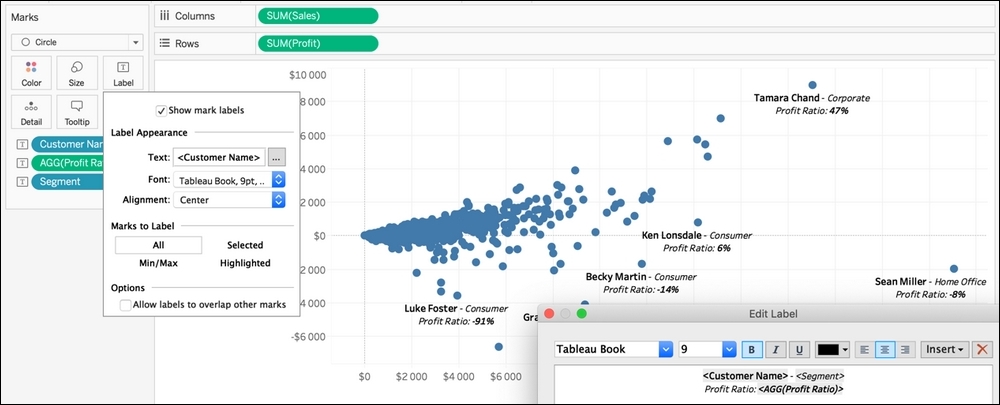
If you use any Mark type other than text, then this property is named Label and you can use it to add a label to the current Marks (on a bar chart or a line chart, for example). The value of a Measure will be displayed in the visualization; a Dimension will split the number of Marks. When you click on the Label button, you'll find many options:
- Show Mark labels is the same as clicking on the
 icon in the toolbar.
- The options under Label Appearance allow you to change the text, the font, and the alignment.
- The buttons under Marks to Label allows you to choose which Marks will have a label. You can add a label to all the Marks, to the maximum or minimum only, to only those that are selected, or to the highlighted ones.
- The last option allows the labels to overlap. By default, Tableau chooses to show the labels only if they don't overlap.
The following screenshot is an example of using a Label to add the Profit Ratio, Segment, and Customer Name information in Circle:
The next property is elementary, but also very useful!
Detail is represented by this icon:  . Like the previous Mark properties, dropping a Dimension on Detail splits the Marks. And that's it! This property does nothing more than splitting the Marks. You can use Detail to show your data at a less aggregated level.
Tooltip is the next property, and it's the only one that doesn't split the Marks.
Tooltip is represented by this icon:  .
.
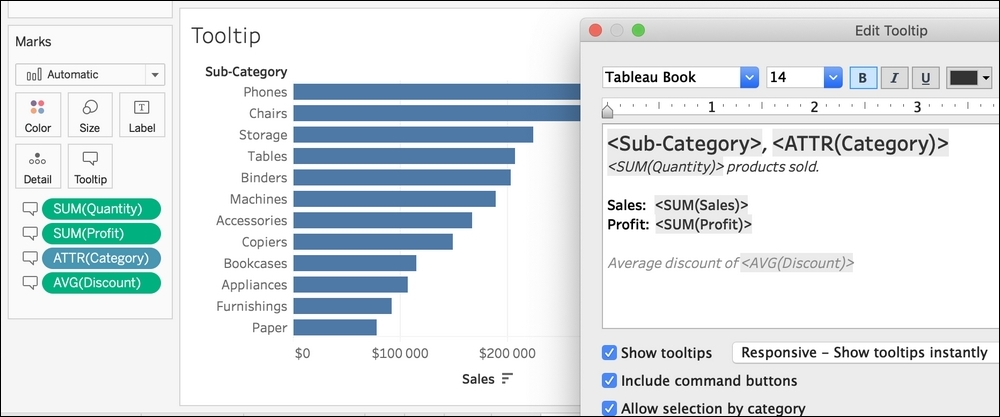
The tooltip is displayed when you hover over a Mark. Any field that you drop on Tooltip is added to the tooltip box. The fields in the tooltip are always aggregated. For Dimensions, Tableau uses a special aggregation, ATTR, to display them. This aggregation returns the value if it's unique, otherwise, it shows *. Clicking on the Tooltip button opens a window where you can edit the text and change a few options.
Here's an example of a customized Tooltip:
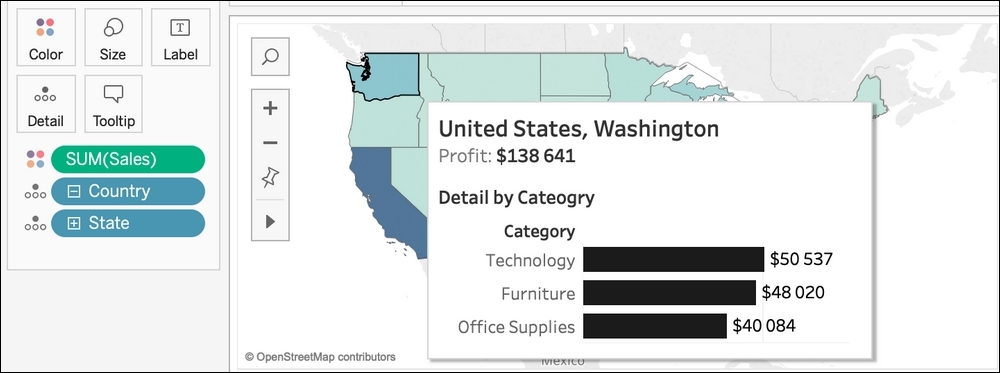
You can also add other Worksheets to the tooltip property. This functionality is called Viz in Tooltip. In the Tooltip editing window, in the top-left corner, you have the option to insert additional information but also other sheets. To learn more about this feature, you can visit https://onlinehelp.tableau.com/current/pro/desktop/en-us/viz_in_tooltip.htm.
Here is an example of a visualization using a Viz in Tooltip:
The next property, Shape, is only available with the Mark type of the same name.
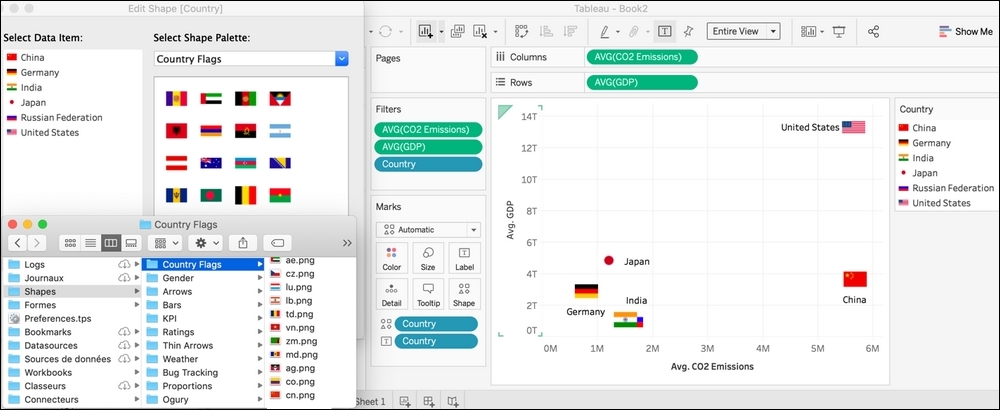
Shape is represented by this icon:  . You can only use a Discrete field with Shape. When you drop a field on the Shape property, the different values of the field are represented with different shapes. When you click on the Shape button, Tableau opens the Edit Shape window where you can, as with color, select predefined shape palettes and assign them to the values.
However, the really interesting aspect of shapes is that you can add custom shapes. You can do this as follows:
- Find the
Shapesfolder in your Tableau repository (usually inside theMy Documentsfolder on your computer). In theShapefolder, you'll find one folder for each shape palette. - Create a new folder, name it as you want, and put different images inside it (
PNG,JPG,BMP, orGIFare accepted). - In Tableau, in the Edit Shape window, click on Reload Shapes, and you'll find your new palette with your custom shapes.
Here is an example of using country flags:
Next, let's see the Path property.
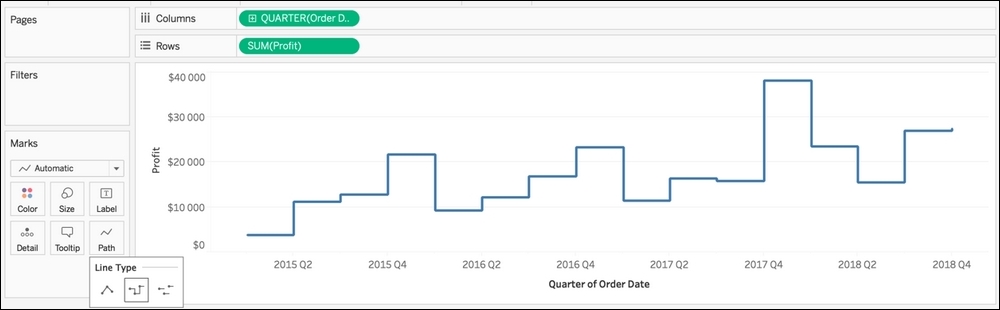
Path is represented by this icon:  . This property is available for both line charts and polygons. If you click on the Path button, Tableau opens a menu where you can select the Line Type: Linear, Step, or Jump. Here's an example of a step line:
This property also allows you to choose the order to connect the Marks. Usually, you only use it if, in your data, there is a special order to connect the Marks to create a specific visualization as for polygons.
The next and final property only exists for pie charts.
Angle is represented by this icon:  . You have to use an angle to create a pie chart and you can only use a Continuous field on Angle. When you use a field on Angle, the values are used to calculate the angle of the different portions of the pie.
You now have all the knowledge you need to build almost every visualization in Tableau, but to truly unleash Tableau's potential, you need to learn what you can do when using multiple Measures at the same time.