
A join creates a data source with columns coming from two (or more) tables. How can you create them? Are there risks? You'll learn everything in this section.
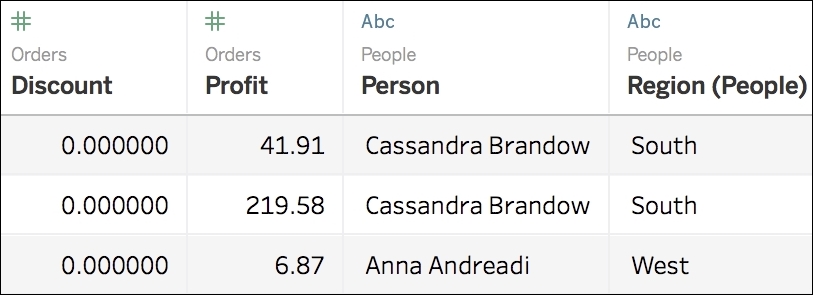
So far, we've only used one table. A join is automatically created when you drag and drop another table next to an existing one in the data source workplace. There is always a left-hand table and a right-hand table. In the following screenshot, you can see a join between Orders (the left-hand table), and People (the right-hand table):

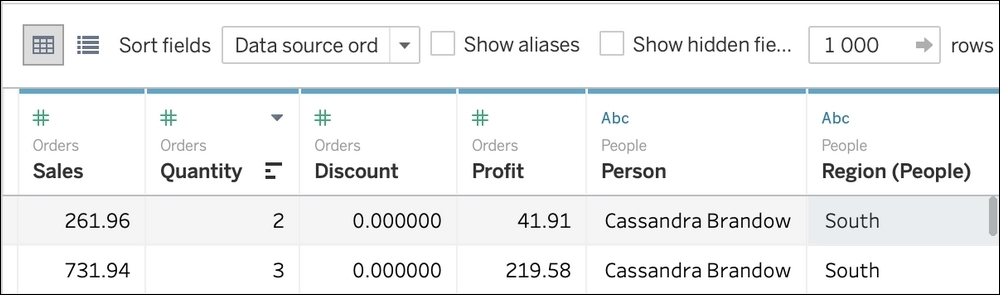
The result of a join is a data source that contains the columns from the different joined tables. As highlighted in the screenshot, you can see that the Profit column comes from the Orders table, and the Person column comes from the People table:
There are four different types of join. We will discover these in the next section.
To create a join between two tables, you need at least one column in each table that contains the same values. These common columns create the link between the two tables.
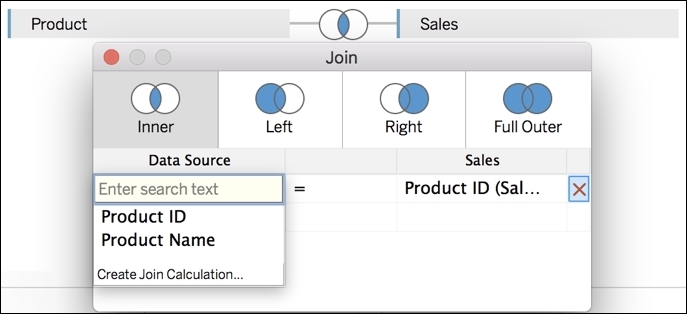
If there are no columns sharing the same name, you have to select the common columns manually in the Join menu that opens when you click on the Join icon. The following screenshot illustrates how you can choose the columns when you click on the icon:
Tip
If the values don't totally match between the common columns, you can click on Create Join Calculation to clean the data (you'll learn how to create a calculation in Chapter 9, An Introduction to Calculations).
Often, you'll have one column in each table, with only some shared values. It's up to you to decide how to deal with the values that don't match by choosing the correct join type: Inner, Left, Right, or Full Outer. To select a join type, click on one of the four icons in the Join menu. Here are the differences between the different type of joins:
- Inner Join
 (default): Keeps only the lines where the values match in both tables.
- Left Join
 : Keeps all the lines from the left-hand table and adds the information from the right table if the values match. If the values don't match, Tableau puts
 nullin the columns coming from the right-hand table. - Right Join
 : Keeps all the lines from the right-hand table and adds the information from the left-hand table if the values match. If the values don't match, Tableau puts
 nullin the columns coming from the left-hand table. - Full Outer
 : Keeps all the lines from the two tables. If the values don't match, Tableau enters
 null.
Enough of the theory–let's create a simple and useful join together.
In this section we'll create a join between the Orders and People tables from Sample – Superstore. Before we start, let's look at what those tables contain:
Ordersis the main table (the left-hand one). We already used it in Chapter 3, Getting Started with Tableau Desktop, and this contains the profit.Peopleis a table that contains only four lines and two columns. It associates a region with a person.
Our goal is to create a data source that allows us to look at the profit (which exists only in the Orders table) by person (which exists only in the People table).
Open a new Tableau file and follow these instructions:
- Select Microsoft Excel in the list of available connections and connect to the
Sample-SuperstoreExcel file in your Tableau repository (use the Connecting to data section from Chapter 3, Getting Started with Tableau Desktop, if you don't remember the file's location). - In the Data Source workspace, drag and drop the
Orderstable. - Drag and drop the
Peopletable next toOrders, as shown in the following screenshot: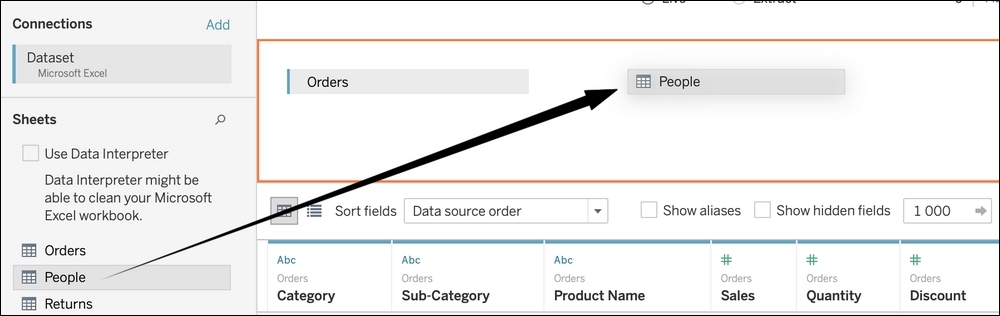
Tableau automatically creates a join between the two tables, with Region as the link, as shown in the following screenshot:
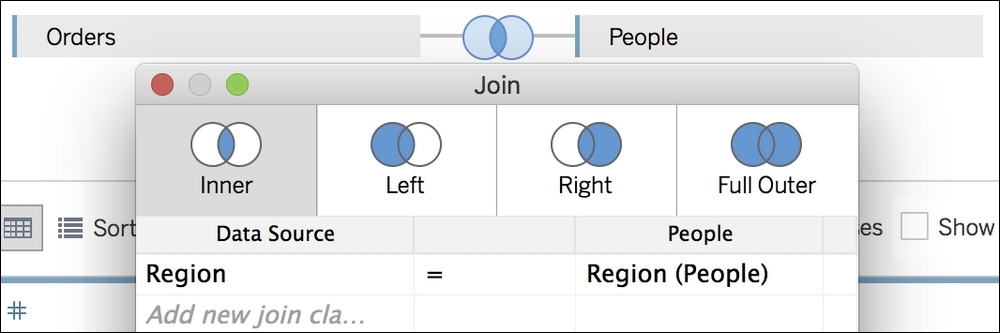
On the preview, you can see that the two new columns from the Person table on the right:
The data source is ready. You can test it on a worksheet and display the profit by person as we wanted.
As you can see, joins are very powerful. Be careful; there are some risks.
The main risk with joins is data duplication. Rather than a theoretical explanation, consider the following example:
Note
If you want to reproduce the example, you can download the Data duplication example file from my website, https://tableau2019.ladataviz.com, as discussed in Chapter 4: Connecting to Data and Simple Transformation section, or go direct to https://ladataviz.com/wp-content/uploads/2018/09/Data-duplication-example.xlsx.
The Data duplication example Excel file contains two sheets: Sales and Product.Sales contains the following data:
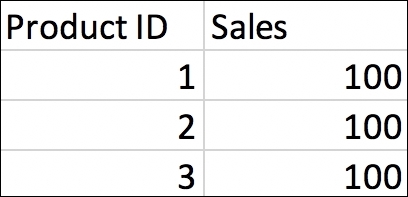
The total volume of sales is 300.
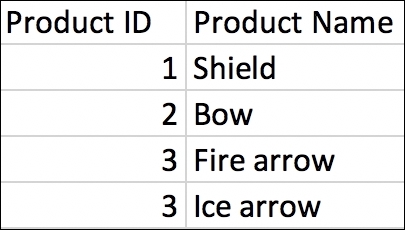
Product contains the following data:
Now, let's join the two tables on the Product ID columns and see what happens. Here's the result in Tableau:
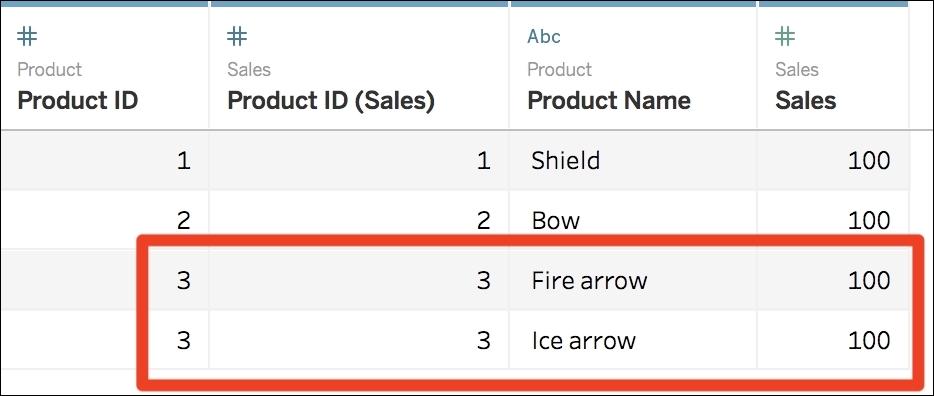
As you can see, the product number 3 is duplicated. The reason for that duplication is because there are two different products in the Product table, with the same Product ID. The total volume of sales here is 400, which is wrong.
When you join tables, be sure that the values you want to analyze won't be duplicated. There are three solutions to dealing with data duplication:
- The easiest solution: Clean the file to remove the duplication. In the example, it means changing the ID of a product to
4. - Use data blending—this is explained in Chapter 11, Advanced Data Connections.
- Use Level of Detail (LOD) calculation functions—this is explained in Chapter 9, An Introduction to Calculations.
After joins, the next interesting feature is unions.