
A field or pill in blue is Discrete. A field or pill in green is Continuous. Dimensions and Measures can be either Continuous or Discrete.
A Discrete field displays each distinct value. Any data types can be expressed in a discrete way. In the View, a Discrete field placed in Rows or Columns is represented with headers.
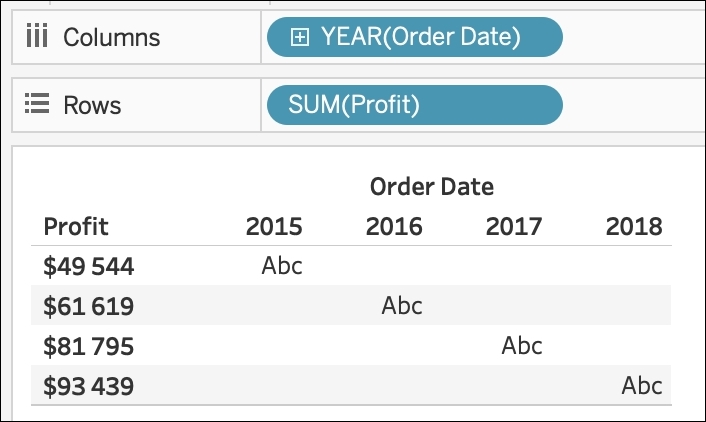
Here is an example of a Dimension (Order Date) and a Discrete Measure (Profit) both as Discrete pills. As you can see, they both have clickable and distinct headers:
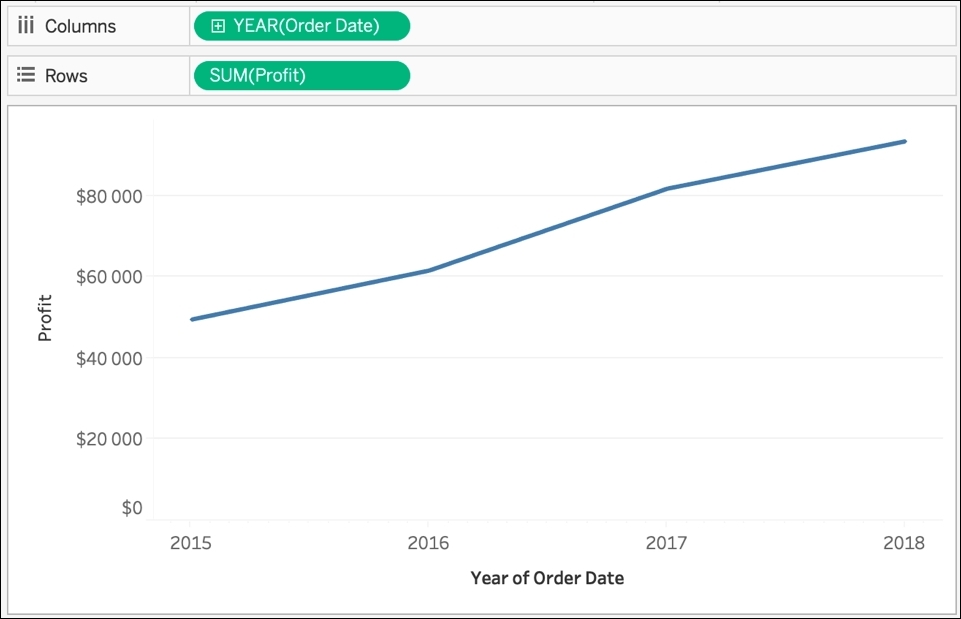
A Continuous field represents values from an infinite set. Only Numbers and Dates can be Continuous. In the View, Continuous fields are represented on an axis. Here is an example using the same Dimension (Order Date) and Measure (SUM(Profit)) fields, but this time as Continuous pills. As you can see, both are displayed using an axis:
It is crucial to understand these differences. It may sound a bit abstract, but it'll help you when you start building visualizations.
Speaking of visualizations, there is a bar that you constantly see when using Tableau: the toolbar. Let's see some of the options available with a single click.