
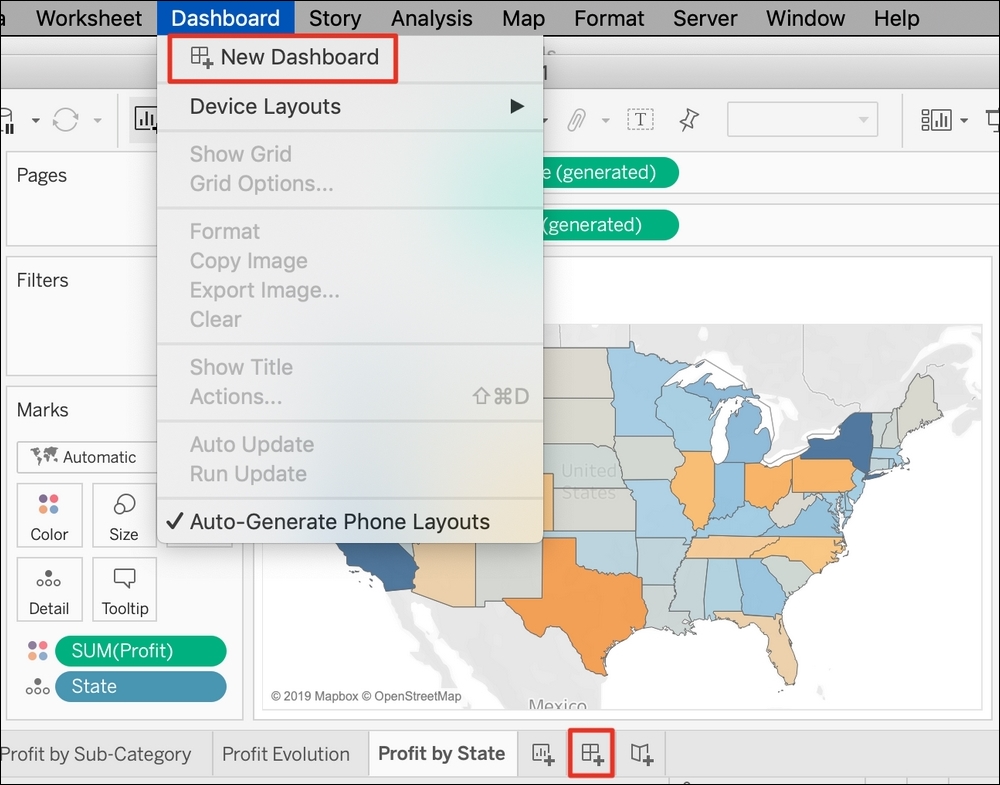
Creating a new Dashboard is as simple as creating a new Worksheet. Choose one of the following options (and find your new favorite one!):
Welcome to the Dashboard workplace:
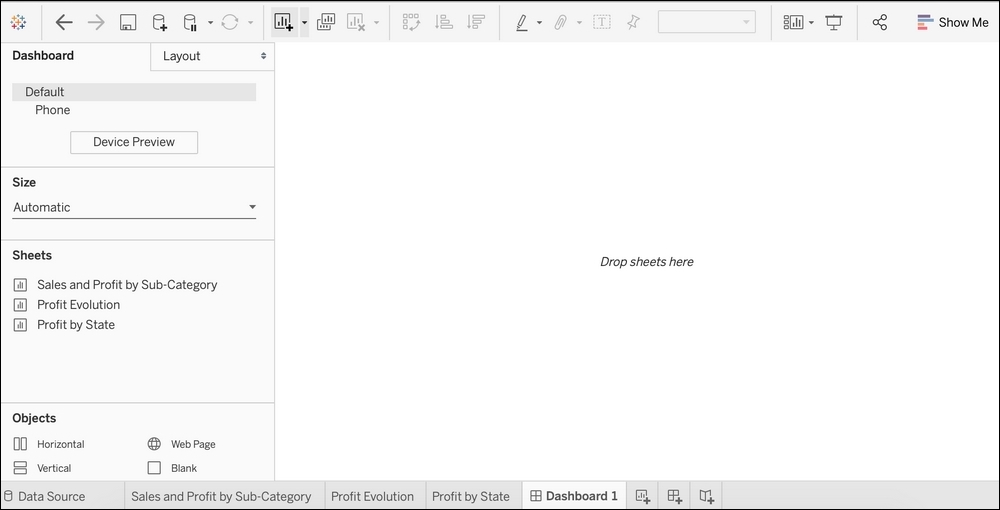
Do you see the three Worksheets that you built on the left? I hope you now understand why renaming them was very important. You don't want many Worksheets named Sheet 1, Sheet 2, Sheet 3, and so on. I've been there and trust me, it's a nightmare!
The first step when you build a Dashboard is to assemble your Worksheets:
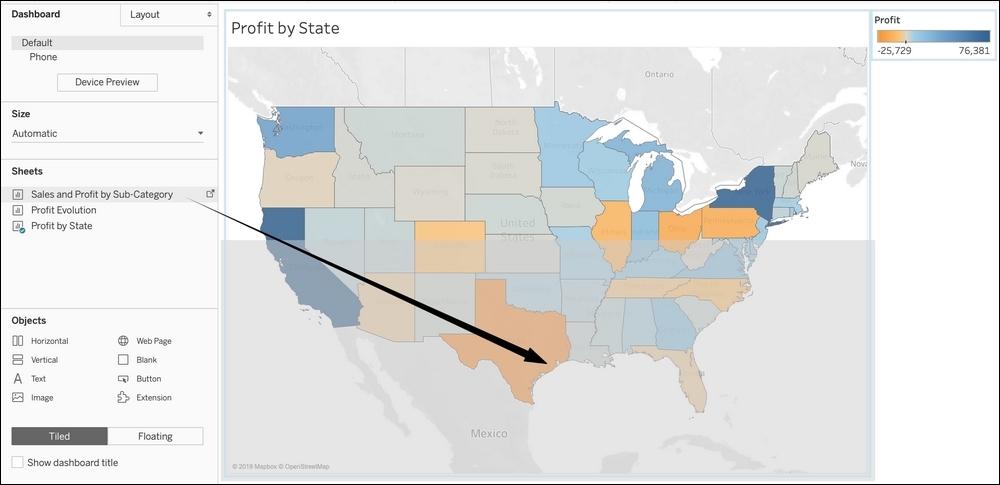
- Drag and drop the Profit by State Worksheet where Tableau invites you to do so.
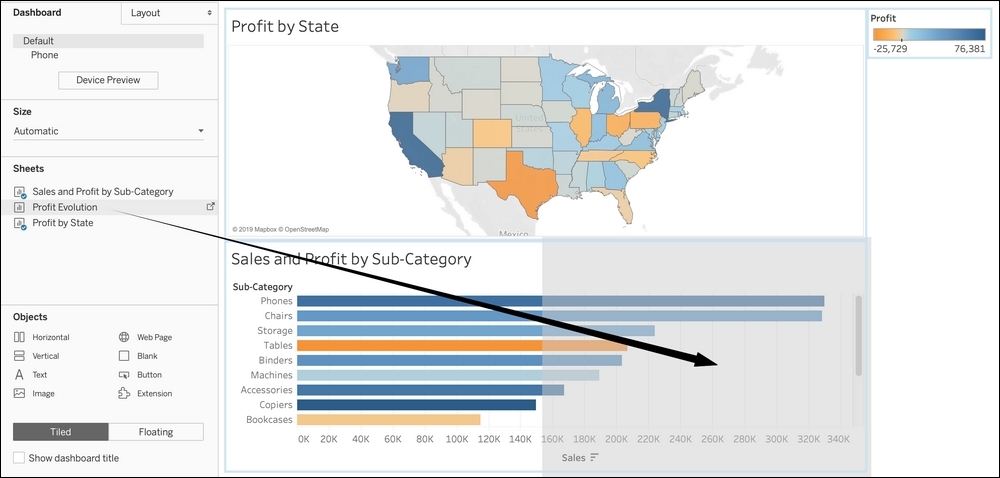
- Drag and drop the Sales and profit by Sub-Category Worksheet beneath the map. The gray area helps you see where the Worksheets are going to be placed:
- Drag and drop the Profit Evolution Worksheet on the right-hand side of Sales and profit by Sub-Category. Again, use the gray area to preview the location, as demonstrated in the following screenshot:
- Double-click on Dashboard 1 at the bottom and rename your Dashboard
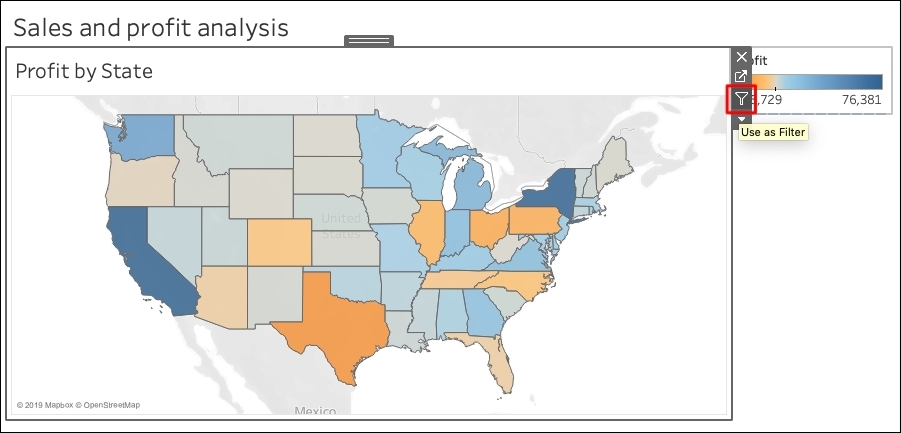
Sales and profit analysis. - Click on the Show dashboard title checkbox on the left-hand pane to display the title.
Congratulations – you've built your first Dashboard!
So, is that it? Of course not—the magic starts in the next section.
Be careful; this is going to be quick:
- On the Dashboard, click on the Profit by State Worksheet to select it (there is a gray outline once it's selected).
- Click on the funnel icon, that is, the third one that appears. Notice that it turns white once you've clicked on it. The icon is highlighted in the following screenshot:
- Click on any state on the map and be proud! You just created an interactive dashboard that automatically filters a selected state. You can also use the Ctrl (on Windows) or command (on Mac) keys to select multiple states.
Well, why stop there? You can do the same with Sales and profit by Sub-Category. Just click on the visualization, and then on the funnel icon, and voilà—you can filter the Dashboard by sub-category.
The Dashboard tutorial is now over. I hope that you are as amazed as I was the first time someone showed me how to build a Dashboard in Tableau. We recommend that you don't skip the final part, where we are going to use Tableau as a data exploration tool.