
Hierarchies are quite special. A hierarchy is a group of multiple dimensions. However, a hierarchy doesn't just affect the data source, but also the visualization and the way the users can interact with it. A hierarchy creates a relationship between different dimensions, such as a parent-child relationship.
The dedicated icon for Hierarchies is ![]() .
.
Note
Hierarchies are crucial for geographical roles. If you try to build a visualization in a city level without a hierarchy, lots of cities won't be displayed because their names are ambiguous (that is, they exist in multiple countries). By creating a hierarchy with a country-level field and a region-level field, there is no more ambiguity.
Dates, for example, are a hierarchy. A day is included in a week, which is included in a month and a year. If you use a date in a Worksheet, then Tableau automatically selects the YEAR and shows a small + in the pill, on the left-side of its name. This means that the dimension is a parent in a hierarchy where there are children. This is illustrated in the following screenshot:
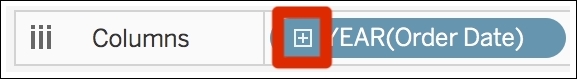
Once you click on the + icon, the child dimension is added next to the parent, and the + icon switches to a - icon. The child can also be a parent of another dimension, and so on.
That's enough for the theory; let's create a hierarchy and use it. You can reproduce the following example using the Sample - Superstore dataset:
- Select Category and Sub-Category.
- Right-click on one of the selected Dimensions and go to Hierarchy, and then click on Create Hierarchy....
- A new window opens asking for the name of the hierarchy; let's name it
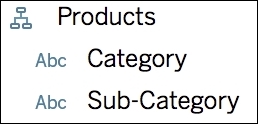
Products. - The hierarchy is created, and you should see a new icon in your Data pane, with the Category and Sub-Category fields under it. Your hierarchy should look similar to the following screenshot:
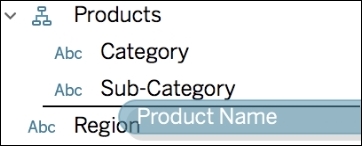
- Let's add Product Name in the hierarchy, at the bottom. To do that, you can drag and drop the field under Sub-Category:
- Double-click on Category, and then on Profit. This creates a simple table. You can see the + icon next to the Category pill. You can also see the + icon when you hover over the values in View:
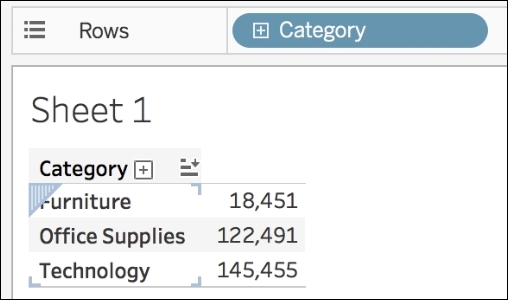
- Click on +; Tableau automatically adds the child, Sub-Category. From here, you can go deeper in the Product Name field using +, or remove Sub-Category using -.
Hierarchies are useful and powerful tools. We recommend that you use them when you can. Let's finish this chapter with the final option: creating groups, sets, and bins.