
Chapter 3
Abrasive Processes
Ioan D. Marinescu*
Brian Rowe†
Yin Ling‡
Abstract
The term abrasive machining usually describes processes in which the individual cutting edges are not only distributed but also more randomly oriented.
There are several processes and types with various bases for their typology. The type of tool is accepted as the first classification criterion.
Keywords
Bonded Abrasive Processes
Loose abrasives
Abrasive Finishing Processes
Single Point Scratch Tests
Grinding Energy
3.1. Typology of abrasive processes [1,2]
The term abrasive machining usually describes processes in which the individual cutting edges are not only distributed but also more randomly oriented.
There are several processes and types with various bases for their typology. The type of tool is accepted as the first classification criterion.
Bonded Abrasive Processes
Grinding
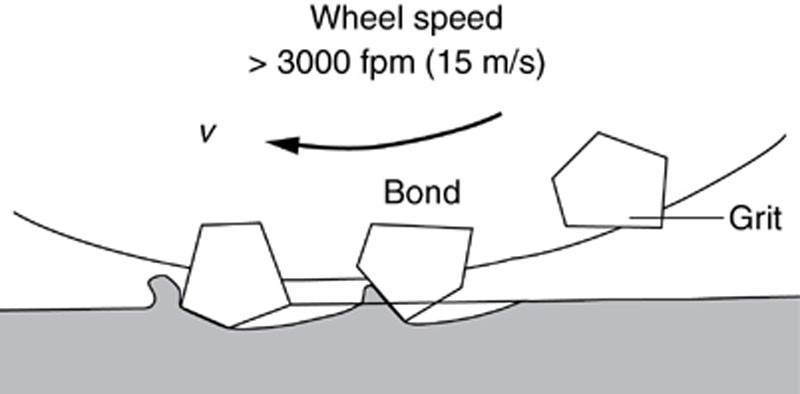
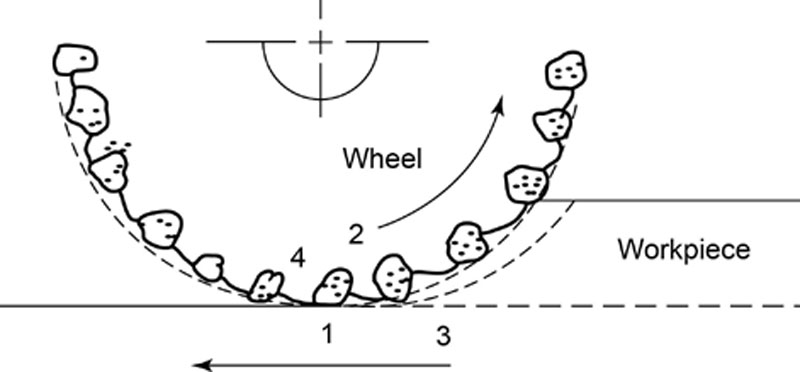
The grinding process is most easily understood with reference to the abrasive grits (hard particles with sharp edges) bonded into a wheel which rotates with a high speed. The orientation of individual grains is random; therefore, a grain may encounter the workpiece surface with a positive, zero, or, as is most likely, with a negative rake angle (Figure 3.1). The consequences of this process depend on the depth of engagement.
The geometry of grinding is as multivariable as other machining processes (Figure 3.2). Some common grinding operations include surface grinding with a horizontal spindle (Figure 3.2a), surface grinding with a vertical spindle (Figure 3.2b), cylindrical grinding (Figure 3.2c), internal grinding (Figure 3.2d), centerless grinding (Figure 3.2e), and form (plunge) grinding in (Figure 3.2f).
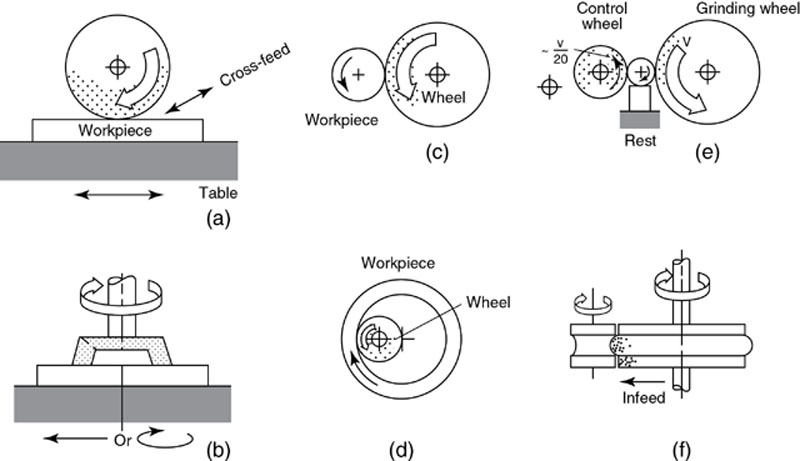
Figure 3.2 Various grinding processes: (a) Surface grinding, hortizontal spindle; (b) Surface grinding, vertical spindle; (c) Cylindrical grinding; (d) Internal grinding; (e) Centerless grinding; and (f) Form (plunge) grinding [1]
Coated Abrasive Machining
The abrasive grit may be bonded to a paper, fabric, or metal surface with a water-soluble or water-resistant adhesive. The grit is spaced in a controlled manner and is often deposited electrostatically to align its sharp edges perpendicular to the backing surface.
Honing
Honing is the finishing process that renders the smoothest surface texture and the greatest accuracy. The abrasive is made into a slab (stone, stick), and is moved in a rapid oscillating motion over the surface (usually a hole) to be finished (Figure 3.3a). Superfinishing is a variant in which oscillating motion is imparted to a fairly large stone, and the surface pressure is kept very low. Thus, as the surface becomes flatter, it builds up its own hydrodynamic lubricant film which terminates the action of the abrasives (Figure 3.3b).
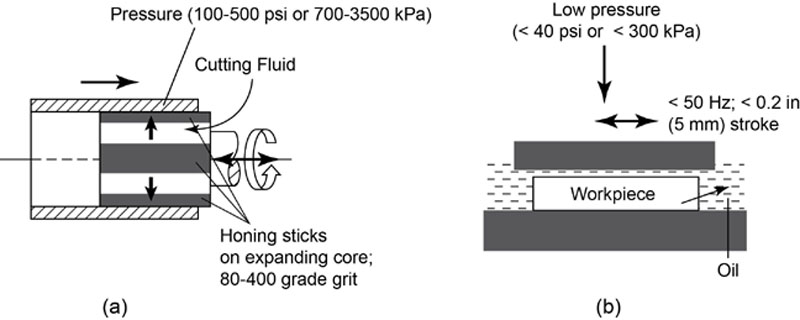
Figure 3.3 Schematic illustration of random-motion abrasive machining with bonded abrasives: (a) Honing and (b) Superfinishing [1]
Machining with Loose Abrasives
Lapping
Lapping is a process that employs a fine, loose abrasive in a fluid suspension to produce very fine surface texture and a high degree of flatness (Figure 3.4a). The workpiece describes a planetary movement and acquires a uniformly-machined, random, flat finish.
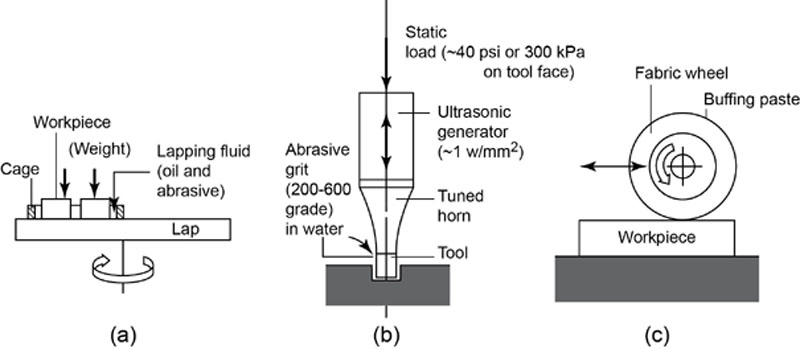
Figure 3.4 Machining with loose (unbonded) abrasives: (a) Lapping, (b) Ultrasonic machining, and (c) Buffing [1]
Ultrasonic Machining
The specialized process of ultrasonic machining utilizes a small-amplitude (about 0.04 mm) and high-frequency vibration (for example, 20,000 Hz). The ultrasonic vibrations, produced by an ultrasonic wave generator, drive the tuned form tool that is made of malleable metal. Abrasive grit is supplied as a slurry to the interface, and the workpiece surface is gradually eroded (Figure 3.4b).
Buffing, Polishing, and Burnishing
In most instances, the abrasive is applied to a soft surface such as the cylindrical surface of a wheel composed of felt or other fabric (Figure 3.4c). For buffing, the abrasive is located in a semisoft binder. The abrasive may be used dry or submerged in oil, water, or other carrier/lubricant for polishing purposes. Both buffing and polishing are capable of producing surfaces of high reflectivity due to a smearing of surface layers but not with greater smoothness. Burnishing more quickly provides the same result, especially for holes. Furthermore, when the burnishing roll penetrates to some depth, it produces a more favorable residual stress pattern. Burnishing is therefore preferred for applications where fatigue resistance is important.
Barrel Finishing
A completely random process, barrel finishing or tumbling is of great value in removing burrs and fins from workpieces and, generally, in improving their surface appearance. In principle, the workpieces are placed into a barrel (often with a many-sided cross section to prevent bunching up of the workpieces). When a barrel is rotated, mutual impact removes surface protuberances. Much-improved surface texture occurs when a tumbling medium is added, either in a liquid carrier (wet) or by itself (dry). The medium is chosen to suit the purpose and may range from metallic or nonmetallic balls to chips, stones, or conventional abrasives.
Grit and Shot Blasting
Abrasive particles are projected with high velocity at the workpiece surface to remove surface films, such as oxides, and to impart to the surface a uniformly mat surface texture. In grit blasting, the particles are irregularly shaped. In shot blasting, the particles are approximately spherical. Controlled shot-blasting promotes plastic surface deformation and residual compressive stresses. The required velocities may be produced by compressed air or high speed wheel rotation with or without paddles. Contact with the wheel accelerates the grit particles.
A closely controlled jet of dry abrasives is sometimes used to cut slots or holes into very hard materials.
A special form of grit blasting is hydrohoning in which the abrasive medium is suspended in a liquid which is then directed onto the surface in the form of a high-pressure jet.
3.2. Tribology of abrasive processes [3–6]
Abrasive finishing processes are manufacturing methods used to generate surfaces of desired characteristics with an economically acceptable rate of surface generation. Invariably, these processes utilize wear-resistant abrasives in the surface generation process. Sometimes, these processes are described as “finishing methods using random cutting edges” to distinguish them from methods which primarily rely on machining with defined cutting edges.
To obtain good surface quality and durability of a workpiece made of a brittle material, it is necessary to identify and use an appropriate process. This area of abrasive technology has developed from a long period of convergence of research in the fields of material science, tribology, and machining technology. The abrasive finishing process can be investigated with experimental and analytical methods, if one focuses on the interactions occurring in the “grinding zone”. The “grinding zone” constitutes a complex friction pair [6], which is suitable for study by using a tribology approach. The objective is to increase the workpiece wear rate (stock removal rate) while reducing the abrasive tool wear rate to a very low level to increase the tool life. The grindability of brittle materials is inversely proportional to the resistance to abrasive wear of the material to be ground. An increase of material removal rate is limited by the reduction in the life of the abrasive tool as well as by reduced quality of the machined surface.
A description of the interactions is followed by their grouping into “machining” and “tribological” interactions at the grinding zone. The understanding, control, and management of these interactions can lead to significant advancements in abrasive finishing processes.
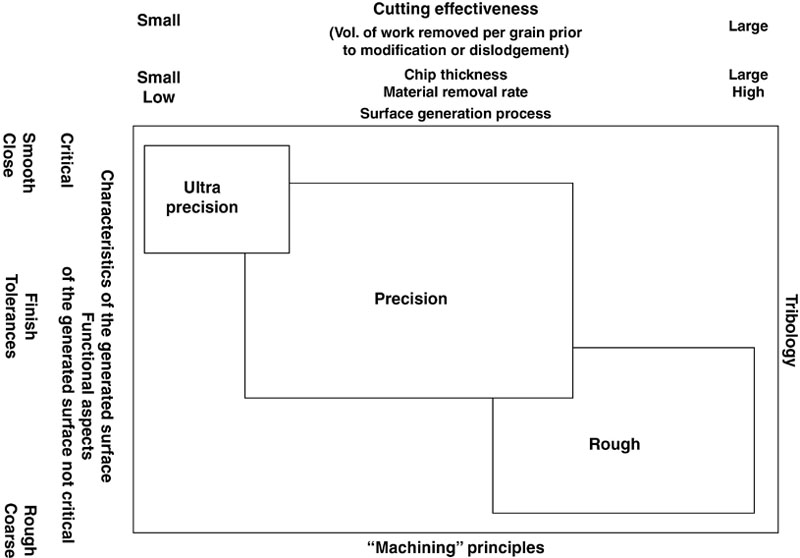
In all abrasive finishing processes, two requirements are observed. One requirement is the generation of the surface and the effectiveness or efficiency with which it is achieved. The second is the characteristics or quality of the generated surface. The two requirements are related to each other, as shown in Figure 3.5.
A Systems Approach for the Abrasive Finishing Processes
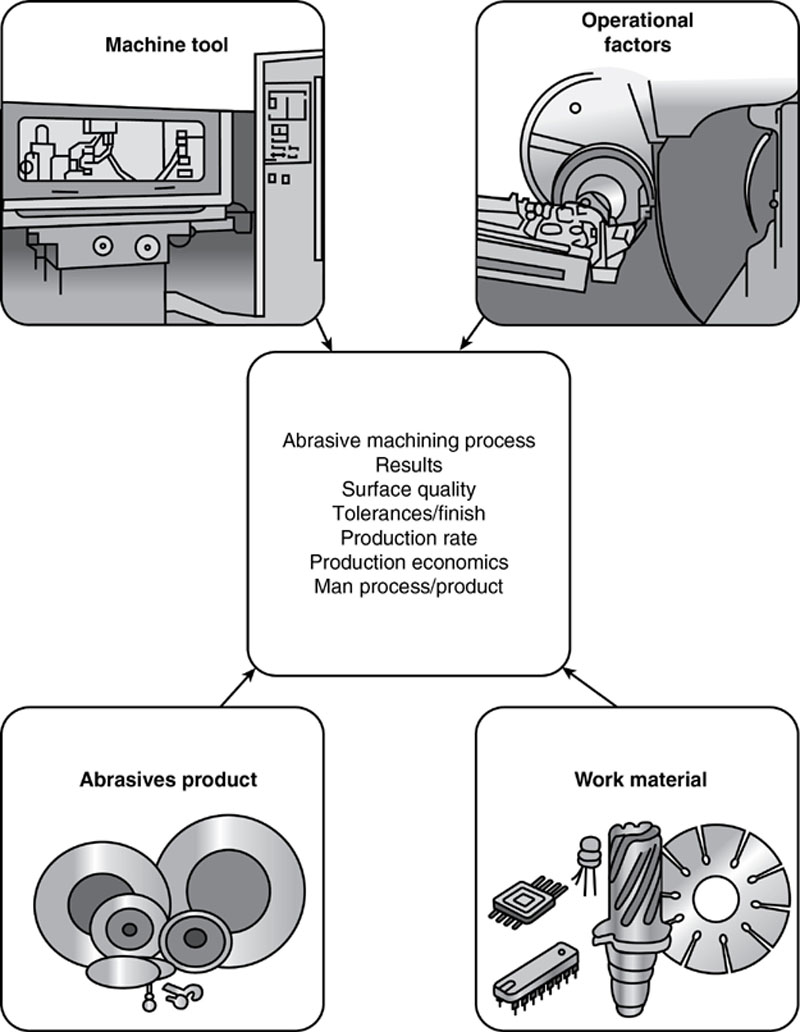
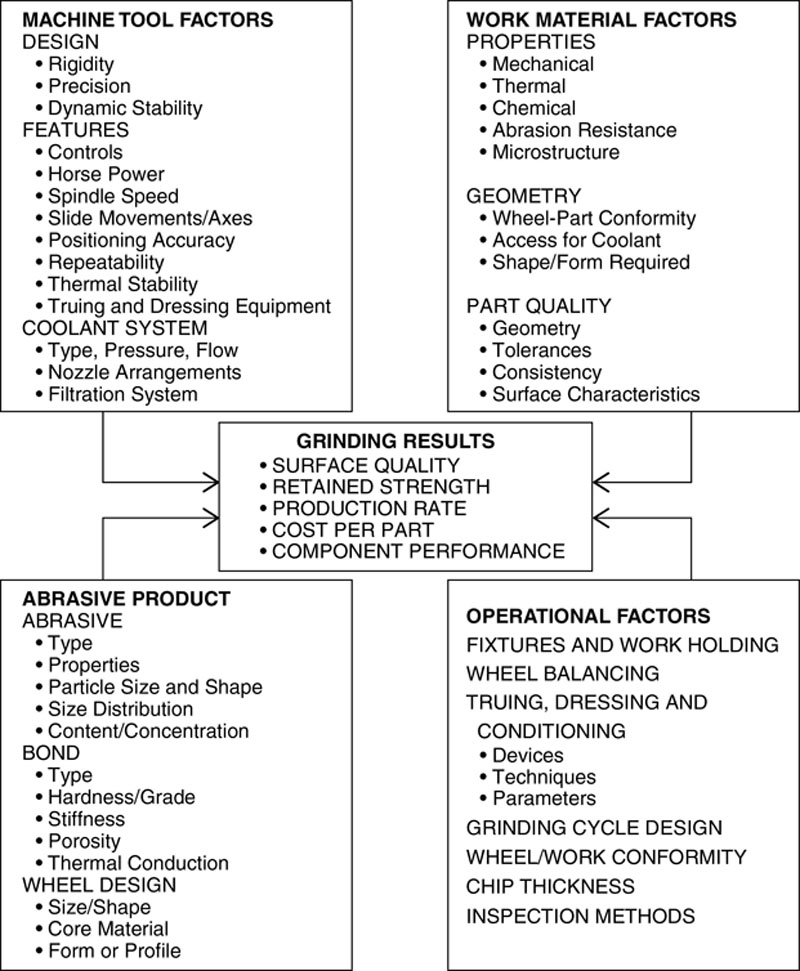
Abrasive finishing processes may be broadly described in terms of the abrasive tool, the machine tool, the work material, and the operational variables. As illustrated in Figure 3.6, these four input groups interact with each other, culminating in the output or abrasive finishing process results. Furthermore, each of these input groupings is multivariable, as described in Table 3.1. Indeed, there exist a few hundred variables for each abrasive finishing process which could cause one to believe that the abrasive finishing process is complex and can only be managed as an art. However, this need not be the case.
Irrespective of the choice of variables in the four input categories, for every abrasive finishing process it is possible to visualize four interactions between the abrasive product and the work material (Figure 3.7). Of these, the abrasive/workpiece interaction is the most critical, which in many respects is analogous to machining processes with cutting tools.
(1) Abrasive/workpiece Interface
(2) Chip/bond Interface
(3) Chip/workpiece Interface
(4) Bond/work Interface
In ceramics grinding, from a tribological viewpoint, to consider the grinding wheel as a microcutting tool is an oversimplication [7]. The random distribution and geometry of abrasive grains on the active surface of the wheel are modified during the grinding process. The modifications are due to the simultaneous actions in the contact zone involving three different mechanisms: microcutting, plowing, and rubbing [8]. In addition to the effects on distribution and micro-geometry, the abrasive process is also affected by the type of bond, the nature of the workpiece material and coolant, and by the mechanical working parameters [9,10].
Tribometers with monograins [11,12] can model very simplified abrasion machining processes without indicating the type of wear of abrasion materials from tools for long life. For this purpose, a modern grinding machine with variable speed and high accuracy of depth of cut should be used [13,14]. Table 3.2 proposes the correlation between the main tribological parameters and technological parameters specific to the grinding process.
Table 3.2
Correlation Between Tribological and Technological Parameters [6]
| Tribological parameters | Technological parameters |
| Wear particle width bw [μm] | Equivalent grinding thickness heq [μm] |
| Linear wear of workpiece Dhw [mm] | Ground material thickness Dhw [mm] |
| Linear wear of wheel Dhs [mm] | Radial wear Drs [mm] |
| Workpiece wear Vw [mm3] | Material removal Vw [mm3] |
| Wheel wear Vs [mm3] | Wheel wear Vs [mm3] |
| Wear time ts [s] | Grinding time ts [s] |
| Workpiece wear rate Qw [mm3/s] | Stock removal rate Qw [mm3/s] |
| Wheel wear rate Qs [mm3/s] | Tool time T [h] |
| Wear ratio Φ [-] | Grinding ratio G [-] |
| Load Fn | Normal force Fn |
| Frictional force Ff | Tangential force Ff |
| Friction coefficient μ[-] | Force ratio μA [-] |
| Friction energy Wf [J] | Specific grinding energy u [J/ mm3] |
Tribological Interactions in Abrasive Finishing Processes
Grinding processes for brittle material include cutting (plastic deformation), plowing and rubbing/sliding. The last two mechanisms are characteristic of tribological processes. In order to understand the tribological interactions in brittle material grinding, it is necessary to investigate the interaction between the following:
• Superabrasives-workpiece,
• Workpiece-bond,
• Chip-bond, and
• Chip-workpiece.
The mechanism is complex, and it is necessary to consider the nature of the active layer of the wheel in order to understand the tribological aspects [15].
The relative motion between the wheel and workpiece constitutes a ‘friction-pair’ [16]. If grinding is to be considered as a tribological process the wear of the wheel and of the workpiece must be considered. The wheel wear is defined by Vs, and workpiece wear by Vw, which is the material removal. The grinding ratio G is a convenient indicator of the tool life and tool cost and also gives an indication of correct wheel selection for the performance required.
The dominant wear mechanism of the active abrasive layer appears to be by grain attrition, grain micro-fracture, and abrasion of the bond, rather than poor grit retention caused by weakening of the bond matrix. Figures 3.8a–c and 3.9a, c show the wear flats and fatigue wear induced grain fracture caused by the large compressive stresses.
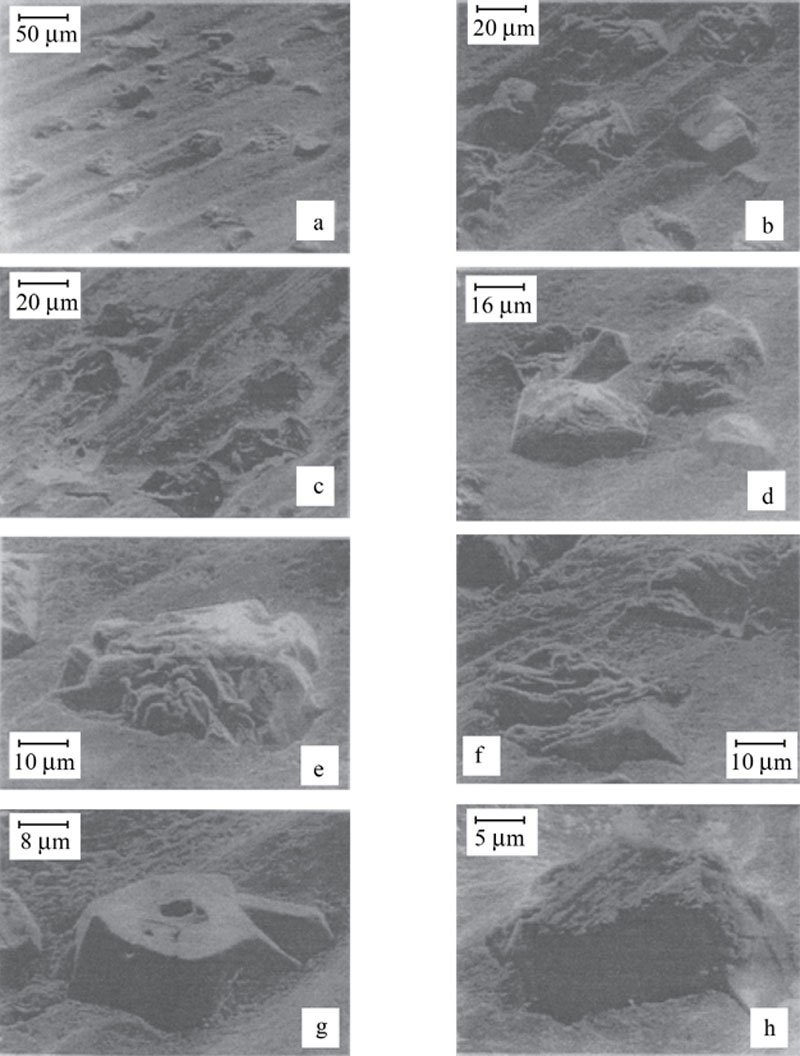
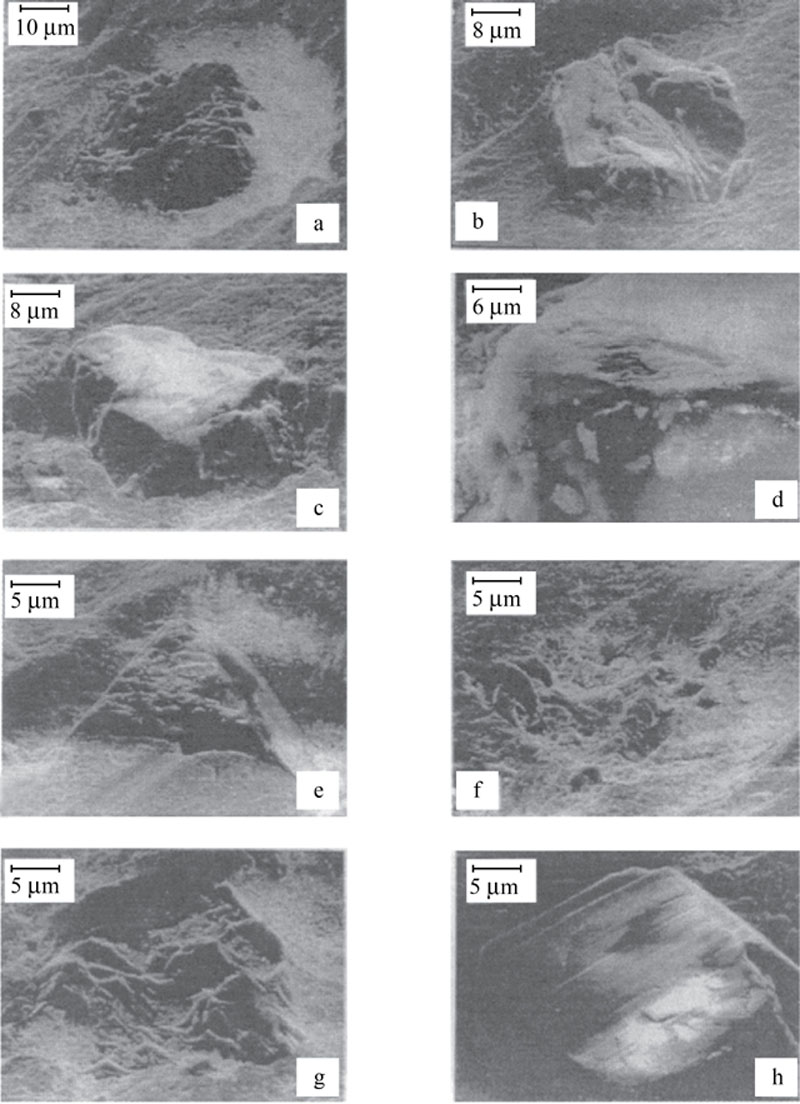
Figure 3.8a–c also shows a relatively uniform distribution of the grains on the active layer surface with a comet-tail effect during the grinding process. In this effect, the bond remaining behind each grain provides a buttressing which has a positive effect upon the retention of the grains in the bond material.
Fatigue wear evidenced by grain and bond fractures provides automatic self-sharpening of the wheel which helps prevent burn due to the development of wear flats. The effect is evident in Figures 3.8d, e and 3.9b, d. The wear flats can be seen in Figure 3.8g, h. These figures also indicate a degree of bond erosion evidenced by loss of grains.
In Figures 3.8h and 3.9d, e, we observe signs of adhesive wear, also known as transfer wear. Small particles are transferred from the work-piece surface to the top of the super-abrasive grain surface. This process is similar to the three body abrasive process but is not a predominant wear mechanism for brittle material grinding.
There are only a few previous studies that attempted to link the wear of diamond wheels with the quality of the obtained surfaces for both brittle materials and ductile material grinding.
3.3. Single point scratch tests
Single point scratch tests have been performed by pin-on-disc sliding, fly-milling, scratching and ploughing, etc. in order to understand the removal mechanisms of ceramics machining and the frictional behavior of diamond abrasives during the machining processes.
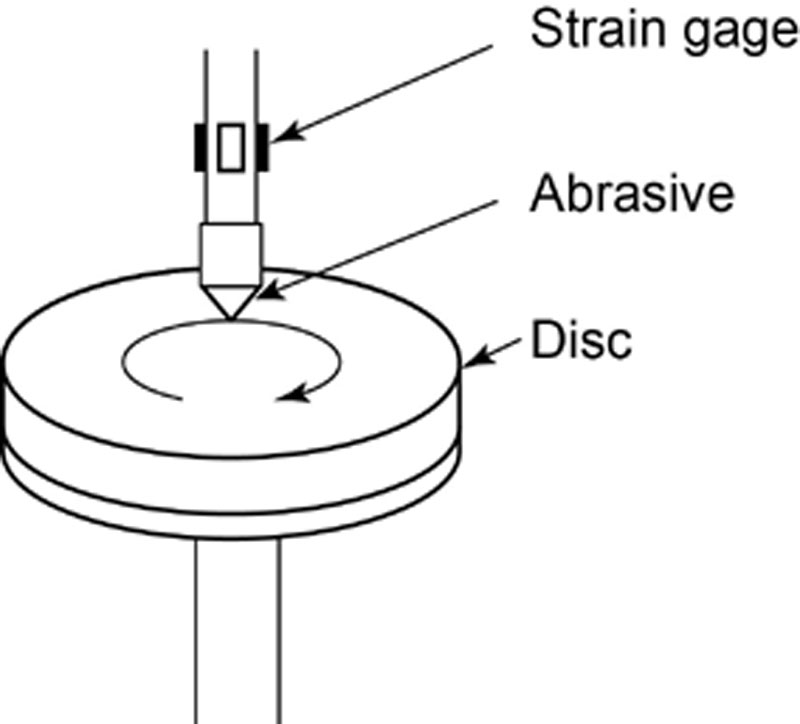
Pin-on-Disc-Sliding [17]
The friction measurement, as well as the abrasive grain wear test, is shown in Figure 3.10. The friction force is measured by a strain gauge mounted on the thin part of the steel holder. Thus, both the variation of the friction force with sliding distance and the coefficient of friction under steady state conditions can be measured. Diamond abrasive grains with a grit size of 2.0 mm are used in the test. The disc (100 to 200 mm in diameter) materials are different ceramics. The vertical load is either 2.5 or 3.5 N and the sliding speed can be varied between 5.0 and 15 m/s. A scanning electron microscope is used to examine the worn surface of the diamond abrasive grains. An abrasive grain slides in its own particular track during the measurement of friction, and each separate grain has its own track. Scatter in the coefficient of friction is small and, therefore, is determined as the average for three individual grains. The wear volume of the diamond abrasive is determined from its loss of height and the worn flat area. Wear tests on the diamond abrasives are carried out at the same speeds and normal loads as in the friction tests, where the sliding distance is almost 4000 m, but the volumetric wear is based on the average of about six experiments due to the increased scatter of the data. The groove volume of wear for the disc is also measured, using a surface profilometer.
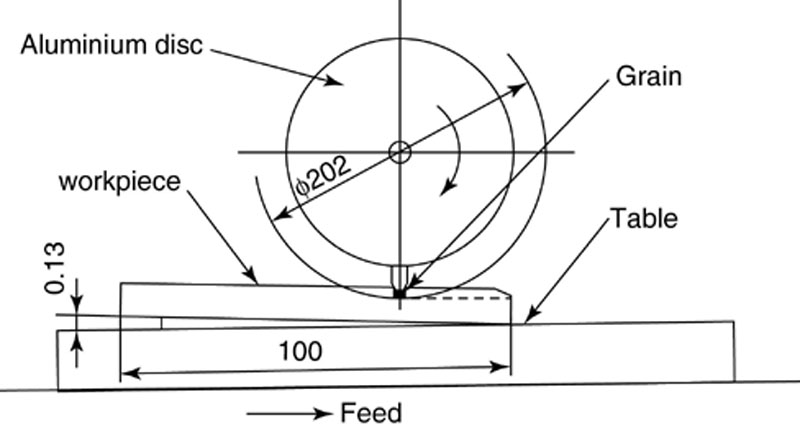
Fly-Milling [18]
Overcut fly-milling tests on diamond abrasive grains are carried out with a surface grinder and with the ceramic workpiece slightly inclined, as shown in Figure 3.11. The method is similar to that of Stanislao (1969) and Brecker (1973). When making a measurement, the metal wheel is lowered until it just touches the workpiece surface at its lowest end. As the workpiece is fed past the wheel, the depth of the groove is automatically increased, due to the slope of the work surface (but it may cycled up and down if the abrasive grain chips). Each subsequent cut increases in depth, until the grain fractures, while attrition wear of the tip occurs. The measurement of attritious wear is made by tracing across the grooves with a stylus instrument to determine the decrease in depth of cut between successive grooves. The conditions for the fly-milling tests can be chosen in accordance with surface grinding parameters. The scratched grooves and worn diamond grains can be examined by a scanning electron microscope.
Scratching and Ploughing [19]
Figure 3.12 diagrams an apparatus used for scratching experiments. The sample S is moved horizontally underneath the diamond D by the micromanipulator Mi, which is driven by the motor Mo. The diamond is attached to the arm A of a balance. This arm is connected to the frame by a leaf spring LS, so that it can be swung up and down but remain stiff horizontally. The balance is brought to equilibrium and displaced vertically until the diamond just touches the ceramic sample; the desired load L is then applied. The tangential force on the sample is measured by the strain gauges SG on the bending element BE (Figure 3.12b). In experiments, diamonds were ground to the shape of a square pyramid; the scratches were made in the one plane as in Figure 3.13. The scratching speed was 1 μm/s.
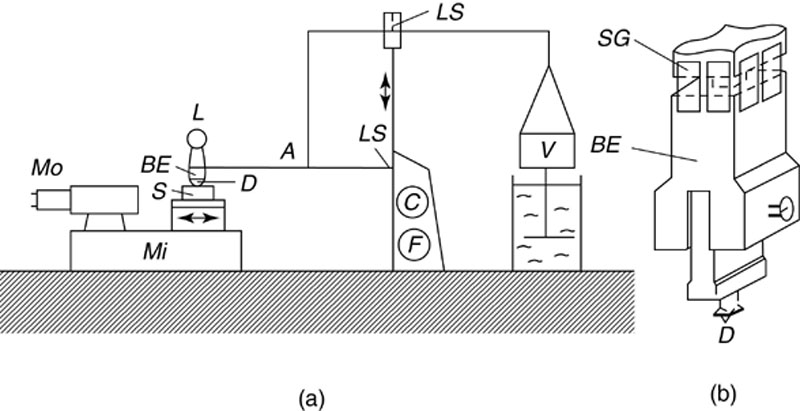
Figure 3.12 (a) Diagram of the apparatus. The sample S is displaced underneath the diamond D by the motor Mo and the micromanipulator Mi. The diamond is attached by the bending element BE to the balance arm A, which can be swung up and down but is stiff horizontally. After the balance has been brought to equilibrium and adjusted vertically the load L is applied. C, F coarse and fine vertical adjustment. V counterweight and damper. LS leaf springs, (b) The bending element BE with the diamond D and strain gauges SG for measuring the tangential force [19]
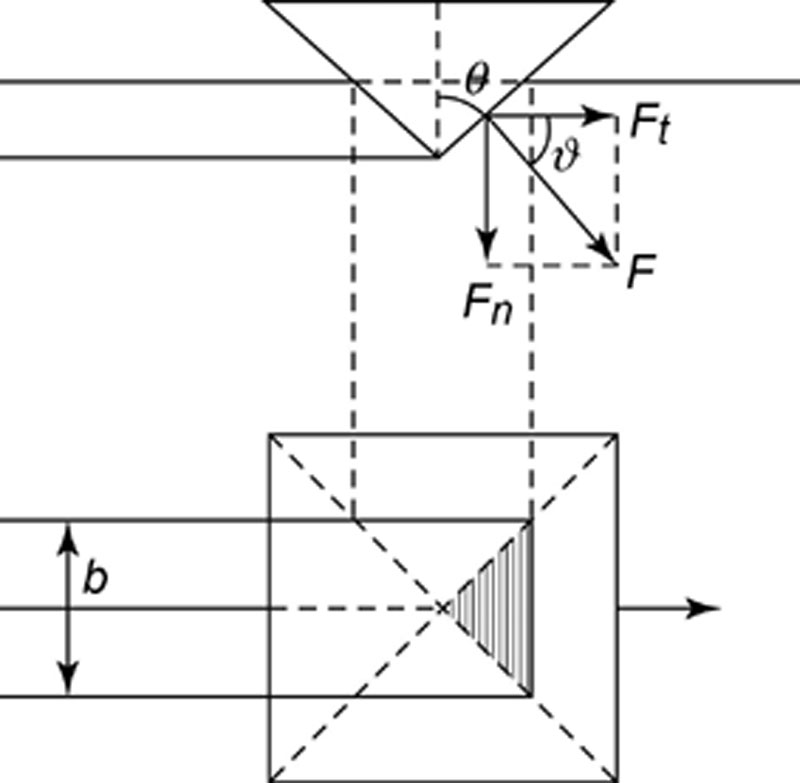
Figure 3.13 Geometry of diamond and groove; vertical longitudinal section and plan view. The diamond is a square pyramid (half apex angle θ) that moves with one plane leading. F is the force the diamond exerts on the sample, Ft is the tangential component and Fn the normal component, b is the groove width. (‘Tangential’ and ‘normal’ relate to the surface of the sample, not to the leading plane of the diamond). In the ploughing model in its simplest form is perpendicular to the leading plane [19]
Scratching and Indenting [20]
A specially designed nano-indentation and scratching system used in ceramic damage tests is illustrated in Figure 3.14; it includes several improvements over an earlier system. It includes an electromagnetic driver with attached diamond tool (indenter) and a position-determining eddy current sensor. The sensor measures the relative displacement between the diamond tool and the test specimen. Some elastic deflection of the system is included in the measured displacement but constitutes a small proportion of the signal, e.g. 40 nm at a load of 300 mN. A computer-controlled digital waveform is fed to the driver to apply the load to the tool. Vertical position measurement sensitivity is about 1 nm and loads are directly measured by a load cell to about 0.1 mN. Thermal drift of the system in the vertical direction is monitored and automatically corrected by the system software. A digitally-controlled X-Y position stage allows generation of multiple indentation patterns of any form and also permits scratching by translation of the specimen during indenter loading.
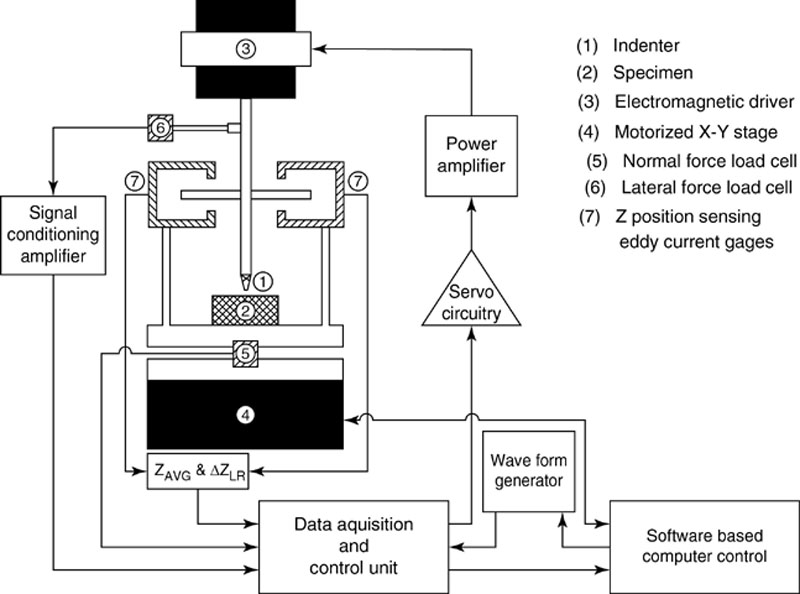
The load-time waveform used for indentation in these studies was basically triangular, typically ramping linearly from zero to maximum set load in 60 s, then holding for 5 s, before ramping to zero load in 60 s. Surface contact (zero depth) was determined by the change in the indenter tip vibration amplitude as it moved into actual contact with the specimen surface. Scratching was conducted in this work at selected loads over the range 5-500 mN. Either stepped (constant) or linear increasing load waveforms were used for the individual scratches. For example, in one study, sets of five scratches with 80 μm length were programmed with different linear ramping loads of 10-40, 40-80, 80-120, 120-160 and 160-200 mN. The ramping load scratches made it possible to detect threshold load values for cracking. The stepped-load scratches were used to examine uniformity of material response, e.g. from grain to grain, at each load increment. In a typical test, motion was not started until the load had been increased to the desired value. At the conclusion of the scratch, stage motion was stopped and the load was ramped down to zero. Scratching speed was in the range 2-10 μm s-1 for all tests. A load cell measured the lateral force resisting the scratching of the material, and an eddy current sensor provided tool penetration data. Analysis of data recorded during testing along with post-test scanning electron microscope (SEM) observations of scratch damage morphology provide information about the scratching and indenting process.
Two diamond tool shapes are used, one of which is a four-sided diamond pyramid. Vickers indenter with a tip angle of 136°, face-to-face. The shape of the tip apex (determined from SEM photographs) consists of a short wedge tip segment of length 300 nm. Another tool is wedge-shaped with a curved edge (0.5 mm radius), a -45° rake angle and an 8° clearance angle. The edge is oriented perpendicular to the sliding direction. This type of tool is used in single-point diamond turning of crystalline materials. Illustrations of both tools are found in Figure 3.15. The curved edge scratching tool is expected to produce a more elastically stressed volume because of a wider contact width and area, higher compressive stresses ahead of the tool (due to the flat face-on orientation), and a lower average contact pressure for a given load. The Vickers diamond pyramid, moved along an edge, is expected to produce more shearing and lateral displacement of the material ahead of the tool. Wear of the pyramid tool occurs and necessitates occasional tool replacement while wear of the curved edge tool is barely noticeable.
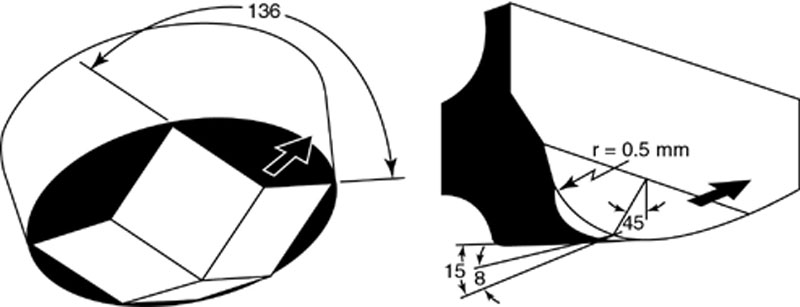
Figure 3.15 Schematic illustration of the two diamond tool shapes used, (a) Pyramidal (vickers) and (b) Wedge-shaped, curved edge [20]
The environments in which indenting and controlled scratching are carried out include air (RH = 25-50%), deionized water, purified mineral oil, mineral oil with 0.25 wt.% stearic acid and two water-based commercial grinding fluids containing chemical additives. The liquid environments are freshly applied prior to each test, and some make-up liquid is added as required during the test.
The single point scratch tests provide a better understanding of the microprocesses. The experimental conditions can be clearly defined, e.g. for the geometry of the diamond and force on the diamond. However, grinding is a multi-point process. Grinding experiments with diamond wheels are necessary for the investigation of mechanisms of machining ceramics.
3.4. Multi point scratch tests
Grinding is a complex process. As the abrasive particles scratch the surface of the material several different microprocesses come into play (flow, cracking, fracture). The result depends on a number of factors, including the shape, force and the velocity of the particles, the humidity of the environment, the hardness and the crack resistance of the material and the distribution of microcracks, cavities, and other flaws in the materials. In view of cost and the importance of grinding for workpiece quality, it is useful to closely analyze this complicated process. Many researchers have been working on ceramics grinding. In general terms, the objectives of the investigation are to find out how the specific energy, i.e. the energy required for the removal of unit volume of the material, and the damage to the surface of the workpiece depend on the setting of the grinding machine and the properties of the materials. Unfortunately, ceramics are much more susceptible to surface damage during grinding than are metals, and their subsequent behavior under load is much less forgiving of induced grinding damage. Furthermore, of all the conventional machining processes, grinding is usually the most expensive per unit volume of stock removal. In the manufacture of precision components, grinding alone may constitute a significant portion of the total cost [21]. Therefore, the economic feasibility and competitiveness of high performance ceramics depends significantly on how efficiently they can be machined by grinding. Reduction of grinding costs by operating at faster stock removal rates is constrained mainly by surface damage to the workpiece, and this factor is especially critical for grinding of ceramic materials. Efficient grinding of high performance ceramic materials requires identification and control of the grinding conditions to maximize the removal rate while maintaining the required surface integrity.
The machining approach to investigating grinding mechanisms typically involves measurement of grinding forces coupled with microscopic observations of grinding debris and surface morphology. A fundamental parameter derived from force measurements is the specific grinding energy. Any proposed mechanisms of abrasive workpiece interactions must be consistent with the magnitude of the specific energy and its dependence on the operating parameters.
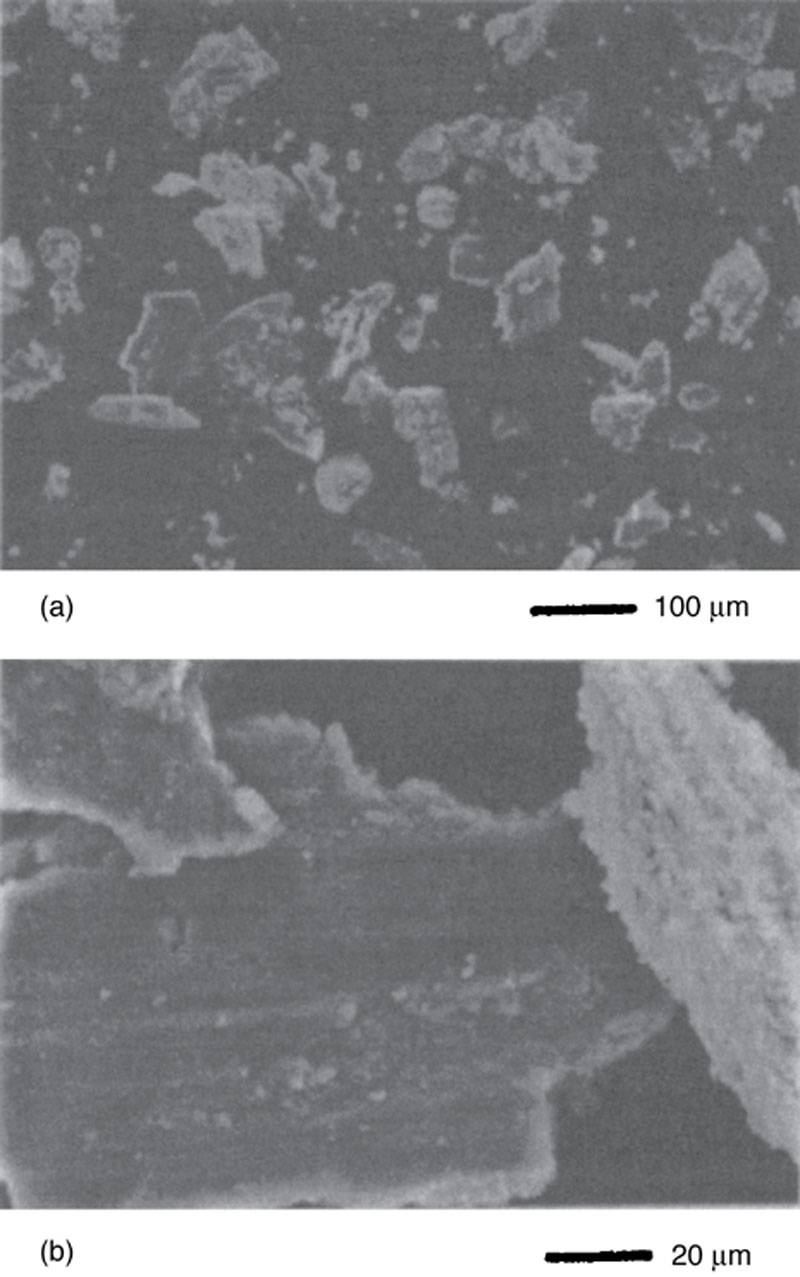
Grinding Debris
Examination of grinding debris for various brittle materials suggests material removal mainly by fracture. For example, particles from grinding of hot-pressed silicon nitride in Figure 3.16a appear to have been fractured from the workpiece. At higher magnification in Figure 3.16b, the particle on the right shows an irregular fractured surface and the polycrystalline microstructure. However, the orientation of the particle on the left reveals a striated ground surface on one side appearing to illustrate plastic deformation, which may have been generated during the previous grinding pass.
Microscopy of Ground Surfaces
Grinding involves a multitude of scratches and interactions between adjacent scratches. The effect of interactions between adjacent scratches on stock removal has been investigated for hot-pressed alumina by making a series of parallel scratches with separation distances from 0 to 250 μm [22]. The results in Figure 3.17 show a strong dependence on both the separation distance and the load. When the separation is so large that the scratches do not interact or so small that scratches overlap, the material removal is relatively small. At intermediate distances, the material removal becomes much larger. Figure 3.18 shows a ground surface before and after etching (reaction bonded Si3N4, a = 38 μm, vw =200 mm/s, vs = 10 m/s) and exhibits ductile flow. After etching (49% HF, 100 °C, 1 hour), most of the deformed striations are removed. This would indicate that much of the “deformed” surface layer consisted of glassy (amorphous) material. Some grooves generated by abrasive grains can still be seen, although other observations show almost no evidence of ductile flow after etching [23].
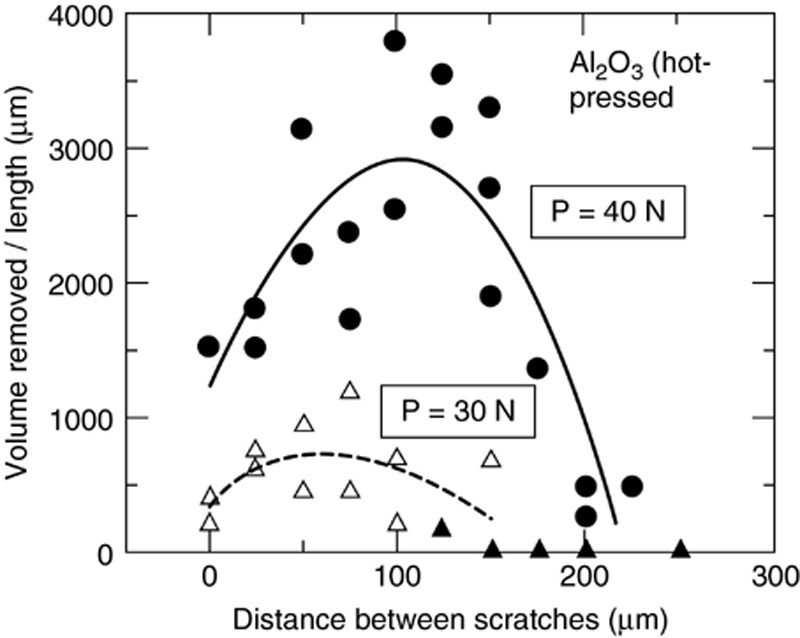
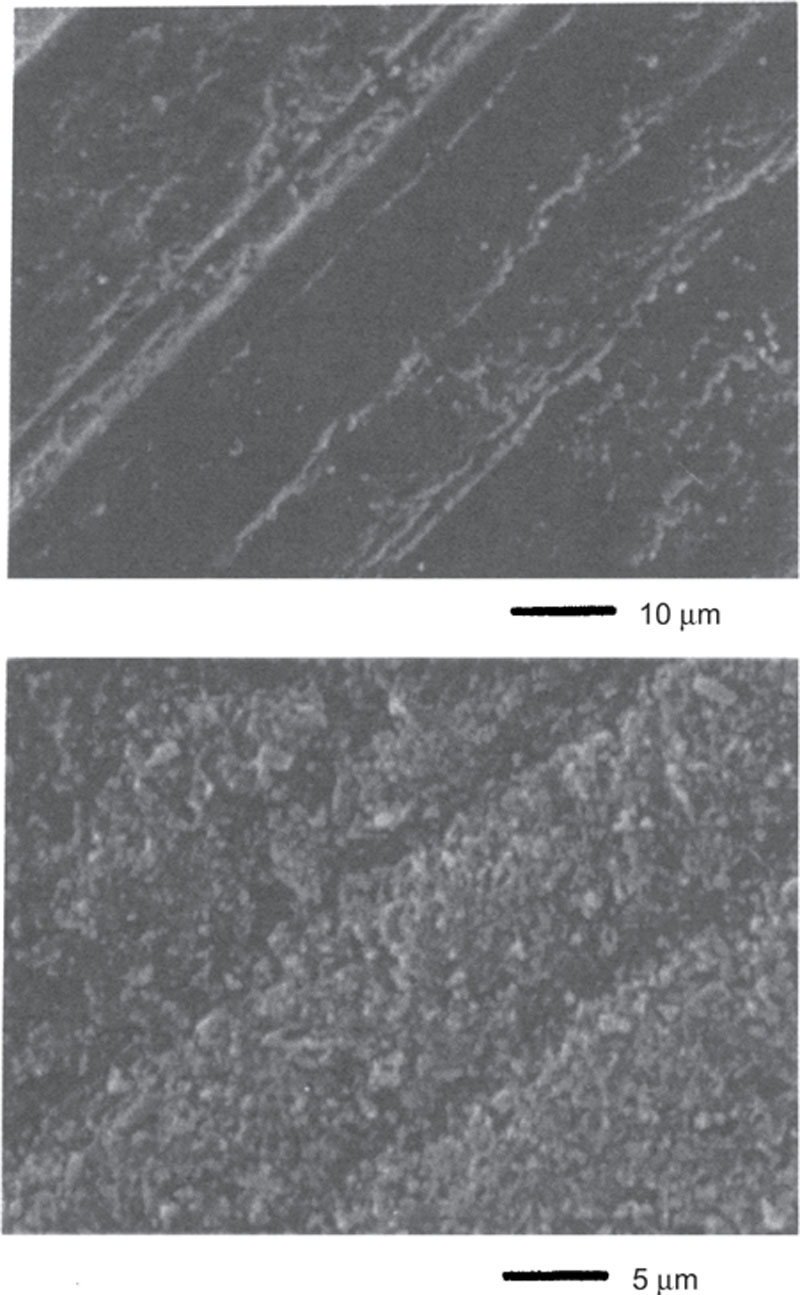
Figure 3.18 Ground surface before and after etching: Si3N4 (reaction bonded), a = 38 #m, Vw = 200 mm/s, VF = 10 m/s. t251
Grinding Energy
Apart from the microscopic observation, it is also important to consider the specific energy in grinding of ceramics. The specific grinding energy is defined as the energy per unit volume of material removed. For metallic workpiece materials, the total specific grinding energy can be modeled as the sum of chip formation, plowing, and sliding components [24]. For ceramics and other brittle materials, the relationship between the grinding mechanisms and specific energy are more complicated.
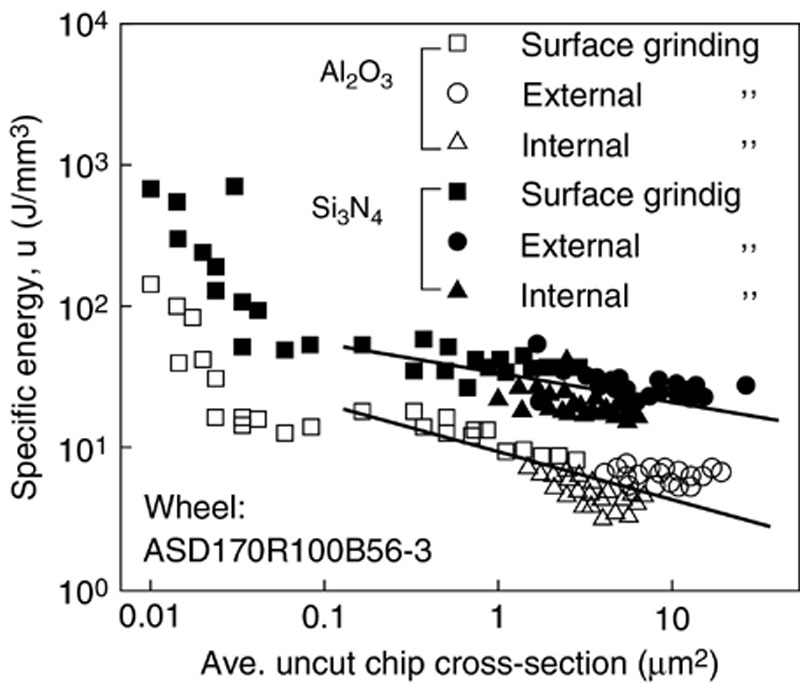
Force and grinding energy data have been obtained for various ceramics over a wide range of conditions [25]. For straight surface grinding of hot-pressed silicon nitride (HPSN) with diamond wheels, specific energies have been reported ranging from about 15 J/mm3 at extremely high removal rates to as much as 800 J/mm3 at very low removal rates. A simple explanation for this type of behavior is that a decrease in removal rate results in a smaller undeformed (uncut) chip size, causing more flow and less brittle fracture. Results for specific grinding energy versus average uncut chip cross-sectional area in Figure 3.19 for aluminum oxide and silicon nitride show two distinct regimes [26]. Below an average uncut chip area of about 0.05 μm,2 which corresponds to a maximum uncut chip thickness of about 0.35 μm, the specific energy increases steeply with smaller chip size. Above the transition, specific energy decreases more slowly as the chip size increases. The uncut chip thickness at the transition may correspond to the critical threshold depth of cut for ductile regime grinding. This would suggest material removal mainly by ductile flow below the transition and brittle fracture above the transition.
SEM observations of grinding debris indicate material removal mostly by brittle fracture, except under extremely fine grinding conditions. In an attempt to account quantitatively for the magnitude of the specific grinding energy, the portion of energy associated with brittle fracture can be estimated as the product of the surface area generated by fracture and the fracture energy per unit area of surface generated [25]. For simplicity it is assumed that particles removed by grinding are cubes of dimension b. Approximating the fracture surface energy by half the critical energy release rate Gc (Gc = Kc2/E, where E is the elastic modulus and Kc the fracture toughness) for crack formation (two surfaces), the specific fracture energy for grinding is:
The smallest particles removed by grinding are approximately 1 μm in size, although many are much larger. For hot-pressed silicon nitride, Gc  80 J/m2. Using these values for b and Gc, uf 0.24 J/mm3, which is only about 1% of the specific grinding energy.
Some specific energy measurements are shown in Figure 3.20, which range from about 100 J/mm3 at low removal rates down to about 40 J/mm3 at high removal rates. Grinding of reaction bonded silicon nitride (RBSN) tends to give slightly lower specific energies. Specific energies for high density aluminum oxide are about half as large [27].
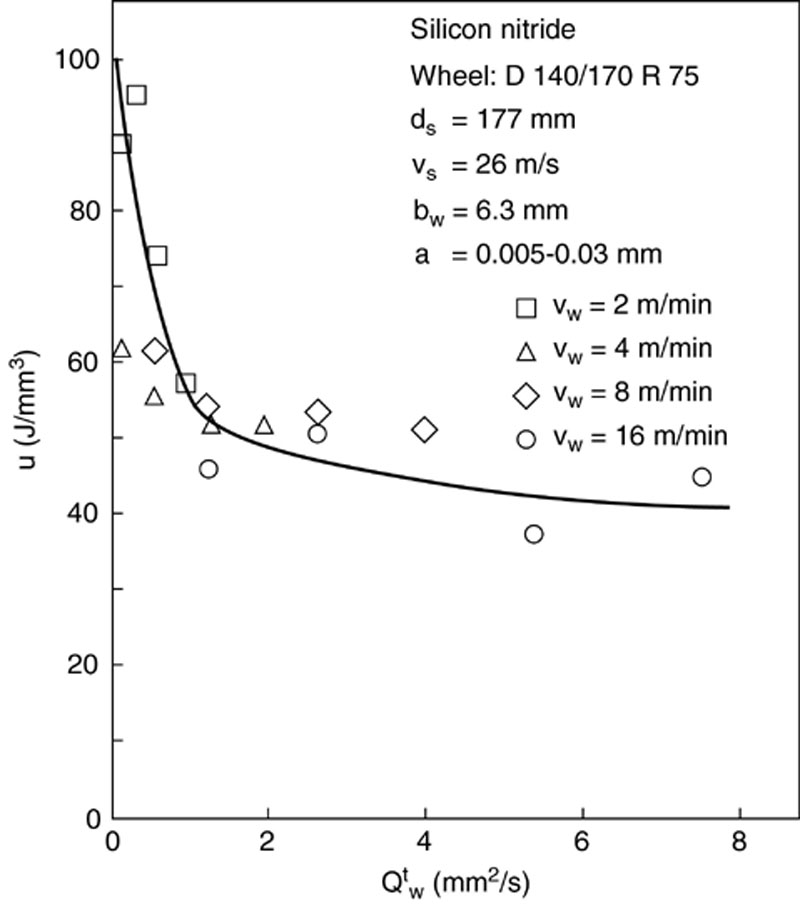
Figure 3.20 Specific energy versus removal rate per unit width for straight surface grinding of a hot pressed silicon nitride [27]
It is interesting to note that the specific energy obtained for grinding of silicon nitride is similar to values found for grinding of steels. Paragraph analysis therefore suggests that most of the grinding energy is expended by flow-type mechanisms of abrasive-workpiece interaction rather than by a brittle fracture mechanism. Brittle fracture can account for only 1% of the measured specific energy. This suggests that most of the energy is not expended by brittle fracture but by ductile flow, even though most of the material removal is by brittle fracture.
The material removal rates in grinding of ceramics vary widely depending on the application. With recent advances in our understanding of the grinding of ceramics, it is possible to achieve material removal rates comparable to that in metal grinding. However, current practice achieves only about a tenth of these material removal rates. There is significant room for improvement in these production applications by systematically implementing the results published in the literature. Summarizing the research on ceramics grinding, here are some important observations [28]:
• Grinding is carried out with diamond wheels
• Process is operator dependent
• Process is expensive
• Approximately 75% of total part costs can be attributed to grinding damage frequently imparted to the workpiece by grinding
• The chip-formation process is predominantly characterized by brittle fractures; although plastic deformation also occurs, chips are formed in front of and behind the chip-removing abrasive grain
3.5. General model of abrasive processes
Brittle Fracture Grinding Mode
Ceramic materials are generally much more brittle than metallic materials and show very little plastic deformation under load up to fracture. For this reason, it might be expected that the mechanisms of abrasive-workpiece interactions for ceramic materials would mainly involve brittle fracture. Microscopic examination of high density polycrystalline alumina surfaces ground with diamond typically show fractured areas, which are consistent with a brittle fracture mechanism. However, evidence of plastic flow with striations along the grinding direction is also observed. Transmission electron microscopy reveals dense dislocation arrays in the ground subsurface, which is unequivocal evidence of plastic flow. SEM examination of ground silicon nitride surfaces also reveals striations indicative of ductile sideflow, analogous to the plowing regime in grinding of steels, interspersed with fractured areas. This would suggest that both flow and fracture play an important role in the grinding process for ceramics. On the other hand, debris produced by grinding of silicon nitride appears to consist mainly of fragments produced by brittle fracture.
Ductile-Regime Grinding Mode [29]
Ductile-regime has been used to describe the material-removal mechanisms in grinding of ceramics. The transition from brittle to ductile material-removal at smaller cutting depths can be argued purely from considerations of material-removal energy. Specifically, for lower machining depths of cut, it can be shown that plastic flow is a more energetically favorable material-removal process than fracture. The material property characterizing resistance to plastic flow is the yield stress, σy. The energy (Ep) required to plastically deform a specific volume of material (Vp) can be written as:
The material property characterizing resistance to fracture is the Griffith crack propagation parameter, G. The energy (Ef) required for fracture is a function of the area (Af) of new surface created by crack propagation. Thus:
For a machining depth d, it is reasonable to assume that the order of magnitude of both Vp and af are determined by d. That is:
The ratio of material-removal energies, then, is given by:
 (3.6)
(3.6)Consequently, as the scale of machining decreases, plastic flow becomes an energetically more favorable material-removal mechanism. The depth at which a brittle-ductile transition occurs is a function of the intrinsic material properties governing plastic deformation and fracture.
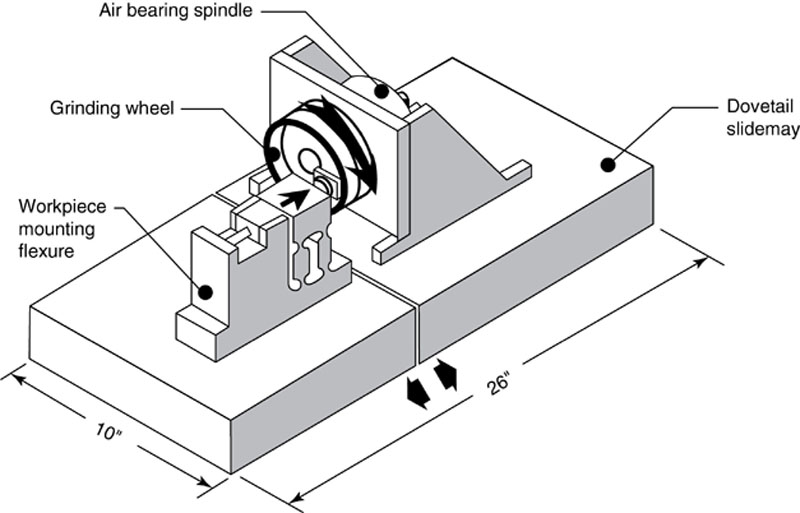
Consideration of this energy argument leads to a generalization termed the “Ductile-Regime Grinding Hypothesis.” This hypothesis states that, for any material, if the dimensional scale of material-removal is made small enough, material-removal will proceed by a mechanism of plastic flow and not fracture. In grinding, the “scale” of material-removal is characterized by the depth of cut imposed on a particular abrasive grit. Figure 3.21 depicts the development of a grinding apparatus capable of ductile-regime grinding of brittle materials. The machine has a piezoelectric infeed system, plunge-grinding configuration, high machine stiffness and provides controlled cutting depths as small as 2 nm.
Specimen ground in the ductile regime exhibit enhanced strength and surface texture. Using scanning electron microscopy as a post-grinding analysis tool, the ground material surfaces were examined for evidence of surface fracture, which would be indicative of the grinding ductility. Figure 3.22 illustrates this brittle-ductile transition as a function of grinding infeed rate for fused silica. An expression for the critical (threshold) depth of cut dc, corresponding to the threshold load per grain for fracture was derived as:
where β is a constant, E is Young’s modulus, H is the hardness, and Kc is the fracture toughness. Experimental results for 10 percent fracture (90% ductile flow) on the ground surface, which was designated as the ductile regime limit, gave critical threshold infeeds ranging from about 3 nm to 200 nm. These results followed equation (3.7) fairly well with β = 0.15, assuming that the depth of cut is equal to the machine infeed.
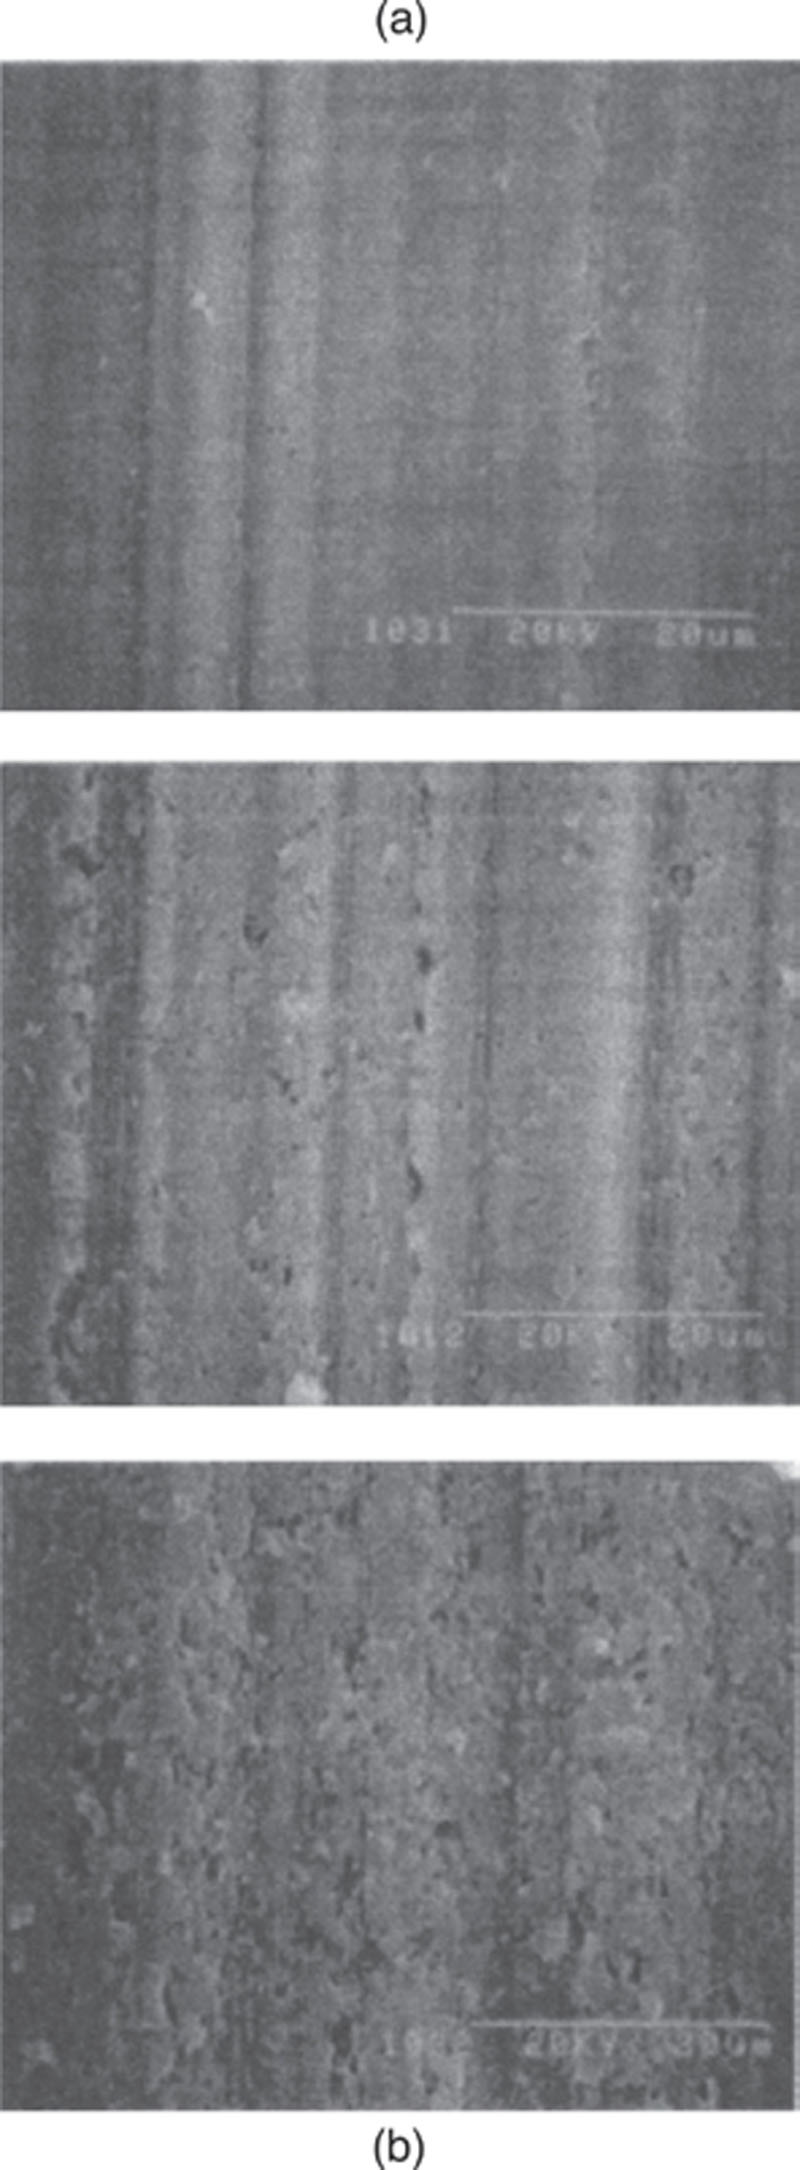
Figure 3.22 Brittle-ductile transition in fused silica (a) Graphical representation of surface fracture versus infeed rate (b) Microphotographs corresponding to three different grinding infeed rates. from top to bottom: 2, 7.5 and 37.5 Nm/rev [29]
Ductile mode grinding enhances surface quality, but is very slow and costly. One possible method of promoting ductile flow and achieving removal rates is by using high wheel speeds. Higher wheel speeds reduce the underformed (uncut) chip thickness, and result in a smaller force per grit, increased ductile flow, and decreased strength degradation. Straight surface grinding results in Figure 3.23a show reduced normal force per grit as the wheel speed is increased up to 178 m/s. The corresponding results for percent are surface fracture (pull-out). Figure 3.23b indicate more flow at faster speeds for a given removal rate. However, the highest removal rate (10.8 mm2/s) gave the least surface fracture, but not the lowest force per grit. This anomalous behavior may be related to the grinding temperature. While elevated temperatures are generally considered to have a deleterious effect on work-piece quality, exposure of hot pressed silicon nitride to a temperature of 800 °C has been shown to increase strength due to glassy phases which blunt the flaws. Therefore, the reduction in surface fracture and apparent increase in flow may be associated with glassy phase formation at elevated grinding temperatures. It remains to be seen whether the reduction in percentage fracture at higher grinding temperatures also results in reduced strength degradation.

Powder Regime Grinding Mode [30]
The powder regime grinding mode hypothesis proposes that the material removal mechanism of ceramics grinding is mainly due to material pulverization rather than ductile deformation.
Material pulverization has been observed in both single-point grinding and diamond wheel grinding processes as shown in Figures 3.24 and 3.25. Figure 3.24 shows SEM observations of surface and subsurface regions of alumina and silicon nitride after single-point grinding tests. No cracking or chipping has been found at a depth of cut less than the respective critical value (2.5 μm for silicon nitride, 2.0 μm for alumina, 0.5 μm for silicon carbide). However, when the depth of cut was larger than the critical values, cracks were observed in the subsurface layers. These cracks were covered by a powder-regime (a pulverized layer) with a smooth surface.
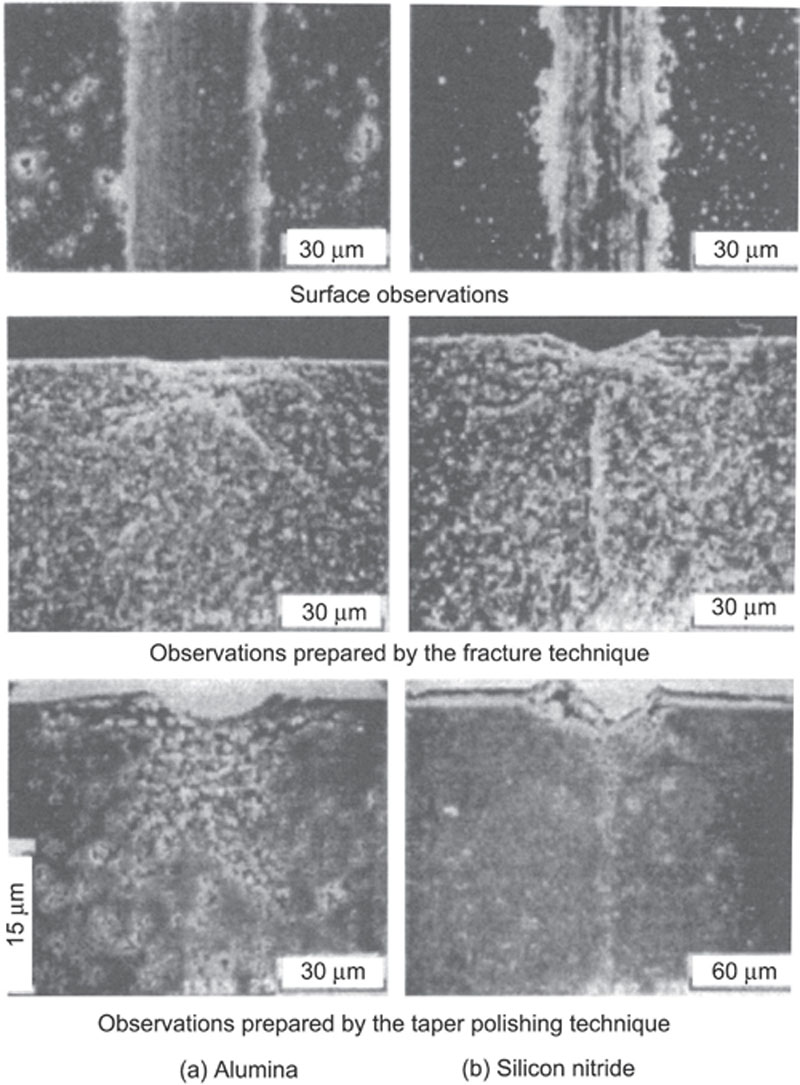
Figure 3.24 SEM observations of surface and subsurface regions of alumina and silicon nitride ground by single-point diamonds. The top row shows the surface observations; The “powder regime” is to be observed in the bottom row [30]

Micron sized ceramic grains in the grinding region are pulverized into submicron sized grains, thereby forming a powder regime on the ground surface. The grinding-induced powder regime layer on silicon nitride was observed at a higher magnification by TEM, as shown in Figure 3.26. The TEM photo-graph indicates a variation of grain size distribution with small grains in the top and large grains in the bottom. In the middle part of the photograph, there is a cluster of small grains with an average grain size of 0.3 μm, the remaining are grains of different sizes. The grains, mainly hexagonal crystals, have appreciable gaps between them, indicating a loose bonding condition. These submicron-sized grains are randomly oriented, and some are marked by dislocation movements. A crack is present on a one-micron-sized grain which would tend to cleave the grain into several submicron-sized grains. This crack arrests at the grain boundary which hinders the further propagation of cracks into the surrounding grains. The crack arrests by grain boundaries localize the damage induced by the grinding process. The submicron-sized grains can be formed by splitting micro-sized grains along the cleavage planes.
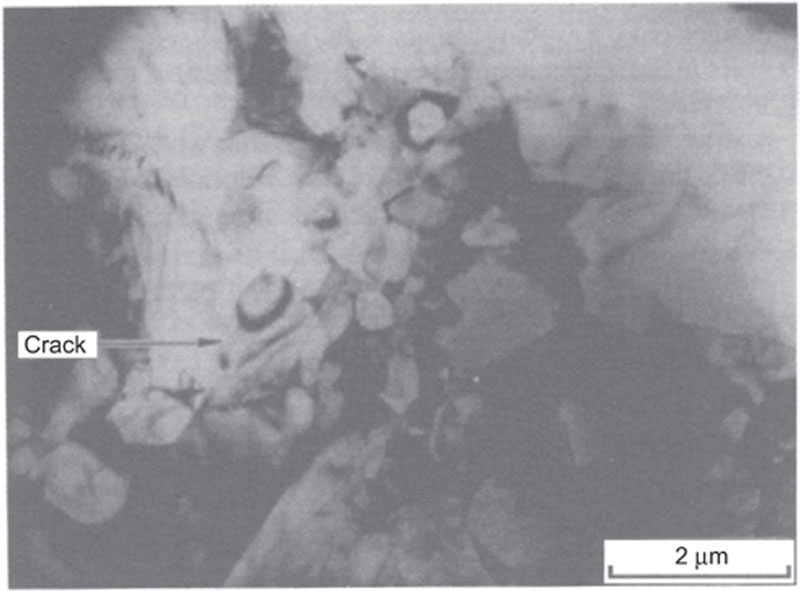
Figure 3.26 Observation of grinding-disturbed layer of silicon nitride by TEM. A cluster of small grains is approximately 0.3 μm in grain size. A crack can be seen on a one micron sized grain [30]
The powder regime in single-point grinding was quantitatively measured on silicon nitride and alumina. Figure 3.27 shows results on both silicon nitride and alumina ground by a single-point diamond with a tip radius of 1 μm. The thickness of the powder regime layer increases as the depth of the cut increases.
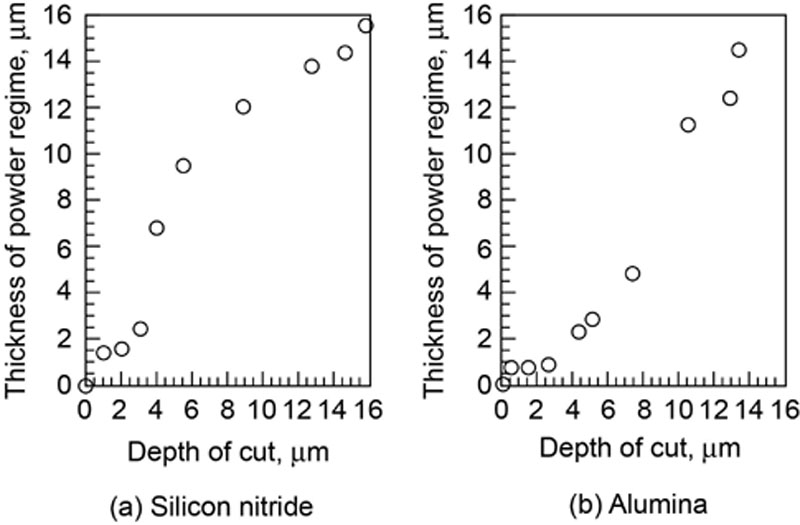
Figure 3.27 Correlation of thickness of powder regime with depth of cut in single-point grinding [30]
Figure 3.28 schematically shows the powder regime generated by a single-point grinding process. Side flows of the pulverized material, on the other hand, are caused by the special stress state that forms material pile-up on both sides of the ground groove as shown by the SEM photographs of Figure 3.24. Furthermore, due to the elevated temperatures in the contact region, the pulverized material could be resintered, which would also contribute to smoothing the surface of the ground ceramics.
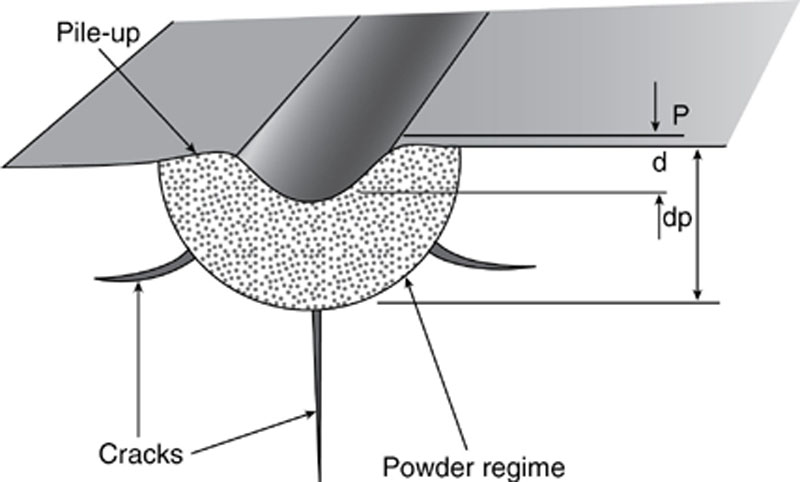
Figure 3.28 Schematic showing the powder regime layer induced by the single-point grinding process [30]
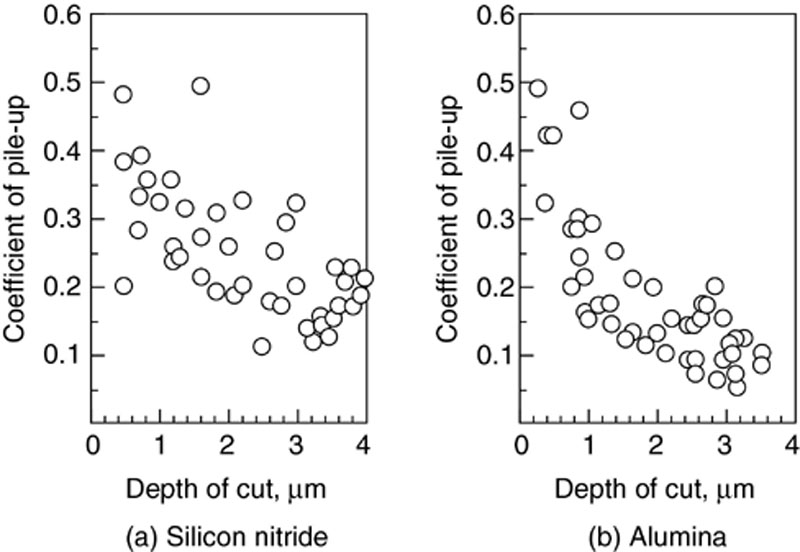
As observed in Figure 3.24, the powder regime generated by sideways material pulverization flows forms material pile-up on both sides of a groove. In order to evaluate the degree of the material side flows, a measure has been taken of the material pile-up. The pile-up coefficient e is defined as e = p/d where p is the height of a pile-up, as measured from SEM photos, and from the surface profile of a groove. The value d is the grain depth of cut.
Figure 3.29 shows coefficients of material pile-up in single-point grinding of silicon nitride and alumina. As the depth of cut decreases, the coefficients of pile-up are slight larger for silicon nitride than for alumina. This can be attributed to the fact that the thickness of the powder regime layer generated on silicon nitride is larger than on alumina at the same depth of cut. The larger the powder regime generated in a grinding process, the greater is the material sideways movement. Powder regime grinding as envisioned results in a surface consisting of small crystalline particles, compacted and semi-sintered.
The Double Fracture Model [31]
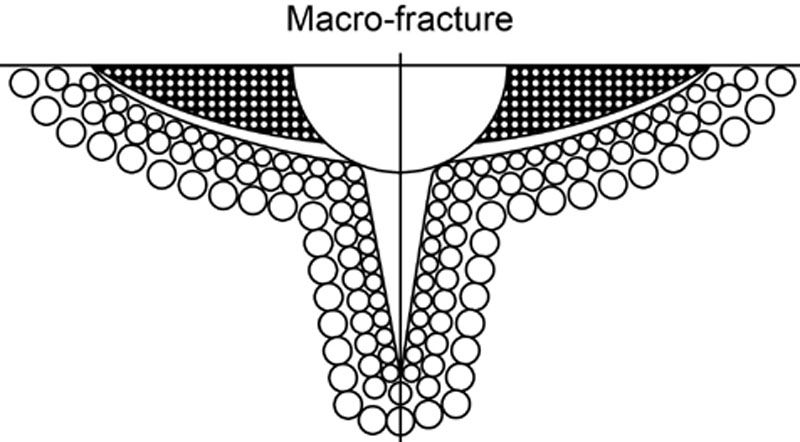
Double fracture model means that in micro-grinding of ceramics (lapping, for example), it is possible to have two types of stock removal mechanism, one of which is the double fracture mechanism. The fracture is a macro-fracture and is the effect of a grain which acts as an indentor, as shown in Figure 3.30.
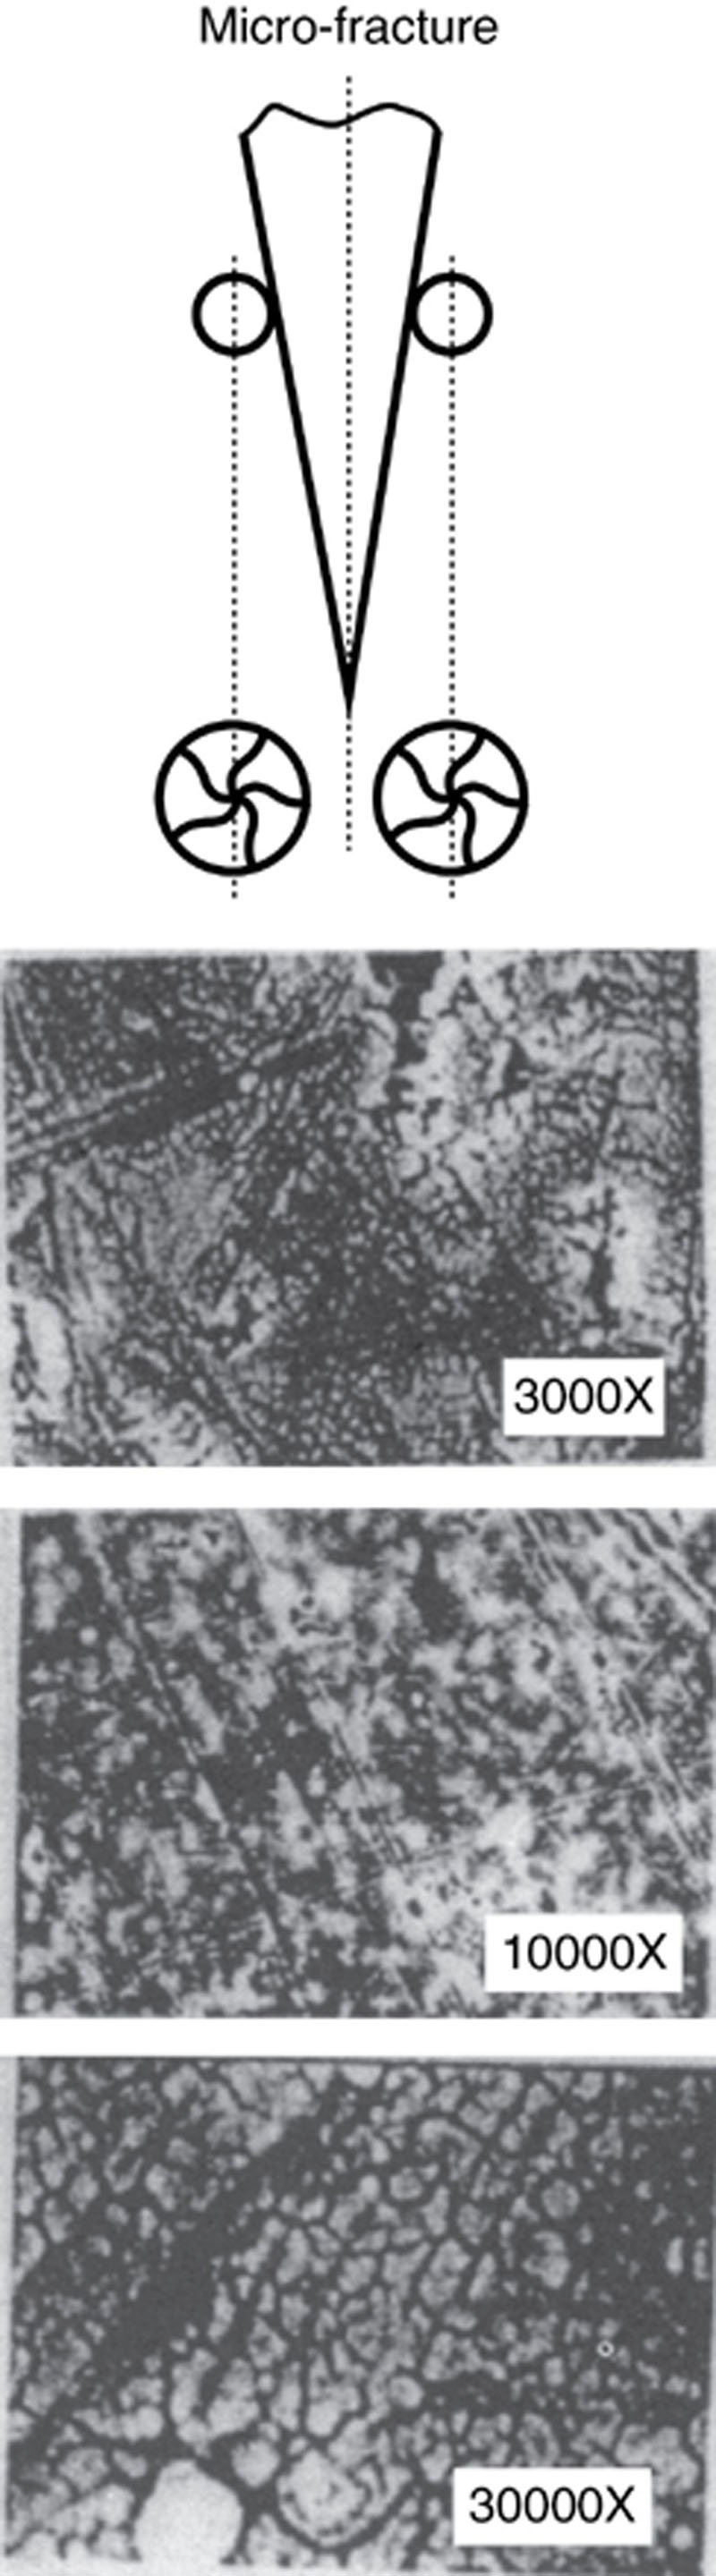
The fracture dissipates a quantity of energy as heat because of the friction and deformation. Because of a small shock during the unloading phase of the grain-workpiece interaction, micro-fractures will appear on the particles which were just separated by the micro-fracture as shown in Figure 3.31.
This mechanism provides a possible explanation of what occurs in grinding where the phenomenon is more intense because of the dynamics of the process. Even in ductile grinding where the material removal is considered to be in a plastically-deformed mode because of the thermal shock, the plastic chips will suffer a thermal fracture and some are transformed into a powder.
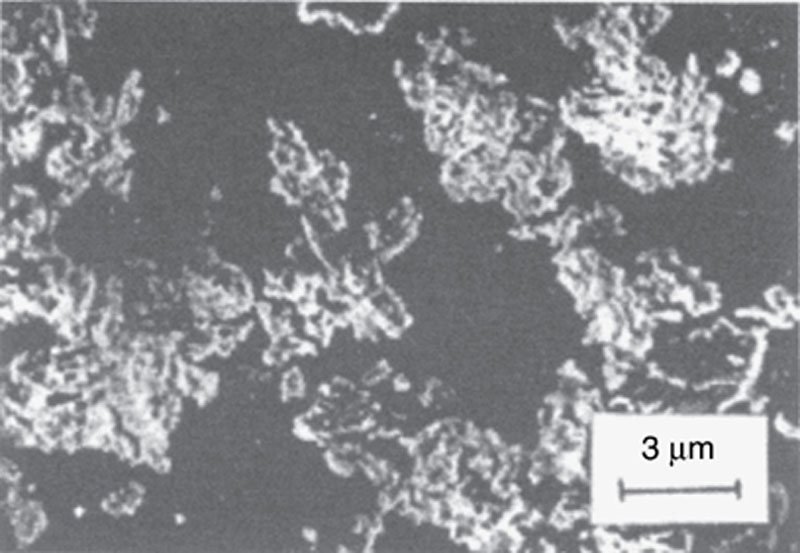
The SEM picture of chips collected from ductile grinding of alumina oxide (Figure 3.32) shows a spiral deformed shape like a turning chip. Because of thermal shock, the ground surface can be affected and some cracks can be observed.
In double fracture micro-grinding (lapping), the results indicate that two different trends occur. It appears that during lapping with the 30-40 μm and 10-20 μm abrasive size, material removal is through the brittle fracture mode. The process is very stable from the viewpoint of surface finish, stock removal rates (Qw), and specific energy (u), as seen in Figure 3.33a, b. Specific energy values are higher for the 10-20 μm abrasive size than the 30-40 μm. This is due to the greater number of diamond grains associated with the smaller size. There are approximately eight times as many grains with the 10-20 μm abrasive than in the same volume of 30-40 μm abrasive. Corresponding with this trend, the abrasive coefficient, μa, or force ratio, has the same relationship. The stock removal rates Qw are practically equal for both sizes.
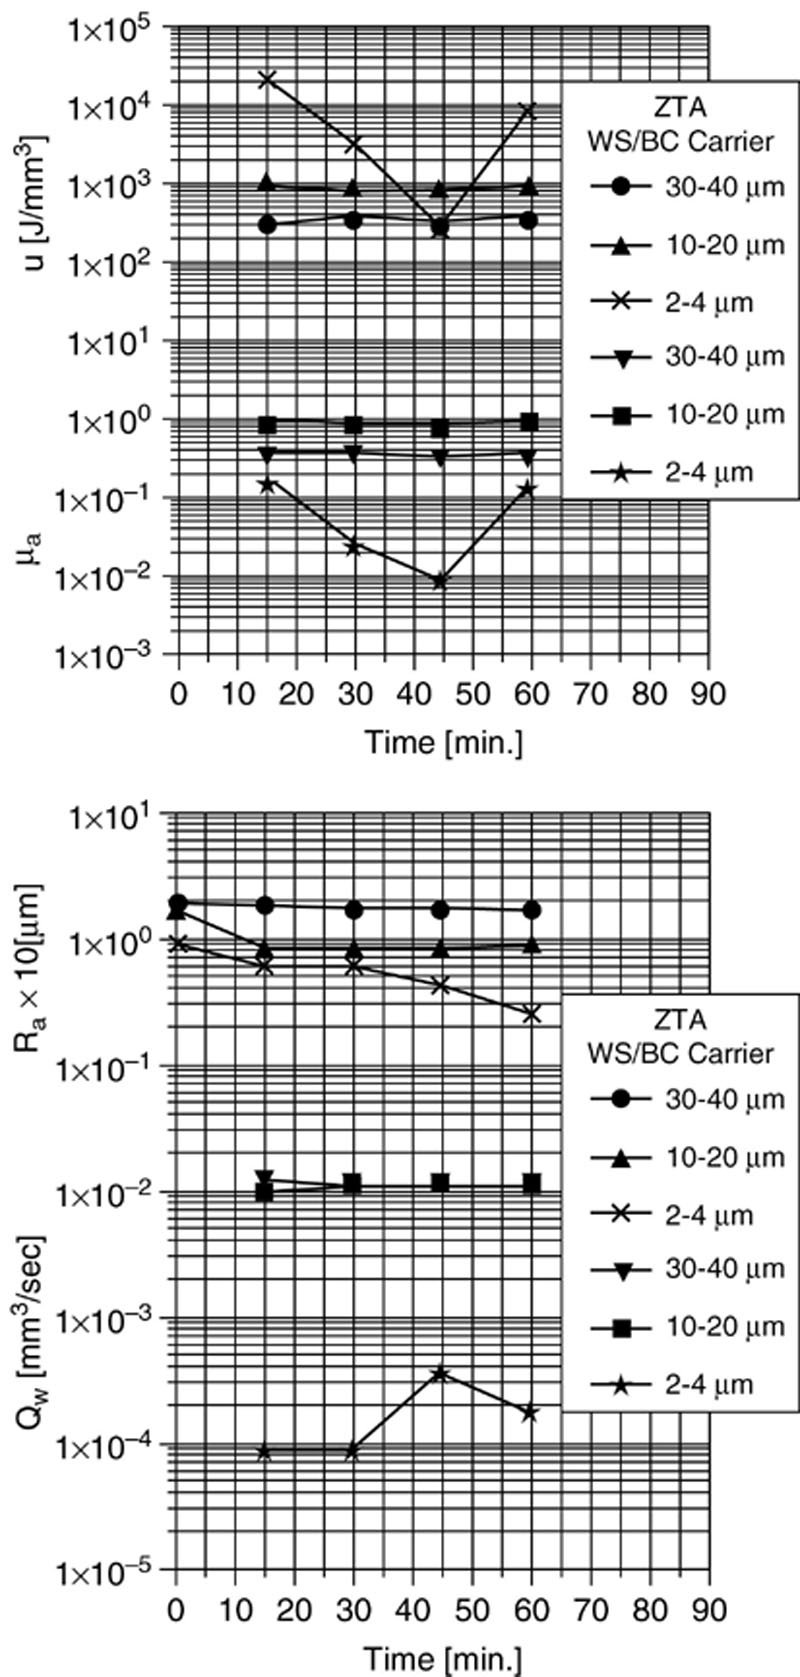
Figure 3.33 Results for tests using three abrasives. Each symbol represents an average of three parts. (a) Specific energy Ec and force ratio μA; (b) Average roughness Ra and stock removal rate Qw [31]
From Figure 3.33a, b, it is noted that the behavior of the 2-4 μm abrasive differs from the other two abrasive used. The behavior of this grit size is primarily because these grains are much smaller, thus the number of grains is much larger than in the other cases. For the same concentration of diamond powder, the 2-4 μm powder has 1000 times more grains than the 30-40 μm powder. From the graphs, we can see that the specific energy was at a minimum after 45 minutes of lapping. Specific energy then increased with a longer lap time. Based on ceramic grinding experience, the increase in the specific energy is usually an indication of the transition of the material removal mechanism from brittle mode to ductile mode. Further research focusing on brittle fracture/plastic deformation in micro-grinding needs to be performed.
Semi-Ductile Grinding Mode [32,33]
The term semi-ductile grinding is used to mean the brittle-ductile transition process in grinding of ceramics: one is due to plastic deformation on the characteristic slip plane and the other is due to brittle fracture on the characteristic cleavage plane. In machining of homo-geneous materials, the slip or cleavage planes coincide with the plane of maxi-mum shear or tensile stresses. When the resolved shear stress τslip in the easy slip direction exceeds a certain critical value τc inherent to the work material before a cleavage takes place, a plastic deformation occurs in a small, stressed field in the work material with a specified scale which can correspond to the depth of cut. Alternatively, a cleavage occurs when the resolved tensile stress normal to the cleavage plane σcleave exceeds a certain critical value σc preceding a plastic deformation. The mode of material removal depends on which criterion dominates or precedes σcleave σc or τslip > τc for the stress state under a particular machining condition.
For increased understanding of the transition mechanism, the scale of machining can be classified into three regions based upon the defect density of the work material.
Larger than Micron Scale
In this region, microcracks and dislocations are usually included in the stress field. σc sensitivity decreases as the scale of machining increases because the number of microcracks in the stressed field increases. Both macroscopic defects such as pre-existing crack, grain boundary and precipitates and atomistic defects such as stacking faults and platelets in the work material function as a microcrack. On the other hand, τc is not sensitive to the defects. Therefore, brittle mode material removal is the predominant criterion in this region.
Micron to Sub-micron Scale
σc does not decrease in this region as the size of the stress field decreases because the microcracks seldom occur in the stressed field. As dislocations are included in the stressed field, τc does not show remarkable change. Therefore, material removal mechanisms tend to change from brittle to ductile.
Sub-micron to Nanometer Scale
In this region, machining result in a defect free surface. Both τc and σc increase to the same level as the intrinsic strength of perfect (defect-free) work material. These intrinsic values, σc and τc, are occasionally affected by environmental temperature. The analysis based on continuum mechanics shows that the plastic deformation occurs before cleavage in indentation on defect free surfaces.
An explanation of the formation of ductile bands, along with fractured bands is shown in a modified form of König & Sinhoff’s model in Figure 3.34. Experimental results on machining of mono-crystalline Si and LiNbO3 support the applicability of the criteria.
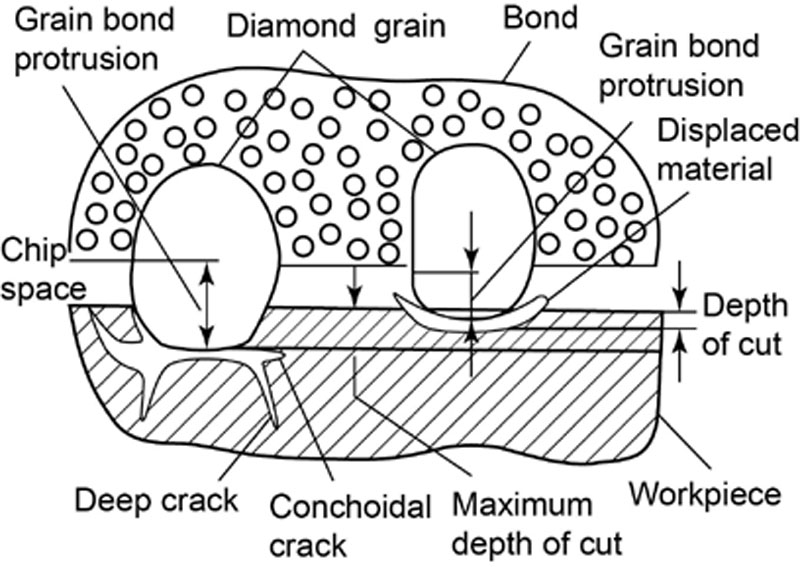
Figure 3.34 A modified form of konig’s model to explain semi-ductile grinding. a typical grain (on the left side) produces fracture while a slightly protruding grain (on the right side) produces ductile streaks [33]
3.6. Surface topography and surface integrity
Hans G. Wobker
During the sintering process, ceramics undergo a volumetric shrinkage and are thereby far from meeting high demands on their form and size accuracy. To meet these demands, machining processes such as grinding, lapping, honing or polishing with diamonds are necessary finishing processes to obtain functional surfaces. The properties of these machined surfaces are mostly decisive for the functionality of components. Until now, the connection between the machining process and the component’s functionality was not completely known. However, the distinction between surface topography and surface roughness has been established through recent research and industrial developments [34–36].
Definition of Surface Topography
Machined surfaces are not geometrically exact; they include form errors, waviness, and surface roughness [37]. Directional machining processes cause directional, grooved surface topographies. Usually, their roughness is perpendicular to the machining direction but is higher than parallel to the machining direction. However, ceramics show this behavior in addition to other less brittle or ductile materials. The diamond grits of the machining processes cause plastic deformations as well as brittle spall-offs on surfaces.
Definition of Surface Integrity
In addition to the surface topography and the material microstructure, the machining process influences the properties of components such as strength and tribological behavior. Concerning the machined surface, there is more to observe than the geometric properties, i.e. evenness, measure, or roughness. The mechanical and/or tribological properties of machined components are essentially influenced by machining processes because the surface layer of the workpiece will be altered due to the interaction of the tool and the material. The surface properties of components, as a result of the machining process, have become a very important factor required to understand the connection of process and component operability. To abstract the expression ‘surface integrity’ and its demarcation to other properties of a workpiece, it is necessary to define it [38].
Subsurface
The subsurface of a workpiece ought to be defined as the volumetric part of a workpiece that is influenced by the machining process. The depth of this layer depends on the process that produced the influenced zone. Von Weingraber subdivided the surface into an interior and exterior boundary layer as in Figure 3.35 [37]. On the outside, the surface is covered by a very thin layer in which the atoms and molecules are exposed to forces besides the interior forces. Although the mass of this layer is very small compared to the whole body, the surface energy of this layer determines many physical processes. Its thickness is atomic and can be detected with surface analytics and chemical characterization. The interior layer of the machined workpiece, called the subsurface, determines the functional properties. Compared to the body structure, this layer is alternated.
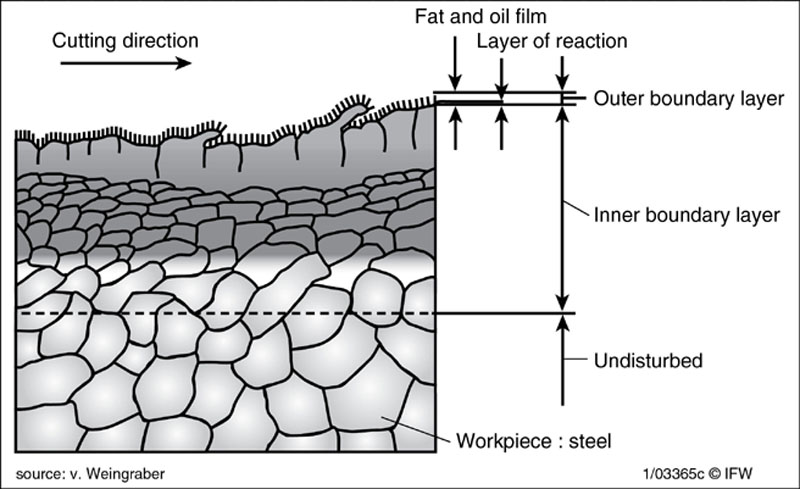
Figure 3.35 Interior and exterior layers of a component
Surface Integrity and Classification
Surface integrity covers the interior effects of a machining process. This includes the outermost layers whose properties differ measurably from those of the base material. Figure 3.36 shows a principal machined surface and subsurface, and their schematic physical and technological properties: mainly the properties of machined surfaces.
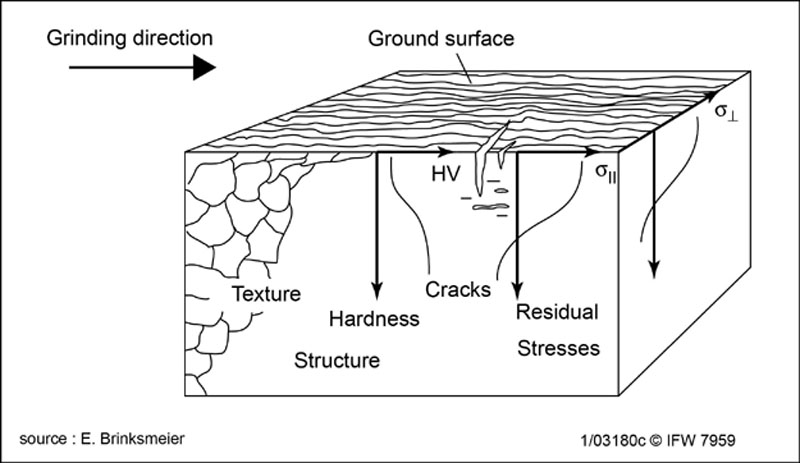
Figure 3.36 Properties of surface layers in a machined workpiece
The American Standard for Surface Integrity classifies the surface alterations by the principal modes that produce them:
• mechanical,
• metallurgical,
• chemical,
• thermal, and
• electrical.
This functional classification after the topics cannot differentiate between cause and effect of the surface integrity.
‘Surface integrity’ is defined as the properties of a part that are influenced by physical and chemical effects of the machining process [39]. Regardless of whether they are physically or chemically effected, geometrical properties are also included. Material deficits such as pores, cracks, material excesses, or residual stress-induced deflections could be such geometric properties. The surface material properties grouped by geometrical, physical, and chemical properties are shown in Figure 3.37 [40]. The physical properties of the surface layer can be divided into fundamental groups of physics. The function of a component is influenced geometrically by cracks and flaws, physically by mechanical stresses, and by the structure of the material. The subsurface structure is based on chemical effects which cause the physical properties of a material and is characterized by grain size, grain boundary, texture, dislocations, or hardness. Normally, this can be analyzed by using metallurgy or ceramography. Strictly, the hardness depends on the measuring method and is more a technological than a physical property.
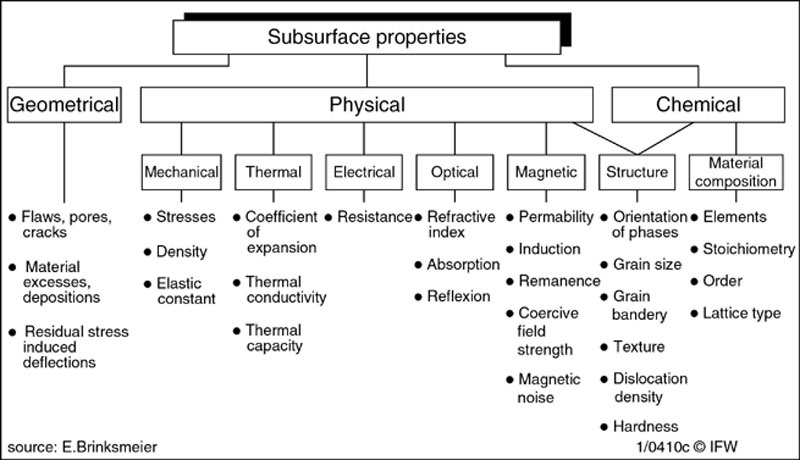
Figure 3.37 Table of subsurface properties
Influences on Surface Integrity
Starting from an initial state of the workpiece, cutting processes influence the surface, subsurface, and the properties of the machined component. Beside the process itself, the initial state of the workpiece and the surroundings are important for surface integrity.
The concentrated energy consumption at the contact region of a machining process can be divided into mechanical, thermal, and chemical effects which lead to differing intensities of surface property alterations. Figure 3.38 depicts the areas of differing energy consumption mechanisms in cutting with geometrically defined and undefined tools. The generation of mechanical and thermal effects are comparable in both, but the geometric dimensions differ in at least one order.
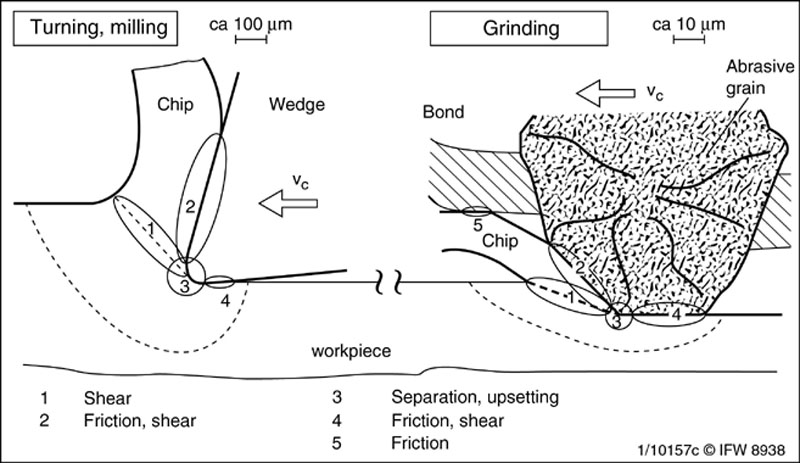
Figure 3.38 Mechanisms of energy transformation in machining processes
The mechanical, thermal, and chemical effects overlay during the process and decide on the output quantity which is the result of the process. The thermal and mechanical effects are the most important consequences of the process. Figure 3.39 shows, for most cutting processes, how these effects influence the material removal, and therefore the surface integrity in grinding. Both influences are rendered inseparable by the process and lead to fundamentally different effects on material removal mechanisms, and therefore in surface integrity.
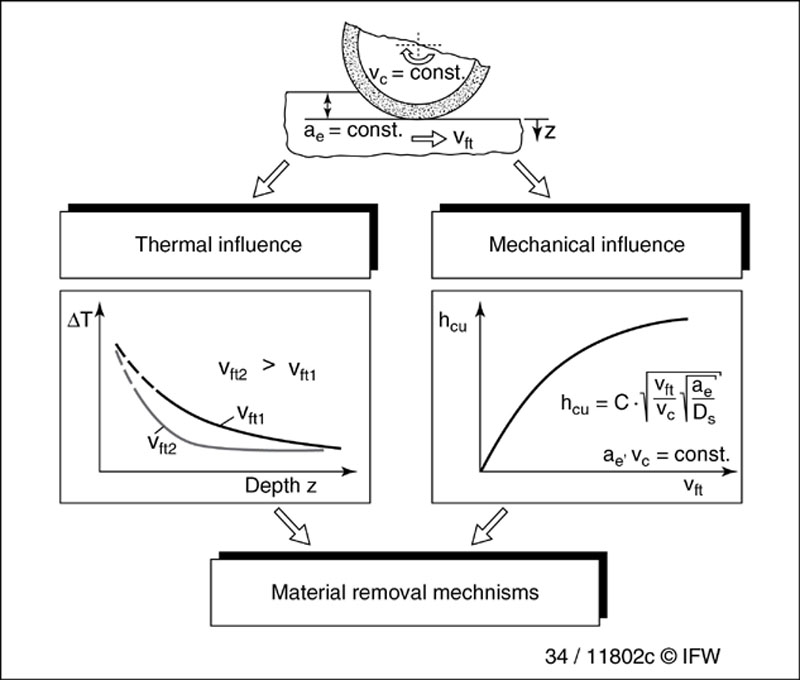
Figure 3.39 Thermal and mechanical effects influence the material removal mechanisms
The input quantities of a process are composed of the disturbances machine settings, and system parameters: wheel and workpiece speed, depth of cut, or wheel specifications. These factors lead to process quantities which mainly influence the surface integrity. The process quantities are physical quantities such as: cutting forces and moments, temperatures, thermal power, and energy. Figure 3.40 shows different machine settings and system parameters of a grinding process, which influence the temperature in the contact region.

Figure 3.40 Influence of system and setting quantities on temperature in grinding
In the contact region of a grinding, lapping, honing, or polishing process, the cutting grits lead to elastic-plastic deformations of the surface. In machining steels, dislocations or hyinnings lead to hardness increase or decrease. In machining brittle materials, cracks are induced by mechanical or thermal effects. After the abrasive passes, the material rebounds and either cracks or spalls-off occur due to the acting tensile stresses.
A very high sensitive indicator for thermal or mechanical influences on surface integrity are residual stresses, especially in machining metals. The mechanical effects of the grits lead to plastic deformations and cracks. The strong negative effective cutting angle in grinding induces plastic deformations on the surface. Therefore, changes in lattice lead to micro- and macro-residual stresses and strains. The material compression and deformation cause surface compressive residual stresses. In grinding steels, temperature effects lead to tensile residual stresses.
Roughness
The quality of the surface topography - the surface roughness - can be defined as the deviation from the geometrical ideal surface. The most common measuring system of surface roughness are the contact stylus analyzer or optical measuring systems. Figure 3.41 shows the most common roughness data: Rz, Rp, Rq, Rmax, and Ra. Rz is the average value of 5 single measurements for each evaluation length. The arithmetical mean deviation of the profile Ra, the root-mean-square deviation of the profile Ra, and the maximum profile peak height Rp are integrated roughness quantities.
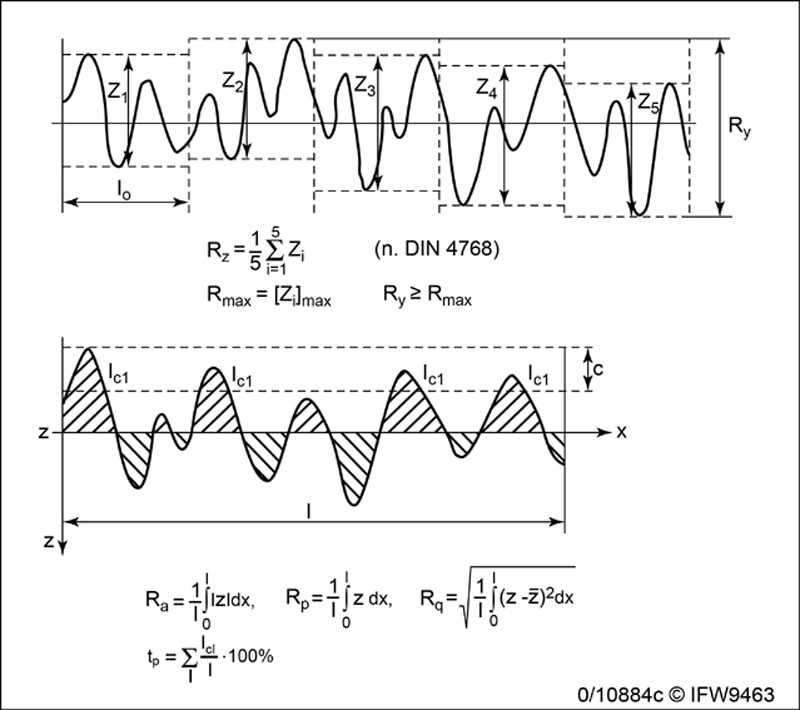
Figure 3.41 Surface characterization
Evaluation Technique for Surface Integrity
Generally, one can distinguish between mechanical, thermal, and chemical impacts that influence the state of surface and subsurface conditions. Chemical reactions in grinding of ceramics have not yet been discovered and may be negligible because most ceramics are chemically inert. Mechanical impacts may result in plastic deformations, compressive residual stresses, and cracks; however, thermal impacts may result in tensile stresses, cracks, phase transformations, and soft annealing.
Some of the structural, chemical, and physical surface and subsurface properties which are of interest in precision and ultra-precision machining are outlined in Figure 3.42. The dimensions range from 1 nm to more than 1 mm. None of the available measuring techniques shown in Figure 3.43 are effective in identifying structural parameters over the full range of dimensions. This can only be reached by using different techniques with different types of physical interaction with the material.
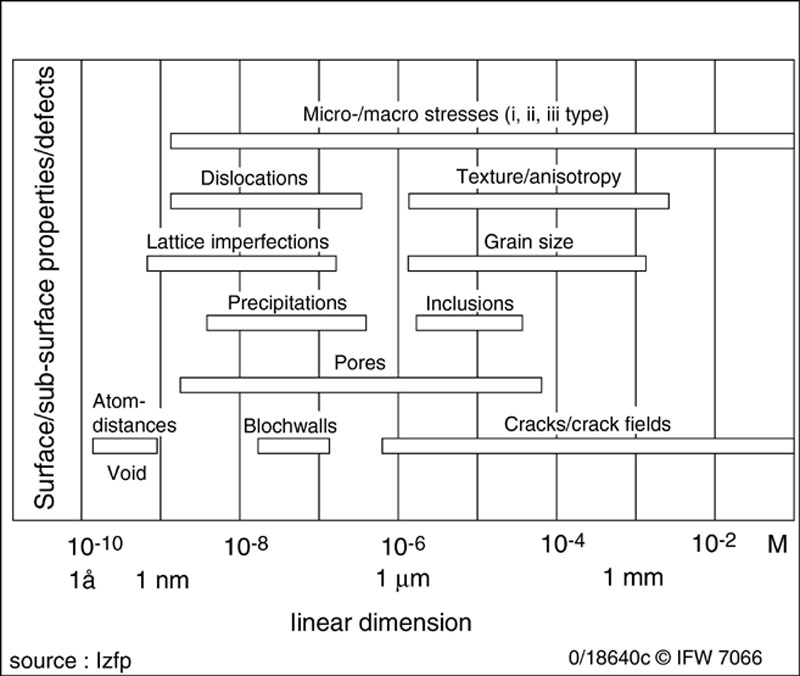
Figure 3.42 Linear dimensions of structure and defects
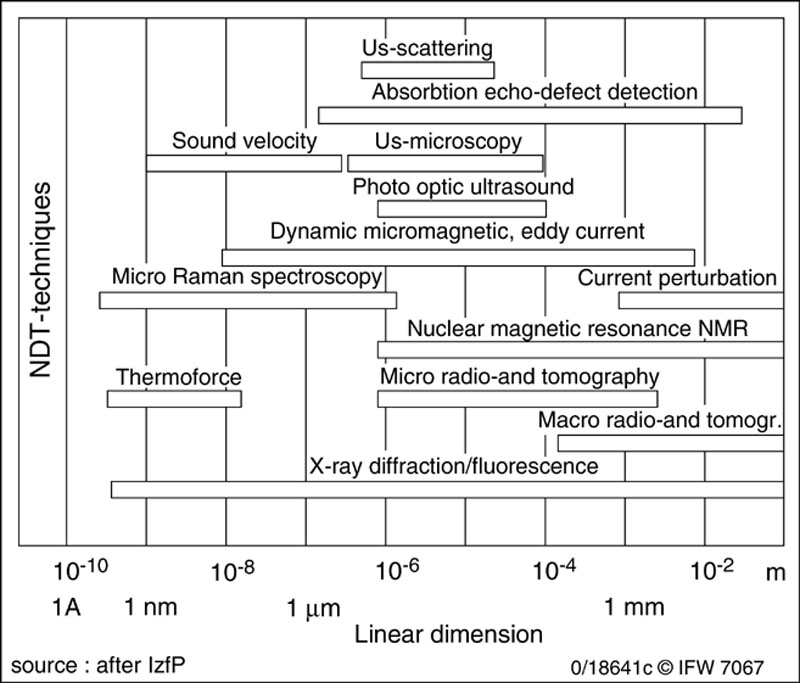
Figure 3.43 Non-destructive testing methods and the linear dimensions of their interaction
The most important specific techniques to yield surface integrity data are shown below. Many of these techniques are established in industry and research. Information on special facilities for new evaluation techniques, are relatively unknown.
Visual Examinations
Light-optical microscopy is very often used in ceramography. The magnification is limited to a factor of 1000. Because of the wavelength of light, the resolving power is limited to 0.3 pm. For characterization of machined surfaces, the most important disadvantage is the small depth of sharpness. At a magnification of 1000, the depth of sharpness is 0.01 pm. Therefore, light-optical microscopy requires optically-even surfaces.
For characterization of fracture surfaces, scanning electron microscopy (SEM) is most commonly used to investigate the surface structure and to detect flaws and open pores. A very thin electron-beam (diameter app. 0.01 μm) linearly scans the surface. The impact of the primary electrons of the beam causes secondary electrons to emerge from the specimen; these electrons are then detected. These secondary electrons give the picture deeper regions radiate less, higher regions radiate more electrons. The resolving power is limited to 0.01 μm. At a magnification of 1000, the depth of sharpness is 35 μm. Depending on the primary electron current, the maximum magnification can reach up to 200,000.
Microstructure Examinations
To estimate the influenced depth of the surface structure and the state of the material below the surface, different techniques are applied in the following manner.
A very simple method to determine the penetration depth of the influenced surface layer is by polishing the cross-section. Normally, the region of the influenced layers are very small. During fine-grinding and polishing of the cross-section, the specimen is rounded off. To enlarge the influenced region, the taper polishing technique is suitable. Figure 3.44 [22,41,42] presents another simple technique for directly observing subsurface damage in the machined ceramics. The technique requires two polished specimen whose polished surfaces are tightly bonded together. After grinding perpendicularly to the interface, the polished surfaces are taken apart to observe the influenced subsurface without following the polishing procedure.
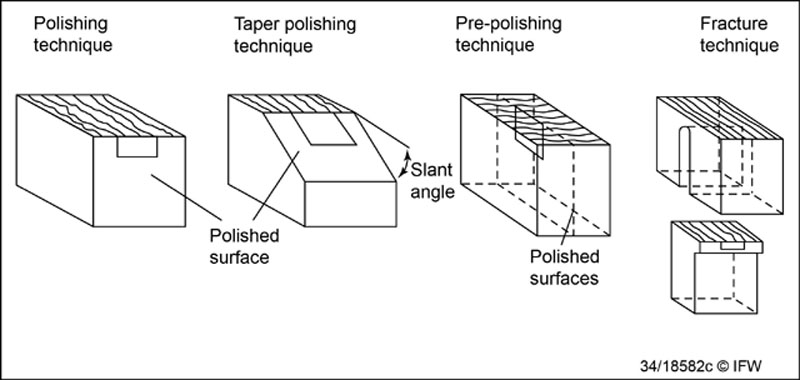
Figure 3.44 Examination technique of subsurfaces micostructure
To observe the subsurface structure after machining, a fracture technique can be used [30], Figure 3.44. A slit is introduced to a ceramic sample, with a ground surface, from the bottom side. The uncut margin of 4 mm is fractured by a bending moment. The cross-section of the ceramic sample is then observed by SEM.
To characterize structural alterations as dislocations, stacking faults, or finest dispersions, transmission electron microscopy (TEM) is one of the most commonly used analyzing methods. Electron beams transit thin layers. TEM uses the deflection of the electron beam on lattice faults. Depending on the structural state, the beam transition causes transit time differences and leads to interferences of the beam. The beam potential reaches up to 1 million Volts which leads to magnifications up to 106 (resolving power less than 1 nm).
Analysis by TEM, necessitates preparing the specimens by thin ground technique. By using electrolytic etching, the thin specimen will be etched until the thin plate develops a hole. The taper to the boundary of the hole will be analyzed by the transmission electron. The interpretation of the observed micrographs is very difficult.
Hardness Measurements
Most hardness tests yield numerical values that correlate with the materials’ resistance to indentation by another body. Principally, hardness can be determined by scratching, indentation under static or dynamic load, or by rebounding of the tester from the specimen because of elasticly. Of technical importance is the static indentation thus formed; one then analyzes the indentation area (Brinell, Vickers, and Knoop) or the depth of the indentation (Rockwell), Figure 3.45.
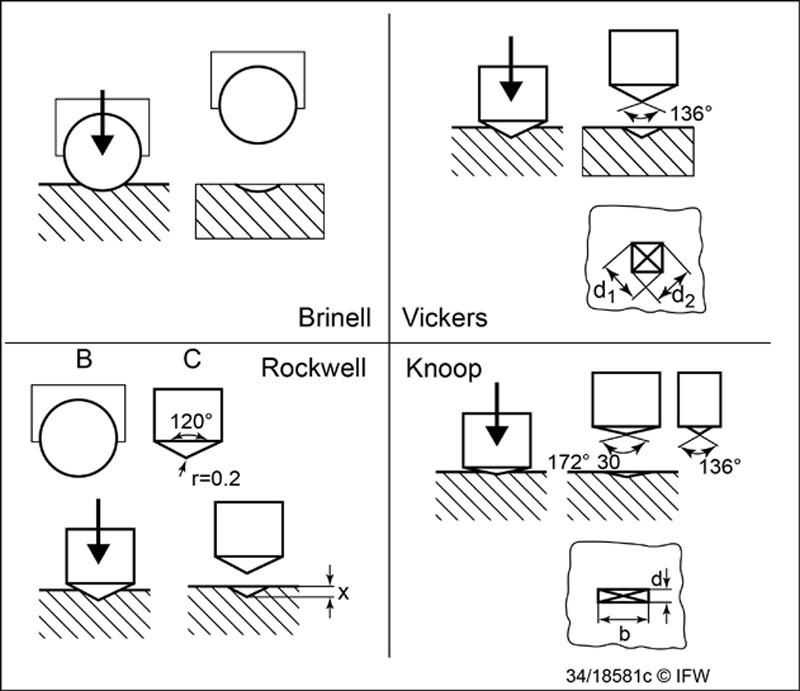
Figure 3.45 Hardness indenter
The Brinell indentor is a sphere; the hardness is calculated by dividing the maximum applied load by the area of the indentation. Vickers and Knoop indenters are blunt pyramids. Vickers hardness is calculated by dividing the force by the contacting surface area; Knoop hardness is calculated by dividing the load by the projected area. Because the Knoop indenter penetrates only about half as deeply as the Vickers indenter for the same load, it is frequently preferred for studies of superficial hardness.
The indentation depth of the Rockwell tests correlates inversely with the penetration depth of the indentation. Indenters of different geometries are used for materials of differing range of hardness. For all hardness tests, the indentation is influenced by the form and hardness of the indenter, so hardness values have to be named by the method.
The brittleness and the presence of microcracks in the surface region of ceramics lead to spallings by using indenters. It can be difficult to measure the impression because of the spallings and induced cracks. To avoid this, smaller impressions than the mean crack spacing should be used.
Depending on the load of the indentation hardness, measurement is distinguished between macro-hardness measurement (forces > 50 N) and micro-hardness measurement (forces < 2 N). To analyze the hardness of machined surfaces and subsurface regions, Vickers and Knoop microhardness measurement methods are the most suitable testing methods. However, the small forces lead to high measuring uncertainties by the optical evaluation of the impression. Therefore, hardness measuring systems were developed which use the depth of the indentation for hardness data. Figure 3.46 shows a microhardness testing system schematically. Principally, force or displacement actuated systems can be used. The instrumented microindentation technique is basically a hardness testing procedure at very low force levels in the range between 0.1 mN and about 250 mN. The indentation depth is typically in the sub-micrometer range which classifies the method as quasi-non-destructive one.
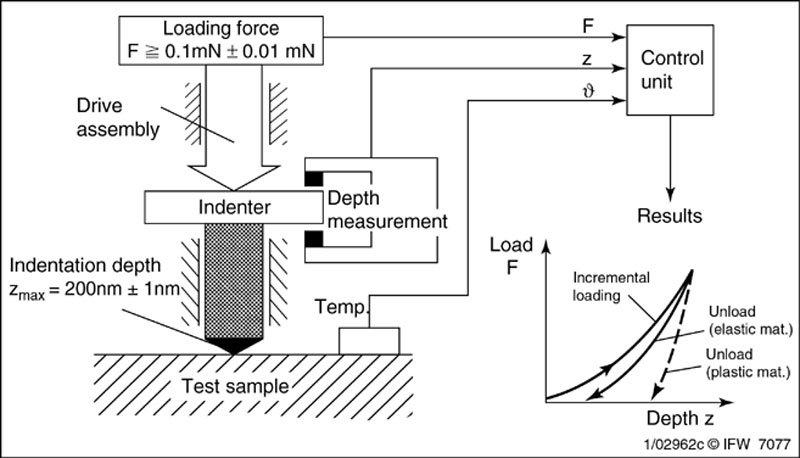
Figure 3.46 Micro-hardness system
One of the most difficult problems in measuring the hardness alteration of machined surfaces is the expansion of the influenced region in a range of microns. The brittleness of ceramics leads to spallings off the surface by measuring the hardness in a cross-sectional arrangement.
Evaluation of Cracks and Flaws
Fracture of ceramics originate from machining flaws as well as from material intrinsic failures. The brittleness of ceramics and their small grain sizes causes critical crack lengths in the range of microns. Therefore, crack inspection methods have to have a high resolution. However, non-destructive testing methods can be grouped into capillary, magnetic, inductive, ultrasonic, and x-ray testing methods.
The dye penetration inspection is very common in non-destructive testing of metals. Capillary effects cause the penetrant to be sucked deep into cracks, pores, and hollows of the surface because of low viscosity and surface tension of the moisture. After cleaning, the workpiece will be prepared and the outcoming dye will show the failures qualitatively.
This method is limited to cracks open to the surface, furthermore, the width of failure also limits its applicability. Often, cracks in ceramics are closed or smeared by plastically deformed material; therefore, the dye penetration test is not suitable. Penetrant inspection is impractical to use on excessively porous test materials.
Because of non magnetic and non electrical conductivity of most ceramics, magnetic and inductive testing methods are impractical for detection of failures in ceramics. Radiographic tests are also not successfully applicable because of the size of failures and ceramic densities.
Conventional ultrasonic techniques, as pulse echo method, were further developed to detect near-surface damage by sharply-focused transducers which generates very short-duration pulses. In order to detect defects by ultrasound efficiency, it is necessary to use wavelengths in the defect size. By using wide-open angels of the incoming ultrasonic beam, Raleigh waves are stimulated. These waves are surface waves with a penetration depth of the wavelength. Surface non-homogeneities, such as flaws, cracks, pores, and the surface roughness, reflect these waves and lead to interferences. This technique is able to determine flaws up to a depth of d/λ = 1/10. The resolving power is 15 μm at 100 MHz and 0.75 μm typically at 2 GHz.
Photothermal analysis of machined surfaces is a new method of non-destructive and non-contact testing. The technique yields local differences in thermal conductivity. Figure 3.47 shows the principle of the photothermal analysis method.
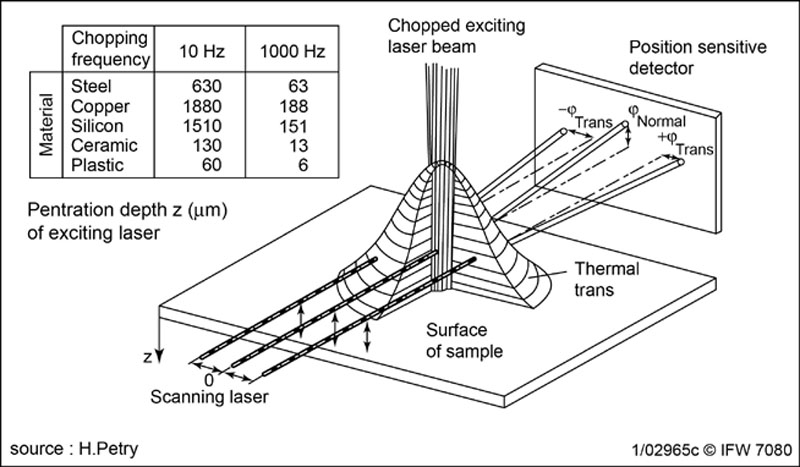
Figure 3.47 Photothermal inspection method
The sample is subjected to an intensity-modulated laser beam. The heat is transferred into the subsurface area by heat transfer. Because of the short pulse duration and intensity of the excitation laser, only a limited depth of the subsurface area is influenced by this excitation. Therefore, the depth of the inspected subsurface area can be varied by changing the chopping frequency and the excitation power. Changes in the local thermal properties will be influenced by local defects and impurities including cracks and pores. The thermal wave analysis measures the local temperature at the samples surface, by a second laser beam, to detect changes in the local thermal diffusively which are related to subsurface defects. The size of the detectable defects depends on the focus diameter of the excitation laser. The thermal wave analysis is very suitable for the detection of closed defects underneath the sample surface down to defect sizes of 10 μm.
Residual Stress Measurements
The machining process, which generates the functionally relevant surfaces of a component, has great importance for the development of the physical state of the surface and the residual stress distribution in it. Residual stresses act within a body without external forces or moments. The internal forces form a system of equilibrium.
In many cases, the measuring methods of residual stresses can be classified as destructive or non-destructive. Another more effective classification is to distinguish between direct and indirect methods.
For indirect methods, the equilibrium of internal forces and moments has to be disturbed. The resulting deformations, of the analyzed body or the removed part, deliver the residual stresses of the body. Because of the hardness and chemically resistant indirect methods, destructive methods are less important for residual stress analyses of ceramics.
For direct residual analyzing methods, physical properties of the body are used which can be influenced by stresses. Principally, magnetic, ultrasonic, and x-ray methods are used to determine stress influenced alterations of physical properties. Because of the high state of development and the wide range of experience, x-ray methods are the most common residual stress analyzing methods.
X-Ray-Diffraction Techniques
X-ray diffraction techniques are capable of measuring interatomic spacings, which are indicative of the macro stresses undergone by the specimen. Stress values are obtained from the elastic strains in the crystals; this can be determined by knowing the elastic constants of the material and assuming that stress is proportional to strain which is reasonable for homogeneous, nearly isotropic materials.
BRAGG described x-ray diffraction as a selective diffraction according to the law:
with wavelength of the x-rays λ, the lattice spacing d, and the diffraction angle Θ. Figure 3.48 shows the principle of the x-ray diffraction technique at a single crystal with and without loading.
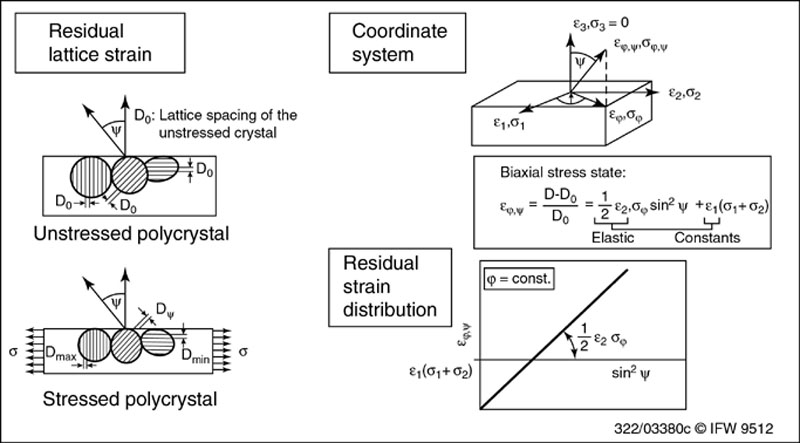
Figure 3.48 Residual stress measuring method
The diffraction angle Θ0 of the unstressed condition will be increased to (Θ0 +  Θ) in the loaded condition. For technical materials such as polycrystalline, the lattice spacing has to be determined for various grains which have the orientation ψ relative to the specimen surface. The lattice strains perpendicular to the surface (ψ =90°) can be calculated mathematically by extrapolation. By setting the lattice strains equal to those which the theory of elasticity would deliver for a biaxial surface stress condition, the basic equation for X-ray stress measurement results:
 (3.9)
(3.9)where:
v, E : Elastic constants
σ : stress at an angle of Φ with a principle stress direction in the specimen surface
ψ : angle between the surface normal and the normal of the crystallographic planes from which an X-ray peak is diffracted
σ1, σ2 : principle stresses in the surface plane
The lattice strains  ϕψ are a linear function of sin2ψ. To calculate the lattice strains ϕψ from the Bragg equation, the exact peak position of the diffracted intensities for different ψ angels are necessary.
Figure 3.49 shows the principle of a ψ-diffractometer on the right, and a picture of a computer-controlled x-ray diffractometer on the left side.
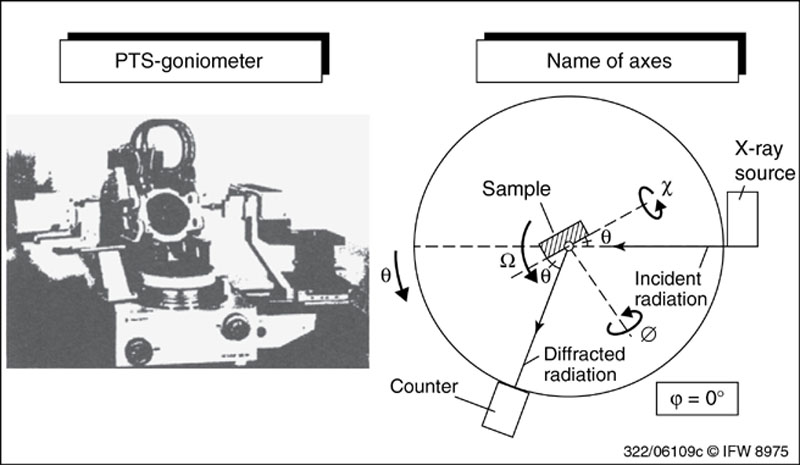
Figure 3.49 X-ray diffractometer
The basic equation for X-ray stress measurement is a special case of the general state of stress condition. Figure 3.50 shows the resulting -sin2ψ-distributions for four different subsurface stress conditions schematically. Differences from the linear stress distribution shown in the upper left picture are due to tilted stress conditions or stress gradients in the subsurface. However, the most common method for stress analysis is the linear computation as mentioned above.
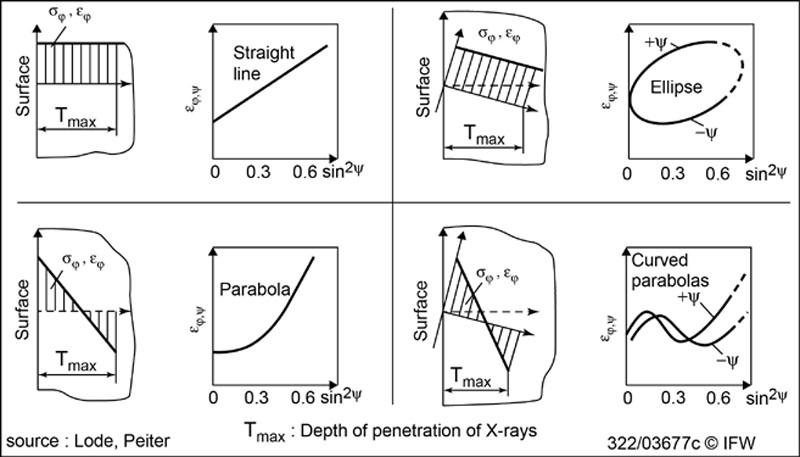
Figure 3.50 -sin2ψ distributions for different subsurfaces stress conditions
Stress Gradients
In many cases, machining processes cause stress gradients in the subsurface which lead to -sin2ψ distribution shown in Figure 3.50. To determine such gradients, different analyzing methods were developed and are used in research and industry.
The penetration depth of the x-rays is a function of the wavelength of the radiation, the analyzed material, and the measuring method. Figure 3.51 shows the penetration depth for different radiations. By using different x-rays, stress gradients can be analyzed. This methodology is very simple but expensive. The diffractometer will be alternated with new x-ray tubes and must be adjusted.
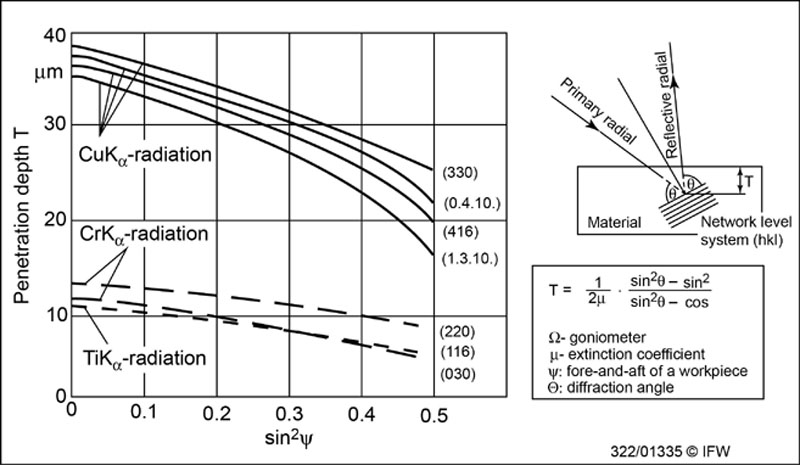
Figure 3.51 Penetration depth of X-rays: simple but expensive
By knowing the reaction of the -sin2ψ distribution on stress gradients, and an increasing curved distribution with increasing sin2ψ based on penetration depth, different computation methods for stress gradients were developed.
An effective technique for the characterization of thin crystalline films and stress gradients uses grazing incidence x-rays. The geometry of the grazing incidence diffraction (GID)-technique and the measuring application is shown in Figure 3.52. The specimen is fixed at a grazing angle with respect to the incident x-ray beam. The detector is scanned along the 2Θ circle in the vertical plane of a diffractometer to record the diffracted x-rays from crystal planes that are inclined to the specimen surface. The penetration depth is a function of the grazing incident angle. The stresses can be calculated from the shifting of the recorded inferences.
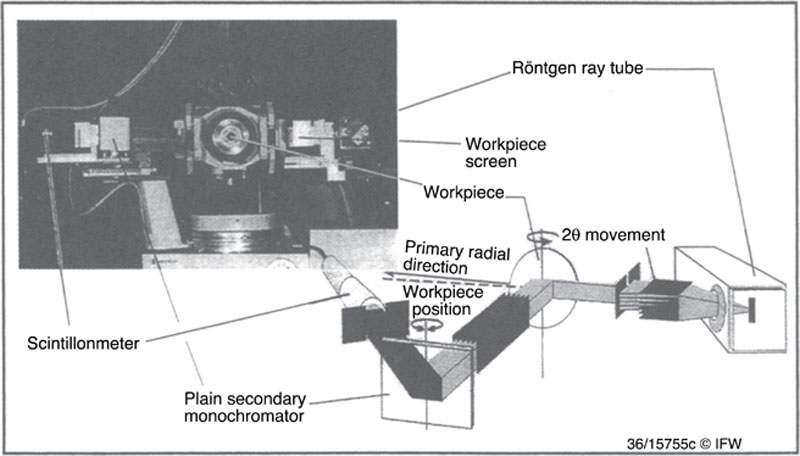
Figure 3.52 Grazing incidence diffractometer (gid) application and principle
Surface Properties
Surface Structure (Topography)
In general, ceramics are brittle materials and their machining is influenced by this. The surface structure as a part of the surface integrity of a component can be an indication of the functionality. In machining ceramics, the state of the material removal mechanisms is important, because rough surfaces are unacceptable for many applications. Therefore, the post-grinding polishing operation typically serves to improve the surface finish. Unlike grinding, the polishing process precedes predominantly ductile or plastic material removal. Polishing is a more expensive process and not accessible for complex geometries. For the investigations of the surface structure, scanning electron microscopy (SEM) is the most common technique.
Figure 3.53 present micrographs of the surface structure of ground alumina to determine the influence of depth of cut in grinding. To increase the depth of grit continuously, the polished specimen were tilted in a surface grinding process. As the grits contact the polished surface, sharp cutting grits immediately start removing material in the ductile mode (cutting). Duller cutting points first remove the sputtered gold coating in elastic contact (rubbing) and then displace material sideways in plastic deformation (ploughing). With increasing grit depth of cut, cracks begin to form, and material is removed by micro-brittle fracture.
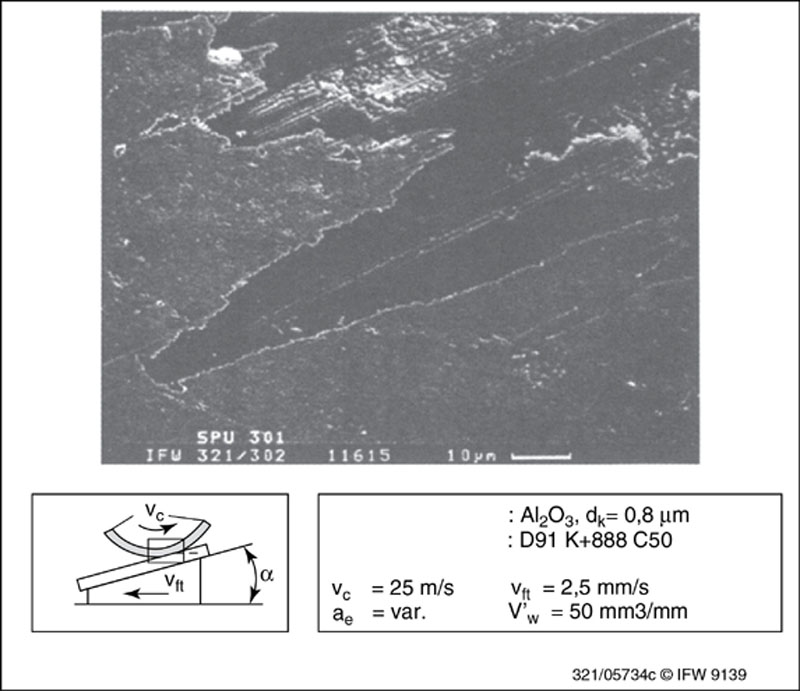
Figure 3.53 Grit-workpiece interaction at low depth of cut
In grinding ceramics the surface structure is not describable by the roughness itself. The material behavior of ceramics undergoes thermal and mechanical loading which leads to surfaces with different characteristics. Figure 3.54 shows micrographs of alumina ground by surface and creep-feed grinding processes with identically roughness Ra and Rz. The structure of the micrographs differs less; both plastic deformation as well as brittle material removal are visualized.
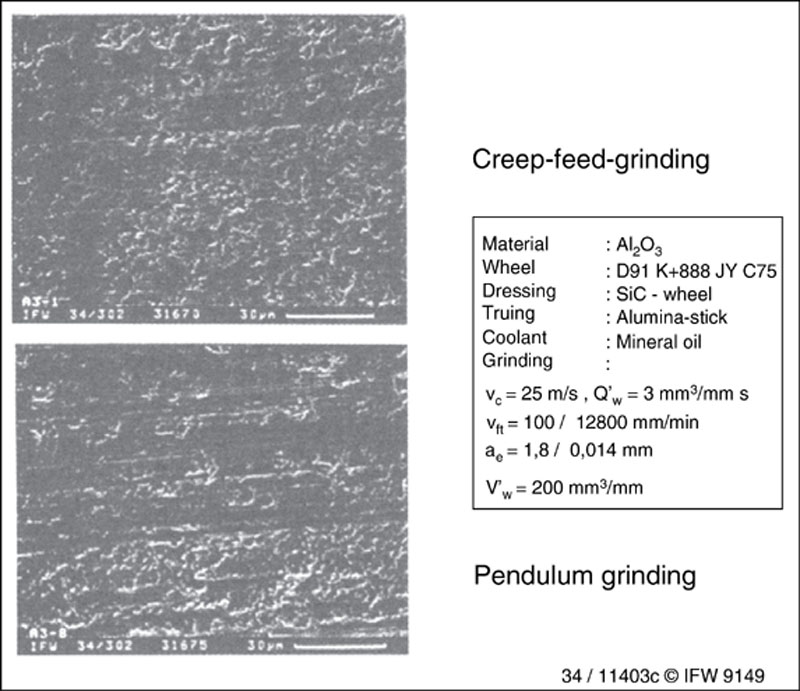
Figure 3.54 Surface structure of ground alumina
The differences in the material behavior are obvious at high magnification, Figure 3.55. Beside brittle-removed material, plastically-deformed material can be seen in both, surface and creep-feed ground surfaces. The plastic deformations are smooth, without excesses in creep-feed grinding, when compared to smeared and rugged, plastically-removed and rebounded material in surface grinding. This observation shows that different thermal and mechanical effects influence the microstructure of the machined ceramics. The different removal mechanisms assume influences on application of machined parts.

Figure 3.55 Plastic deformations in grinding alumina
Besides the machining process itself, the surface structure is also influenced by the material. In view of their mechanical properties, grain size-varied alumina behave very differently in grinding. Figure 3.56 shows SEM micrographs of ground surfaces, which were ground identically at low grit depth of cut. For sintering the investigated alumina at temperatures ranging from 1300 °C to 1700 °C, no additives were used. The average grain size increases from 0.8 to 12 μm with the increase of the sintering temperatures.
Figure 3.56 Surface structure in grinding of different grades of alumina
The ground surfaces exhibit different mechanisms of surface formation. With the increase in grain size, the surfaces become continuously rougher. The removal of single grains dominates over groove formation. The fine-grained variants TM30 and TM40 are covered with smooth grooves. TM50 and TM60 reveal many near-perfect grain facets and TM70 transgranular fracture is observed.
Figure 3.56 has already indicated the dependence of the grinding conditions on surface roughness in machining ceramics. In the grinding direction, the material is cut off. Perpendicular to the cutting direction, plastic deformations lead to higher roughnesses. Figure 3.57, in a polar diagram, shows various grades of alumina ceramic and their respective surface roughness Rz. The surface roughness increases with increasing grain size. The directionality of the roughness gradually disappears with larger material grain sizes because the material removal mechanism changes from ductile to brittle mode.
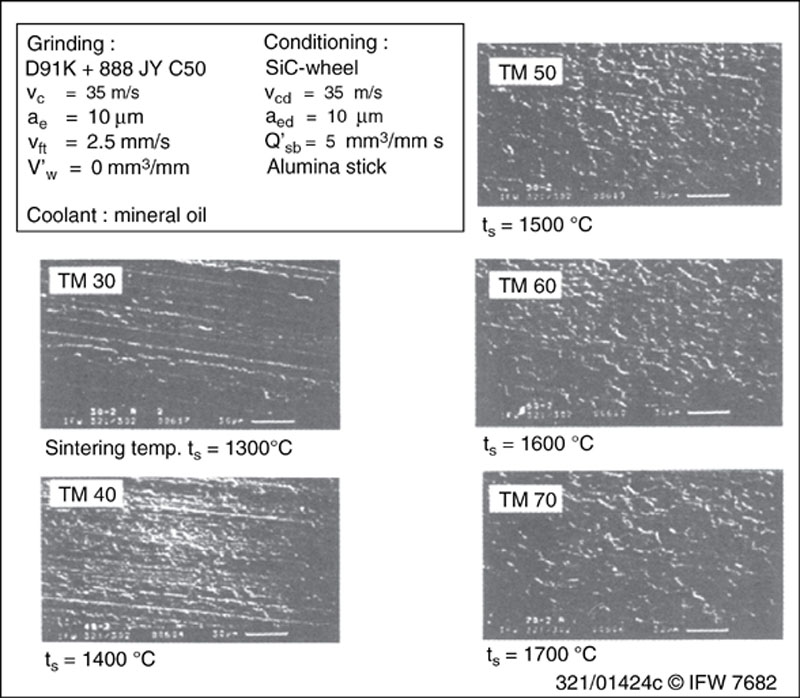
Figure 3.57 Roughness as a function of the grinding condition
In addition to its influence on the grindability, the coolant affects the surface integrity of the ground ceramic. In the grinding of materials which are thermal shock sensitive, like aluminum oxide, the use of coolants with high heat capacity and convection coefficient can lead to a distortion of the surface layer. The influence of different coolants on the surface layer is shown in Figure 3.58. In case of oil, a plastically deformed surface with grinding grooves is shown. On the flanks of the grinding grooves, spalling occurs. These spallings may indicate the presence of brittle fracture during chip formation.
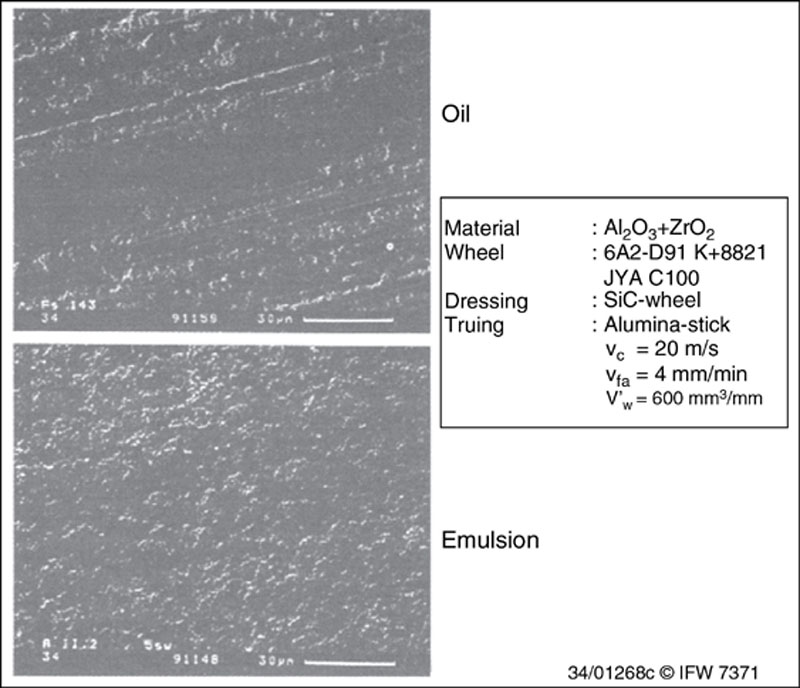
Figure 3.58 Surface structure of alumina after grinding with different coolants
In the case of grinding with emulsion as coolant, no grinding grooves are visible. The surface is determined by unidirectional porosity. Besides the presence of brittle fracture in chip formation, thermal shock due to emulsion cooling seems to play an important role in material removal. The temporal and local variation, from high temperatures at the cutting edge down to ambient temperatures when the abrasive has passed and the coolant reaches the zone, causes thermal stresses inside the material. These thermal stresses can cause cracks and material spalls-off.
Subsurface Properties
Structural Transformations
In abrasive processes, such as polishing, lapping, honing, or grinding, each active abrasive grain generates an intense local stress field and a temperature rise. Thermal and mechanical effects influence the material removal mechanisms and therefore the surface structure.
The addition of finely divided zircon oxide (ZrO2) increases the fracture toughness of ceramics because of crack deflection. Due to mechanical effects, ZrO2 transforms from metastable tetragonal phase into monoclinic phase with a volumetrical increase. This induces stress fields in the matrix ceramic (Al2O3) which lead to crack deviation and elimination. Figure 3.59 shows the principle of the dispersion composite and x-ray-diffractions of non-machined and ground Al2O3-ZrO2-ceramic.
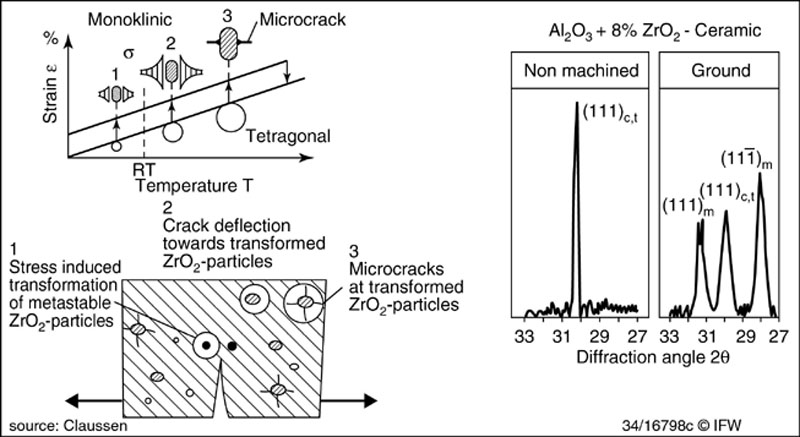
Figure 3.59 ZrO2-transformation
The stress fields of the cutting grains causes irreversible material deformation in form of dislocations, cracks, and void formations. Crushing, ploughing, and rubbing lead to surfaces as shown in chapter ‘Surface topography’. The material removal mechanisms are usually classified into brittle fracture and ductile deformation. Other researchers define the ductile material removal as powder regime. The cut material is resintered on the surface. In these very thin outer layers of ground ceramics, dislocations as well as small grains could be found.
TEM investigations of alumina show the nature of plastic deformations in ceramics, Figure 3.60. They reveal a concentration of dislocations in the cutting path of single grits.
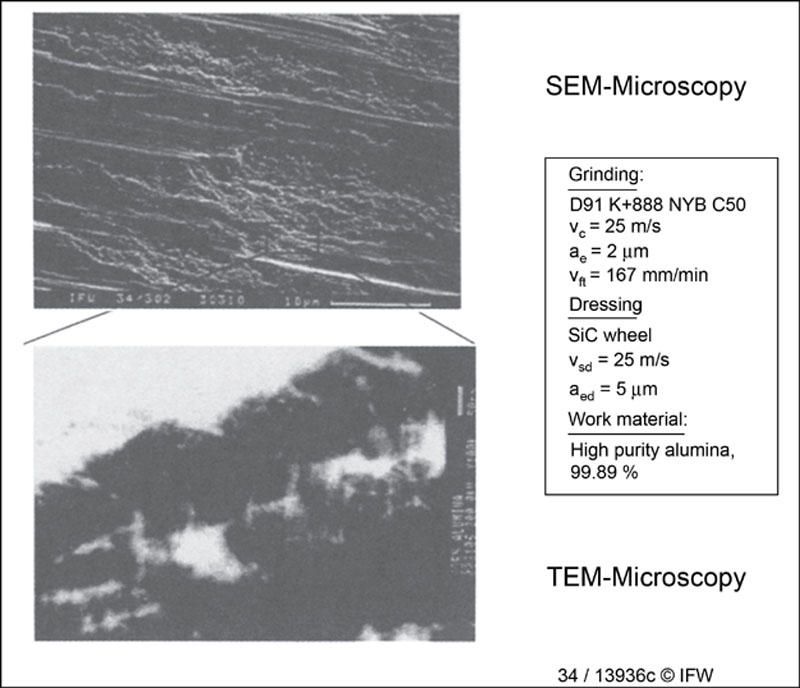
Figure 3.60 TEM investigation of alumina
Hardness
The influenced zone of machined ceramics is very thin. This causes difficulties in the description of the state of the surface properties, especially in hardness inspection. Most hardness measurement techniques are based on destructive measures. The thin surface layer cannot be measured without the influence of the base material. The only way is the microindentation.
Figure 3.61 shows results of microindention and observed near surface properties in ground Si3N4- and Al2O3/ZrO2-ceramics. The results are presented as delta flow pressure curves. The flow pressure (yield stress) is the force divided by the projection of the area of the impression. The delta flow pressure represents the difference between flow pressure in a defined depth of the indentation and unforced material.
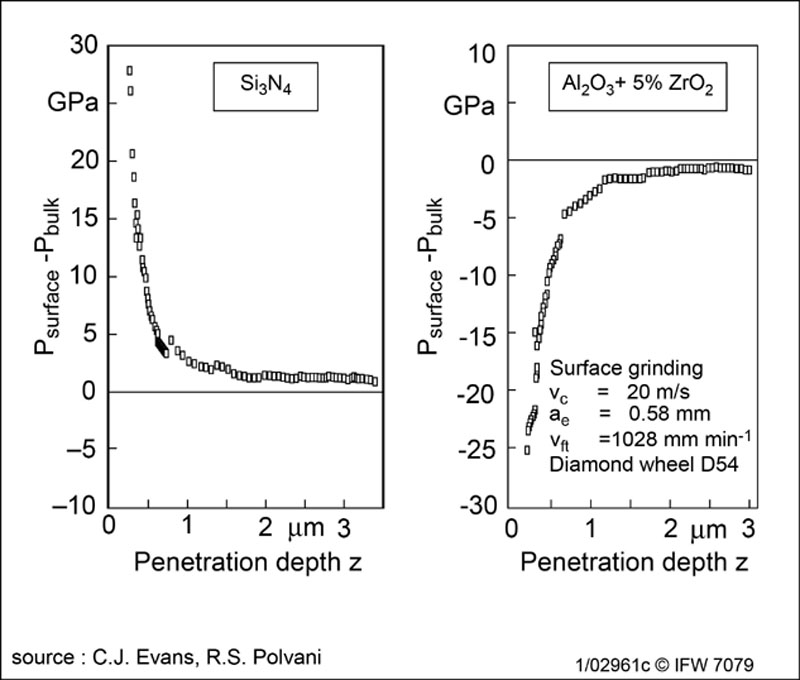
Figure 3.61 Delta flow pressure curves for ceramics
Figure 3.61 shows increasing hardness in the case of ground Si3N4, and decreasing hardness for alumina ceramic. The hardness influenced zone extend for both materials equal to 2-3 μm. In grinding Si3N4, the increased surface hardness is caused by plastic deformations; however, the decreased hardness of the ground alumina is caused of material specific properties. Due to the low thermal shock resistance of alumina, fine cracks occur which leads to hardness softening.
Cracks and Flaws
The strength of materials are given by the microstructure and structure flaws of the material. Machined components are strength influenced by residual stresses and microcracks in the subsurface due to the process. Grinding processes lead to longitudinal, radial, and lateral surface cracks. For material strength, longitudinal and radial cracks are important because of the stress concentration of these notch effects.
The detection of cracks and flaws by dye penetration technique, non-destructive optical, or scanning electronic microscopically methods are not suitable for ceramics because of the size of the microcracks. Only macro-cracks can be detected with these methods.
The most common technique for crack detection in ceramics is the cross section polishing technique. Therefore, the specimen were cut perpendicular to the machined surface. This cross-section will be polished with diamond grits of 3 to 1 μm to remove the influenced layer of the cross-section. Figure 3.62 shows lateral cracks underneath scratches of alumina in a cross-sectional view.
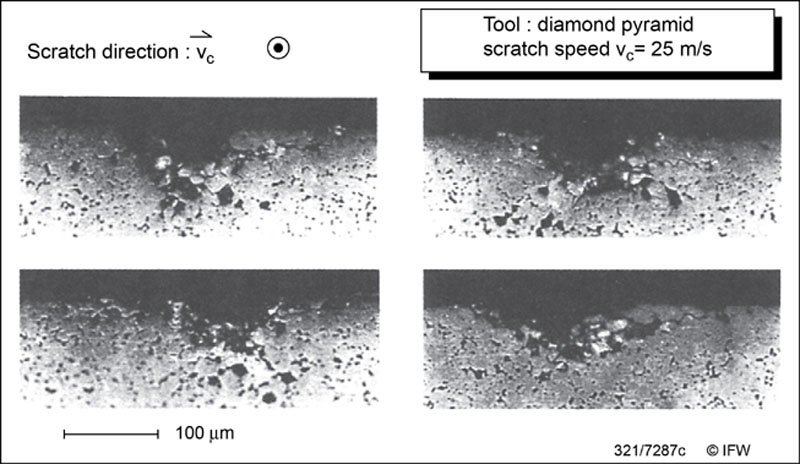
Figure 3.62 Lateral cracks underneath scratches
The amount of microcracks depends on the grinding conditions. Figure 3.63 shows different ground surfaces analyzed by scanning acoustic microscopy [43]. The pendulum ground surface show three times more microcracks than the creep feed ground alumina ceramic surface. This either causes increasing mechanical effects (grit depth of cut) due to higher workpiecespeed or high thermal alternation (gradients) due to the faster moving heat source.
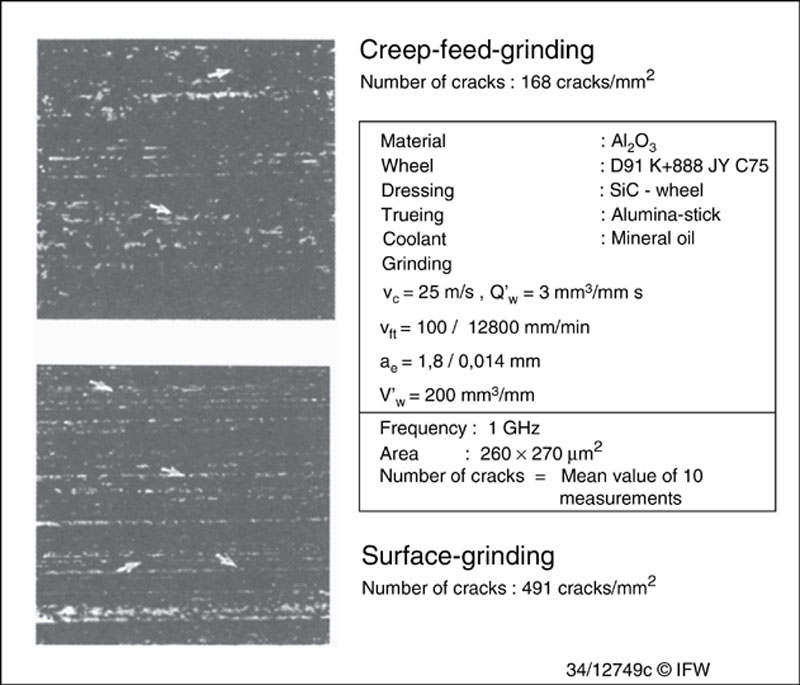
Figure 3.63 Crack population for different grinding conditions
Residual Stresses and Microstrain
For the exact description of the state of residual stresses in ground surfaces, it is necessary to determine the orientation of the main stress direction. From metallic materials, it is known that non-directional processes produce no preferred orientation of the residual stresses. In contrast, orientated processes like cutting or grinding are known to produce a distinctive stress orientation. This is also true for residual stresses in ground ceramics, Figure 3.64. The measurements revealed that the main stress direction is oriented perpendicular to the direction of cut, whereas a minimum is found in the direction of cut.
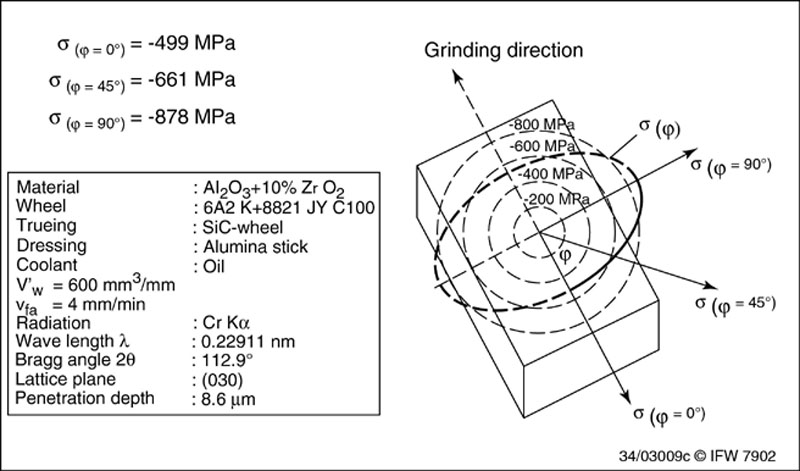
Figure 3.64 Influence of the machining direction on residual stresses
The directional dependence of stresses in the surface layer correlates with the mechanical effects of the cutting edges. The largest amount of plastic deformation is found perpendicular to the cutting direction. The material remaining in the cutting path is deformed plastically to a smaller extent due to the crushing effects during material removal.
The influence of the mechanical effect of the grits can be verified by using different wheel specifications. With increasing grit size, the grit depth of cut increases, whereas increasing number of cutting edges due to increasing concentration leads to decreasing grit depth of cut. Figure 3.65 shows the residual stresses as a function of the cutting speed, for wheels with different grit sizes and concentrations. At a defined cutting speed, a coarser wheel with fewer cutting edges (i.e. coarser grit size or lower concentration) showed higher compressive stresses. Furthermore, all wheel specifications showed the same tendency of lower compressive stresses at higher cutting speeds because of lower grit depth of cut with increasing cutting speed.
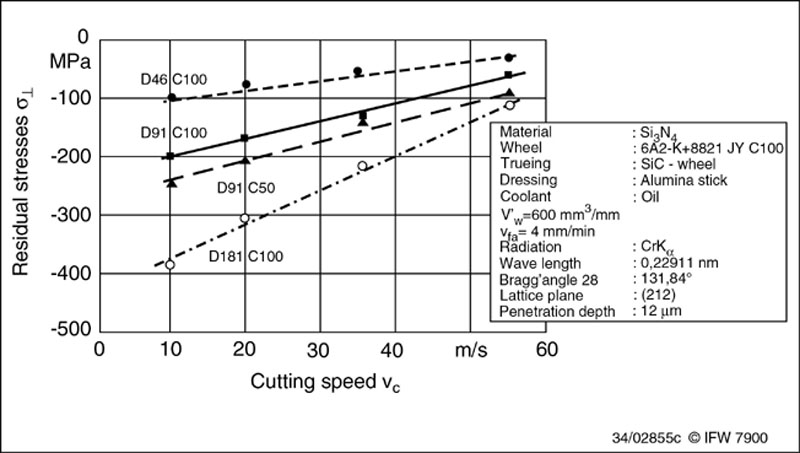
Figure 3.65 Residual stresses for different machine settings and system quantities
Residual Stress Gradients
The penetration depth of x-rays depends on their wave length. It is defined as the value where the primary intensity is reduced to l/e, or 37 percent of the initial value. In ceramics, the layer of residual stresses extend well below the surface, and there are high stress gradients within the penetration depth of the radiation. Figure 3.66 shows a typical profile of residual stresses in a surface ground alumina ceramic. Three different radiations were used to analyze the stresses at different lattice planes and different Bragg angels respectively. Directly underneath the surface, high compressive stresses were found with a decrease of lower compressive stresses with increasing penetration depth.
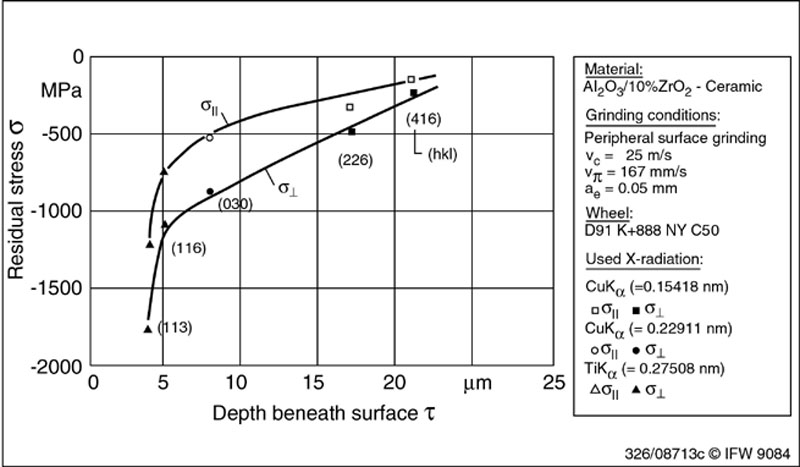
Figure 3.66 Stress versus depth profile in ground AL2 O3/ZrO2-ceramic
These gradients depend on the grinding conditions. Figure 3.67 shows the residual stresses of alumina as a function of the workpiece’s speed in surface grinding measured with two different radiations. With increasing workpiece speed, the lower penetrating titanium radiation leads to greater compressive stresses than with chromium rays, which cause increasing stress gradients. For creep-feed grinding the stresses of both radiations are nearly the same.
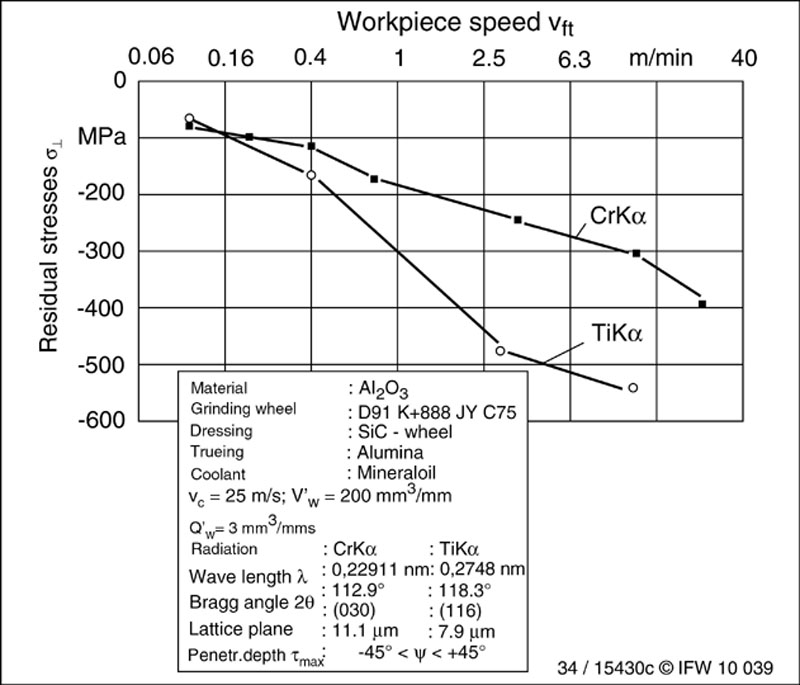
Figure 3.67 Residual stresses with different radiations
Investigations, using a method based on evaluating the curvature of the sin2ψ-2Θ-distribution (i.e. sin2ψ--distribution) due to inhomogeneous stresses in the surface confirm the results described above. With increasing orientation angel ψ, the penetration depth of the radiation decreases. Therefore, information from different depth can be evaluated. Figure 3.68 shows the stress gradients in alumina ground with creep-feed and surface grinding conditions. The creep feed ground surface shows a very low stress gradient compared to a high gradient for surface grinding conditions. The stresses perpendicular to the grinding direction are higher than the stresses parallel to the grinding direction. This technique calculates the stresses based on measuring data; the valid region reaches from 1.4 μm to 10.6 μm.
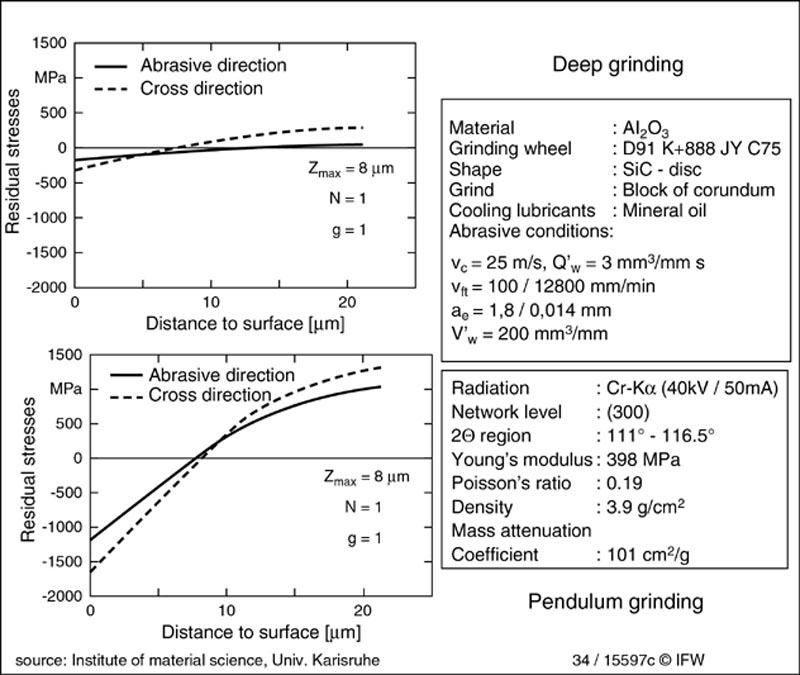
Figure 3.68 Residual stress gradients in creep-feed and surface-ground alumina
..................Content has been hidden....................
You can't read the all page of ebook, please click here login for view all page.