
10
Exciplex: Its Nature and Application to OLEDs
Hwang‐Beom Kim1, Dongwook Kim2, and Jang‐Joo Kim3
1Seoul National University, Department of Materials Science and Engineering, 1 Gwanak‐ro, Gwanak‐gu, Seoul, 151‐744, South Korea
2Kyonggi University, Department of Chemistry, 154‐42 Gwanggyosan‐Ro, Yeongtong‐Gu, Suwon, 16227, South Korea
3Seoul National University, Department of Materials Science and Engineering and Research Institute of Advanced Materials (RIAM), 1 Gwanak‐ro, Gwanak‐gu, Seoul, 151‐744, South Korea
Exciplexes have been widely employed in organic light‐emitting diodes (OLEDs) by virtue of the thermally activated delayed fluorescence (TADF) characteristics and the convenience of exploiting exciplexes to OLEDs. Exciplexes are readily formed when the blend films of donor molecules and acceptor molecules are excited. We treat the fundamentals of exciplexes and their application to OLEDs in this chapter. First, the electronic structures and properties of exciplexes and various transition processes associated with exciplex systems are covered. Later, OLEDs employing exciplexes as emitters as well as sensitizers are reviewed.
10.1 Introduction
Intermolecular interactions among various molecules have drawn a great deal of attention because they are ubiquitous not only in biology and supramolecular chemistry but also in organic electronics. In particular, the noncovalent weak intermolecular interactions among π‐conjugated molecular units are of utmost interest for the organic electronics applications, e.g. OLEDs and organic photovoltaics (OPVs), because they affect the morphology of the active layer film, which has a close link to the device performance. Not surprisingly, these intermolecular interactions in the ground state are notably different from those in the excited state, generating new species. A dimer of the same kind bound in the excited state but repulsive in the ground state is defined as an excimer (excited + dimer); likewise, a dimer of a different kind is denoted as an exciplex (excited + complex). Given that the fundamental processes in the organic electronics include the electronic excitations in the solid‐state film of π‐conjugated organic materials, the formation of exciplexes is supposed to be widespread. In OPVs, for example, the initial exciton of donor or acceptor materials, i.e. locally excited (LE) state of a donor or acceptor, dissociates at the donor–acceptor interface forming the charge‐transfer (CT) exciplex state as an intermediate state, which is followed by the charge separation producing free charges. In OLEDs, reverse processes take place, i.e. electrons in acceptor molecules and holes in donor molecules come close by Coulomb interaction or by electric potential to form the CT exciplex states. Therefore, the electronic structure of such an exciplex state with regard to that of the LE state of constituent materials is one of the key factors to consider in the fabrication of efficient devices.
As a light‐emitting guest in the emissive layer, the exciplex has remained out of interest due to their rather poor performances. Recently, however, the exciplex formation has been brought into researcher's attention. Goushi et al. and Park et al. demonstrated an enhancement with their devices of 10% external quantum efficiency (EQE) using a 4,4′,4″‐tris[3‐methylphenyl(phenyl)amino]triphenylamine (m‐MTDATA):2,8‐bis(diphenylphosphoryl)dibenzo[b,d]thiophene (PPT) and 4,4′,4″‐tris(N‐carbazolyl)‐triphenylamine (TCTA) and bis‐4,6‐(3,5‐di‐3‐pyridylphenyl)‐2‐methylpyrimidine (B3PYMPM) blend layers as emitting layers [1–3]. This work was followed by a lot of studies, including the ones of Hung et al. and Kim et al. where devices with an EQE of 11% and an internal quantum efficiency (IQE) of almost 100% were reported using exciplexes as emitters, respectively [4–6]. Provided that these materials are purely organic molecules, the strong spin–orbit coupling (SOC) and the phosphorescence from these materials are hardly expected. Therefore, these results strongly suggest that the exciplex formation plays a role in the conversion from the triplet excited state to the singlet one and hence improves the performance of OLEDs. In this regard, the fundamental understanding of various features of the exciplex is essential to fabricate more efficient OLEDs.
In this chapter, we begin our discussion with the fundamentals of exciplexes including their electronic structures, properties, and kinetics of various processes related to them. Later, we evolve our discussion to the applications of exciplexes to OLEDs.
10.2 Formation and Electronic Structures of Exciplexes
Excited CT complex – in short, exciplex – is formed by CT between an excited donor (D*) and an acceptor or a donor and an excited acceptor (A*) as shown in Figure 10.1. Generally, the energy levels of the highest occupied molecular orbital (HOMO) and the lowest unoccupied molecular orbital (LUMO) of the donor molecule are higher than those of the acceptor molecule. Since exciplex formation can be viewed as the CT from an LE molecule to its neighboring one, the wave function of the exciplex can be written as a linear combination of LE, CT, and neutral ground states: [7]
where the coefficients pertain to the relative contribution of each state and D and A represent electron donor and acceptor, respectively. The first two terms on the right‐hand side of the equation correspond to the LE states of D and A, the third term is associated with the CT states, and the last one points to the ground state, respectively. If ground‐state influences on the exciplex state are neglected, Eq. (10.1) further reduces to
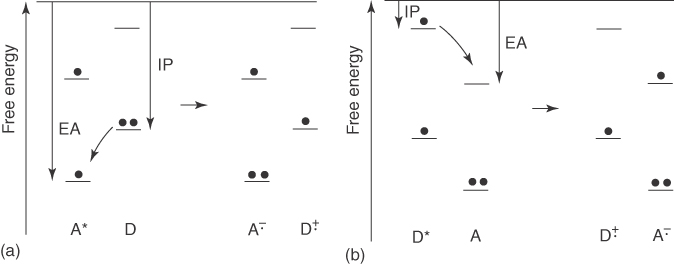
Figure 10.1 Schematic illustration of the exciplex formation via the charge transfer when either (a) the electron acceptor or (b) electron donor is excited [7]. Reproduced with permission of American Chemical Society.
The fraction of charge transfer fCT in the exciplex is defined by the following equation:
The intermolecular CT state energy in the gas phase is represented by
where IPD is the ionization potential (IP) of the donor, EAA is the electron affinity (EA) of the acceptor, EB is the binding energy of the CT state, and ΔEDA = IPD − EAA.
From Figure 10.1, simple rules for determining the feasibility of electron transfer (ET) can be written as follows: [8]
D* + A → D+ + A−
D + A* → D+ + A−
For an exciplex, EB can be defined as the difference between the exciplex energy and the sum of energies for the free radical ion pair:
Therefore, the exciplex energy depends on the degree of CT, which will be described later in details. EB stems mainly from the electrostatic interactions of a hole–electron pair. Because of the short distance between the hole and electron in the LE state, EB for the LE state is in general larger than that for the CT state where the hole and electron are spatially separated. This indicates that although the above conditions are satisfied, the exciplex can be less stable than LE individual molecules. Upon excitation, for instance, a pair of poly[2‐methoxy‐5‐(2′‐ethylhexyloxy)‐p‐phenylenevinylene] (MEH‐PPV) and poly(2,5,2′,5′‐tetrahexyloxy‐7,8′‐dicyano‐di‐p‐phenylenevinylene) (CN‐PPV) undergoes an ET to form an exciplex. On the other hand, an energy transfer (ENT) takes place in the pair of poly(2‐dimethyloctylsilyl‐1,4‐phenylenevinylene) (DMOS‐PPV) and CN‐PPV [9]. It was claimed that the transition from the LE state to the CT state requires the energy penalty on the order of 0.35 eV, leading to the higher CT state in energy for the latter. They proposed that the pair with the smaller ΔEDA favors the ET, whereas the one with the larger ΔEDA does the ENT; see Figure 10.2.
![Schematic diagrams of (top) molecular energy and (bottom) excited state levels of poly(2-dimethyloctylsilyl-1,4-phenylenevinylene) (DMOS-PPV)/CN-PPV and poly[2-methoxy-5-(2′-thylhexyloxy)-p-phenylenevinylene] (MEH-PPV)/CN-PPV systems.](http://images-20200215.ebookreading.net/4/1/1/9783527339006/9783527339006__highly-efficient-oleds__9783527339006__images__c10f002.jpg)
Figure 10.2 Molecular and state energy levels of DMOS‐PPV/CN‐PPV and MEH‐PPV/CN‐PPV systems [9]. Reproduced with permission of American Physical Society.
In the case of the triplet state, similar cases are more often found. Exchange energy, K, is often invoked to explain the difference between the singlet and triplet states; ignoring the electron correlation effect, and if the singlet and triplet excited states are of the same nature, then the energy difference between these states corresponds to 2 K [10]. Coulomb integral, J, and K are defined as

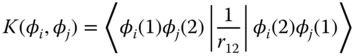
where φi represents wave function for particles (an electron and a hole) and r12 is the distance between particles 1 and 2. Basically, K is a quantum mechanical correction for J between two charged particles. It arises from the fact that an electron is indistinguishable and subject to Pauli exclusion principle. As a result of the antisymmetry of the wave function, K of a hole–electron pair destabilizes the singlet excited state and stabilizes the triplet excited state, putting more emphasis on the role of EB for the triplet excited state [8, 11, 12]. Provided that K is interpreted as the Coulomb interaction between the overlap of the hole and electron wave functions [13], K for the LE state is larger than that of CT state. Therefore, the binding energy for the triplet LE state is more enhanced, suggesting that the energy penalty for the transition from the triplet LE state to the triplet CT state be even larger than that for the singlet process. In order for the triplet CT state to be formed, ΔEDA should be more significantly reduced [9, 11].
Since exciplex is formed by CT from an LE molecule to its neighboring ground‐state molecule, the electronic couplings between frontier molecular orbitals of individual molecules play an important role in the exciplex formation. Given that such electron couplings are affected by the separation distance, orientation, and symmetry of molecules [14], the donor and acceptor molecules are supposed to have small interplanar distances and parallel alignments between their molecular planes to form the exciplexes [15, 16]. Inai et al., for example, investigated various structural isomers of polypeptides with a p‐(dimethylamino)phenyl group as a donor unit and a naphthyl group as an acceptor unit [16]. They found that the exciplex formation is more effective in the face‐to‐face configurations than the head‐to‐tail ones. In addition, their exciplex is formed at the intermolecular spacing of 0.83 nm, but not at 1.20 nm. Thus, molecules with the twisted conformation [17] or bulky, three‐dimensional groups [18] were designed to prevent the exciplex formation.
The nuclear reorganization energy also plays a role in the ET [7, 14]. The large geometric difference between the LE state and the exciplex state would require the large excess energy for the transition, impeding the exciplex formation [19]. The exciplex formation can also be inhibited by putting the electron‐rich moiety right next to the electron‐deficient moiety because they could weaken each other's electron‐rich or electron‐deficient properties [20]. On the other hand, the exciplex formation can also be controlled by the modulation of intermolecular interactions. The excited molecule with high dipole moment could induce a dipole in the neighboring molecule with high polarizability. This gives rise to an enhanced intermolecular interaction in the excited state and consequently facilitates the formation of exciplexes [21]. Small molecular pairs of donor and acceptor molecules are collected in the Appendix of this chapter.
Exciplexes in solid state are expected to have various dimer geometries with different distances between D and A molecules, resulting in a broad energy band [3, 22]. Exciplexes with different D–A distances have different degrees of CT between D and A. Exciplexes with shorter D–A distances have larger CT, lower energy due to the Coulomb interaction proportional to r−1, and smaller ΔEST and slower decay rates due to the lower overlap between the frontier orbitals.
10.3 Optical Properties of Exciplexes
10.3.1 Photoluminescence of Exciplexes
Photoluminescence (PL) spectra of exciplexes are generally featureless, broad, and redshifted from the constituting molecules and depend on the degree of CT in the complex. Therefore, features of PL spectra, e.g. ν0 − 0, νav, vibronic structure of the spectra, etc., provide important information regarding a given exciplex. Such characteristics are also influenced by the surrounding medium; as schematically displayed in Figure 10.3, the PL spectra of CT states tend to be more redshifted as the solvent becomes more polar. Because exciplexes, in general, have mixed LE and CT characters and spectral features of the pure LE and pure CT states are markedly different, PL spectra of exciplexes reflect the valuable information including its relative weight of CT character. Figure 10.4, for instance, shows the PL spectra of the exciplexes consisting of 9,10‐dicyanoanthracene (DCA) and various alkylbenzene donors in cyclohexane [25]. Note that the excitation energy for DCA is significantly smaller than those of various alkylbenzene derivatives due to the longer π‐conjugation length of the former, and hence the energies for the lowest LE state of DCA–alkylbenzene exciplexes remain constant. The decrease in the oxidation potentials of the donors (Eox in the figure) corresponding to the elevation of the HOMO energy level of the donors stabilizes more the pure CT state with respect to the pure LE state. This increases the CT character of exciplexes, leading to the more redshifted PL spectra. In addition, such enhanced CT nature in the exciplexes gives rise to the less structured PL spectra because the vibrational progression is caused mainly by the pure LE state.
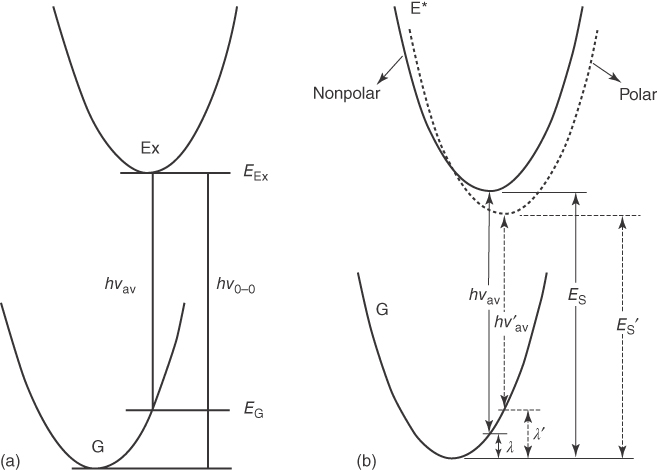
Figure 10.3 Pictorial description of the 0–0 transition energy, hν0 − 0, and average emission energy, hνav (a) [23]. Illustration of the effect of solvent polarity on the photoluminescence (PL) spectra (b) [24]. Ex and G denote the excited and ground states, respectively. Parabolas represent the respective electronic states of a given molecular system including the surround medium, e.g. solvent; λ is the reorganization energy for the emission. Here, we did not take into account of zero‐point vibrational energy (ZPVE) levels for the sake of simplicity. The figure was modified from the original ones of the References. Reproduced with permission of American Chemical Society.
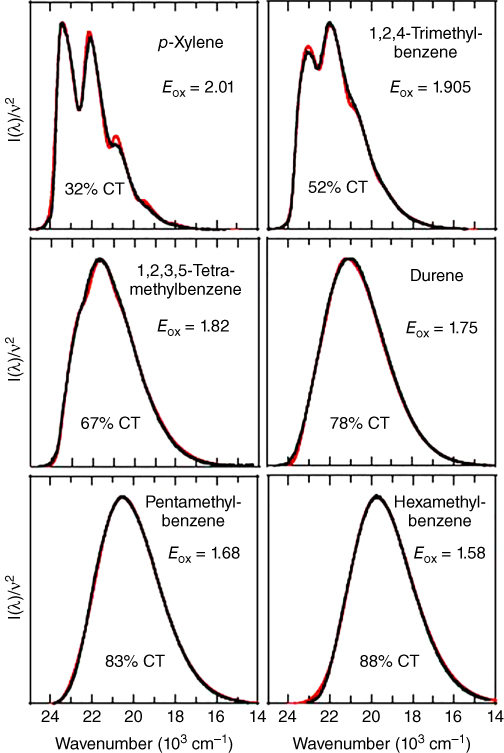
Figure 10.4 PL spectra (black) and simulated curves (red) of exciplexes with different degrees of CT consisting of DCA and various alkylbenzene donors in cyclohexane [25]. Reproduced with permission of John Wiley & Sons.
Recently, exciplex emission in the solid state was interpreted based on a broad energy band due to various dimer geometries, which have different distances between the donor (D) and acceptor (A) molecules (C.‐K. Moon and J.‐J. Kim, unpublished). Exciplexes with different D–A distances have different degrees of CT between D and A. The low‐energy exciplex emission is largely from the CT state, but the LE state makes a larger contribution to high‐energy exciplex emission.
10.3.2 Absorption Spectra of Exciplexes
In contrast to the PL spectra of exciplexes, the absorption peaks for the exciplex state are usually insignificant. Figure 10.5 shows the PL and absorption spectra of the TAPC and 6,6′‐bis(2‐4diphenylquinoline) (B1PPQ) neat films and TAPC:B1PPQ blend films as a function of their molar ratio, where TAPC serves as an electron donor and B1PPQ as an electron acceptor [26]. Only emissions from the exciplex state are observed in the blend films with 10–50 mol% load of B1PPQ. This indicates that almost all the excitons in the blend films end up with the exciplex. Nevertheless, absorption peaks corresponding to the exciplex state are not shown in such blend films as shown Figure 10.5b. The absorption spectra of the blend films are reproduced by the linear combination of the absorption spectra of the D and A molecules with no CT absorption. This indicates that the exciplexes are not directly formed from the ground state by photoexcitation, but formed by CT from the excitons of the constituent molecules. In other words, the exciton of the constituent molecule acts as a precursor to the exciplex.
![Illustrations of photoluminescence (PL) (left) and absorption (right) spectra of the 1,1-bis[4-[N,N′-di(p-tolyl)amino]phenyl] cyclohexane (TAPC) and 6,6′-bis(2-4diphenylquinoline) (B1PPQ) neat film and TAPC:B1PPQ blend films with various molar ratios.](http://images-20200215.ebookreading.net/4/1/1/9783527339006/9783527339006__highly-efficient-oleds__9783527339006__images__c10f005.jpg)
Figure 10.5 (a) PL and (b) absorption spectra of the TAPC and B1PPQ neat film and TAPC:B1PPQ blend films with various molar ratios [26]. Reproduced with permission of American Chemical Society.
However, recent elaborate studies identified new absorption peaks corresponding to the exciplex state in the donor–acceptor blend films [27–34]. Figure 10.6a shows the PL spectrum of the MDMO‐PPV:PCBM (1 : 4) blend film [35]. In comparison with the PL spectra of the pristine films of the constituent molecules shown in the inset of Figure 10.6a, a broad peak around 1.35 eV was identified as an emission peak from the exciplex state to the ground state. Utilizing Fourier transform photocurrent spectroscopy (FTPS), an extremely sensitive technique for low‐intensity peak via the photocurrent measurement, they found a new redshifted, broad, and weak absorption peak around 1.65 eV as seen in Figure 10.6b [27]. This peak is lower in energy than the respective absorption of MDMO‐PPV and PCBM and hence attributed to the singlet exciplex state.

Figure 10.6 (a) PL [35] and (b) FTPS [27] spectra of the MDMP‐PPV:PCBM (1 : 4) blend film. The new weak absorption below 1.65 eV is only observed in the blend film originating from the CT absorption. Reproduced with permission of John Wiley & Sons.
10.4 Decay Processes of the Exciplex in Solution
The fluorescence rate constant for a given exciplex is low compared with those of its constituent molecules, giving the exciplex the relatively long lifetime. Therefore, various processes involved in the decay of an exciplex are in competition as shown in Figure 10.7. Now, we turn to such processes, starting with the fluorescence rate of the exciplex.

Figure 10.7 Illustration of various decay processes for the exciplex‐forming system.
10.4.1 Fluorescence Rate Constant for the Exciplex State
Fluorescence rate constant, kf, increases as the transition dipole moment, M, and the energy gap between the ground and the excited states increase. It is expressed as follows: [23]
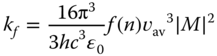
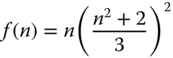
where h, c, and ɛ0 is the Planck constant, the speed of light, and the dielectric constant for vacuum and M is transition dipole moment. f(n) is a function of the refractive index, n, of surrounding medium and, assuming the spherical cavity of the emitting species in the solvent, written as
and vav is the average emission frequency, which is defined in Eq. (10.14):
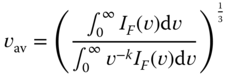
where IF(v) is the emission intensity expressed in photons per unit time per unit spectral energy and k is 1 or 3 when the excited state has high CT character or high LE character, respectively.
The transition dipole moment, M, is defined as
where ψG and ψEx represent the ground‐state and excited‐state wave functions, respectively, and ![]() is the dipole moment operator. If the wave function for the exciplex state is plugged in Eq. (10.15), the expression for the transition dipole moment of the exciplex, Mexciplex, is obtained when LE states are originated from acceptors:
is the dipole moment operator. If the wave function for the exciplex state is plugged in Eq. (10.15), the expression for the transition dipole moment of the exciplex, Mexciplex, is obtained when LE states are originated from acceptors:
The transition dipole moment for the pure ion pair, i.e. [D+A−], can be written as
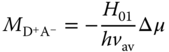
where H01 is the matrix element for the electronic coupling between the ground and the pure ion pair states and Δμ is the dipole moment difference between such states. Note that Δμ and ![]() are vectors and kf is proportional to |M|2, leading to the dependence of kf on the angle, θ, between Δμ and
are vectors and kf is proportional to |M|2, leading to the dependence of kf on the angle, θ, between Δμ and ![]() . Then, Eq. (10.12) can be modified to [23, 36–38]
. Then, Eq. (10.12) can be modified to [23, 36–38]

where ![]() and
and ![]() denote the emission energies for the exciplex and acceptor (or the molecule associated with the lower LE state), respectively; H12 is the matrix element for the electronic coupling between the exciplex state and the LE state of the acceptor; and Δμ can be experimentally evaluated from the solvatochromism of the exciplex. The emission maximum in a solution, νav(ɛ), is influenced by the solvent polarity and expressed as [23]
denote the emission energies for the exciplex and acceptor (or the molecule associated with the lower LE state), respectively; H12 is the matrix element for the electronic coupling between the exciplex state and the LE state of the acceptor; and Δμ can be experimentally evaluated from the solvatochromism of the exciplex. The emission maximum in a solution, νav(ɛ), is influenced by the solvent polarity and expressed as [23]

where ρ is the radius of the exciplex solvent cavity and ɛ and n are the solvent dielectric constant and refractive index, respectively, and thus νav(0) corresponds to the emission frequency in the vacuum. Here, the ground‐state static dipole moment of the exciplex is ignored. However, such assumptions are not completely fulfilled, and the model strongly depends on ρ. Therefore, the Δμ value of this model should be taken with some caution.
Figure 10.8 shows the experimental value of ![]() for various exciplexes of TCA and alkylbenzene derivatives as a function of
for various exciplexes of TCA and alkylbenzene derivatives as a function of ![]() and fitted curve based on Eq. (10.18); note that f(n) is replaced by n3 here [38]. The experimental data were obtained from exciplexes consisting of TCA and alkylbenzene donors in various solvents. The accord between them is remarkable, suggesting that the model is highly useful.
and fitted curve based on Eq. (10.18); note that f(n) is replaced by n3 here [38]. The experimental data were obtained from exciplexes consisting of TCA and alkylbenzene donors in various solvents. The accord between them is remarkable, suggesting that the model is highly useful.
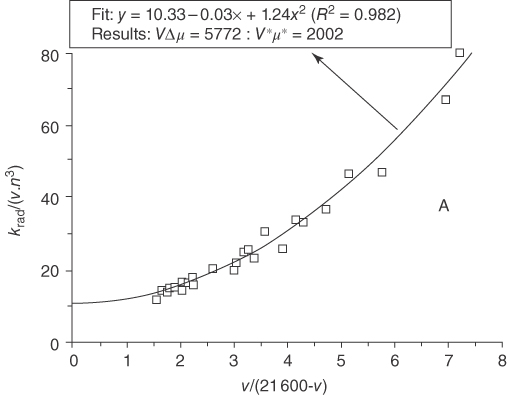
Figure 10.8 Experimental value of  for exciplexes consisting of TCA and alkylbenzene as a function of
  where
where  for TCA corresponding to the lower LE state in energy and the fit line of Eq. ( 10.18
) [38]. Reproduced with permission of John Wiley & Sons.
for TCA corresponding to the lower LE state in energy and the fit line of Eq. ( 10.18
) [38]. Reproduced with permission of John Wiley & Sons.
These theoretical and experimental results show that the fluorescent rate constant of the exciplex decreases as the energy difference between the LE and the exciplex states increases – in other words, as the degree of CT in the exciplex increases (increased CT character).
10.4.2 Contact Radical Ion Pair (CRIP) Versus Solvent‐separated Radical Ion Pair (SSRIP)
In going from the exciplex to the fully separated free ion pair in solution, contact radical ion pair (CRIP) and solvent‐separated radical ion pair (SSRIP) are the intermediates of importance. In the presence of solvent molecules, free energies for such states include the solvation energy term as follows: [7]
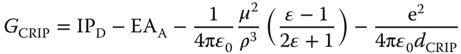
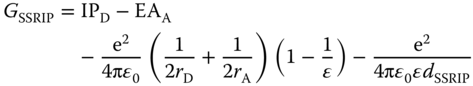
where μ and ρ denote the static dipole moment of the CRIP and the radius of the CRIP solvent cavity; rD and rA are the radius of donor and that of acceptor, respectively; and dCRIP and dSSRIP refer to the distances between the radical ions in the CRIP and SSRIP, respectively. The first two terms correspond to the IP of the donor and EA of the acceptor, the third and last terms are associated with the solvation energy and Coulombic interactions of the CRIP/SSRIP.
Figure 10.9 shows the experimental data and the fitting lines of ΔRIP as a function of the static dielectric constant of various solvents [39]. In the figure, ΔCRIP ≡ GCRIP − e(Eox − Ered) and ΔSSRIP ≡ GSSRIP − e(Eox − Ered). The open circles denote singlet CRIPs of 1,2,4,5‐tetracyanobenzene (TCB), pyromellitic dianhydride (PMDA), 1,4‐dicyanobenzene (DCB), and TCA as acceptors with various alkylbenzenes as donors in various solvents. The closed circles denote SSRIPs of TCB with p‐xylene. As demonstrated in Figure 10.9, in the case of nonpolar solvent, CRIP is more stable than SSRIP. However, the relative stability of SSRIP to CRIP is more enhanced as the solvent becomes more polar, and finally SSRIP becomes more stable than CRIP when ɛ > 13.
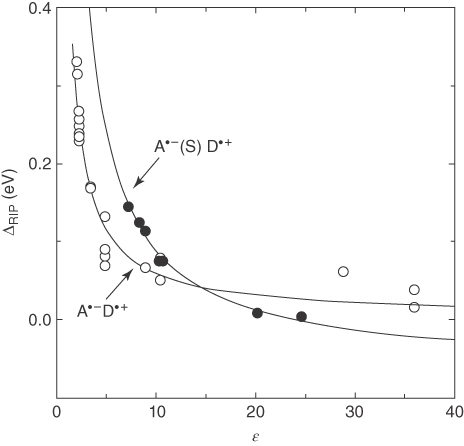
Figure 10.9 Experimental data and the fit lines of ΔRIP for the CRIP (A·−D·+) and SSRIP (A·−(S)D·+) as a function of the static dielectric constant of various solvents [39]. Reproduced with permission of American Chemical Society.
Both CRIP and SSRIP can return to the ground state via an ET. Therefore, the rate constant of such an ET influences the lifetimes of CRIP and SSRIP. By assuming that the solvent is characterized by a Debye relaxation spectrum, Jortner and Bixon obtained the ET rate constant [40]
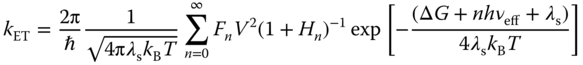
where kB and T are the Boltzmann constant and the absolute temperature; λs is the reorganization energy for the ET regarding solvent relaxation and low‐frequency vibration of the molecule that can be treated classically; V is the matrix element for the electronic coupling between initial and final electronic states; ΔG is the free energy difference in the ET; νeff is the frequency of the effective mode for the high‐frequency molecular vibration; S is the Huang–Rhys factor defined as ![]() ; and τL is the Debye longitudinal relaxation time of the medium that corresponds to the dielectric relaxation time.
; and τL is the Debye longitudinal relaxation time of the medium that corresponds to the dielectric relaxation time.
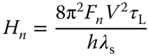
Figure 10.10 shows the radiationless recombination ET rate constant, k−et, as a function of the associated free energy change, −ΔG−et. By fitting the experimental data using Eq. (10.22), the electronic coupling, V, and the reorganization energy, λs, regarding the ET were determined to be 0.12 and 0.55 eV, respectively, for CRIPs and 1.3 meV and 1.72 eV, respectively, for SSRIPs. The results demonstrate that the electronic coupling for the ET is much stronger for the CRIPs than SSRIPs, consistent with the shorter distance between the radical ion pair in the CRIPs. In addition, the much larger λs for SSRIPs can be attributed to the more solvent molecules involved in the solvation of SSRIPs.
Figure 10.10 (a) Radiationless recombination ET rate constants as a function of the free energy of ET for experimental values for various exciplexes (CRIPs) of TCA and several alkylbenzene donors dissolved in various solvents (open rectangles) and various SSRIPs of TCA and DCA with several alkylbenzene donors dissolved in acetonitrile (closed circles) and fit lines (dotted lines overlapping with solid lines) by Eq. ( 10.22 ) with two sets of parameter of Hif = 0.12 eV, λs = 0.55 eV (CRIPs) and Hif = 0.0013 eV, λs = 1.72 eV (SSRIPs). (b) Schematic diagram of the CRIP (exciplex) and SSRIP [41]. Reproduced with permission of American Chemical Society.
10.4.3 Charge Separation Versus Charge Recombination
An exciplex can be generated by the charge‐separation ET process from an LE complex. Figure 10.11 shows the comparison between the charge‐separation (from the LE state to the CT state) and the charge‐recombination rate constant (from the CT state to the ground state) as a function of the associated energy difference (−ΔE) [43]. The charge‐separation process to form the exciplex appears to be independent of the energy difference between the exciplex and the LE states as long as the –ΔE value is larger than approximately 0.3 eV, and hence a barrierless process. Considering that the charge‐separation rate constant (∼200 fs) matches the intermolecular vibration frequency (100–200 cm−1), it was suggested that the charge separation from the LE complex might be mediated via intermolecular stretching vibration. On the other hand, the rate constant of charge recombination, as discussed above regarding the CRIP, depends on the energy difference between the exciplex and the ground states. It was suggested that the charge-separation process would be the adiabatic barrierless reaction because the potential curves of the pure CT state and pure LE state cross each other.

Figure 10.11 The charge‐separation rate constant of six different exciplexes from CA, DCA, and TCA as acceptors and solutes and DMA and ANL as donors and solvents (closed circles) as a function of the energy gap between the locally excited complex state and the exciplex state; the charge‐recombination rate constant of various exciplexes of TCNE, tetracyanoquinoldimethane (TCNQ), PMDA, and phthalic anhydride (PA) with various polycyclic aromatic hydrocarbon as a function of the energy gap between the ground state and the exciplex state, which was reported by Asahi and Mataga (open circles) [43]. Reproduced with permission of AIP Publishing.
10.4.4 Intersystem Crossing (ISC) in the Exciplex
In the case of a free ion pair, the correlation between the unpaired electrons of individual ions is negligible, and their spins are arbitrarily oriented, due to a long distance between them. As they get closer as in SSRIP or CRIP, however, such spin correlation between the radical ions becomes sizable, and hence they should be either in the singlet or the triplet states. Without the SOC, spin wave functions for the states with different multiplicities, e.g. the singlet and triplet states, remain orthogonal, and thus the interconversions between them, i.e. intersystem crossings (ISCs), are inherently forbidden. In other words, a nonzero SOC is essential to make the ISCs possible.
The SOC is caused by the magnetic torque generated by the electron orbit motion, which could change the electron spin [44]. Within the zeroth‐order approximation and the central field approximation, the Hamiltonian for the SOC reads as
where ![]() and
and ![]() denote raising(+)/lowering(−) operators for the orbital and spin angular momenta of a given electron, respectively, and α is the SOC constant;
denote raising(+)/lowering(−) operators for the orbital and spin angular momenta of a given electron, respectively, and α is the SOC constant; ![]() where Z is the nucleus charge and r is the distance of an electron from a given nucleus. Therefore, the SOC become stronger when the electron orbits closer around the nucleus with a higher charge; in comparison to the phosphors with heavy metal elements, e.g. Ir or Pt, the SOC for the most organic molecules are 2–3 orders of magnitudes smaller [24, 45]. As Eq. (10.25) implies, when the spin of an electron is flipped over, the angular momentum of the electron should also change. Consequently, the SOC between the singlet and triplet states of the same nature, e.g. the SOC between the singlet and triplet CT states, should remain negligible, as the so‐called El‐Sayed rule states [46]. Therefore, the ISC is expected to be faster between the singlet exciplex state with a dominant CT character and the triplet LE complex than that between the highly CT singlet and triplet exciplex states.
where Z is the nucleus charge and r is the distance of an electron from a given nucleus. Therefore, the SOC become stronger when the electron orbits closer around the nucleus with a higher charge; in comparison to the phosphors with heavy metal elements, e.g. Ir or Pt, the SOC for the most organic molecules are 2–3 orders of magnitudes smaller [24, 45]. As Eq. (10.25) implies, when the spin of an electron is flipped over, the angular momentum of the electron should also change. Consequently, the SOC between the singlet and triplet states of the same nature, e.g. the SOC between the singlet and triplet CT states, should remain negligible, as the so‐called El‐Sayed rule states [46]. Therefore, the ISC is expected to be faster between the singlet exciplex state with a dominant CT character and the triplet LE complex than that between the highly CT singlet and triplet exciplex states.
The ISC rate constant can be calculated from the equation analogous to Eq. ( 10.22 ) where SOC Hamiltonian matrix elements are used instead of the electronic coupling V [47]. Figure 10.12 shows the experimentally measured ISC rate constant from the singlet exciplex to the triplet states for the CP, DCA, and TCA complexes with alkylbenzene; the ISC rate constants were fitted using Eq. ( 10.22 ) and in fair accord with the experimental data [47]. It is noteworthy that the ISC in the organic molecular complexes can take place on a timescale of c. 100 ns or faster, despite the relatively small SOC. As the energy difference between the singlet and triplet state, ΔEST, decreases, the ISC rate increases, suggesting that such ISCs take place in the inverted regime. Figure 10.12b reflects that the degree of CT (z) is higher for the singlet exciplex but remains negligible for the triplet complex, supporting that the ISC for such systems occurs between the highly CT singlet state and highly LE triplet state, for which the SOC is expected to be sizable.
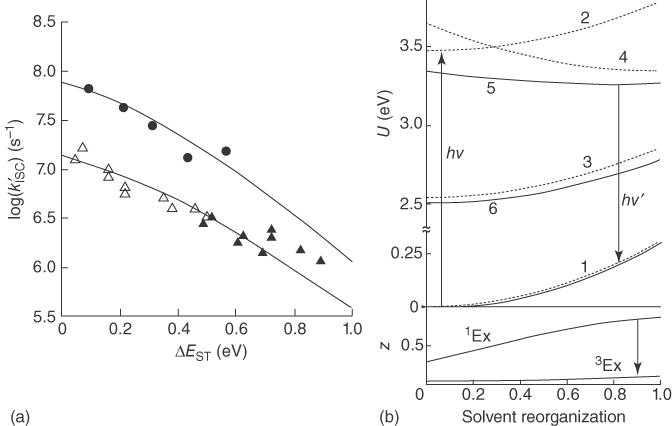
Figure 10.12 (a) Intersystem crossing rate, kISC, for CP (closed circle), DCA (close triangle), and TCA (open triangle) with alkylbenzene donors in various solvents as a function of ΔEST; the line is fitted using Eq. ( 10.22 ). (b) The energies of the ground state (1), the pure singlet LE state (2), the pure triplet LE state (3), the degenerated singlet and triplet CT state (4), the highly ionic singlet exciplex state (5), and the highly neutral triplet exciplex state (6) and the degree of charge transfer (z) of the singlet and triplet exciplex states as a function of solvent reorganization for exciplexes of CP with 1,3,5‐trimethoxybenzenes in PrCN [47]. Reproduced with permission of Springer Nature.
The ISC between the highly CT singlet and triplet exciplexes has been considered to take place via hyperfine interactions between the nucleus spin and the electron spin. A few studies investigated the contribution from the ISC between the singlet and triplet CT states by the electron spin resonance (ESR) technique, implying the considerable ISC between these states [10, 48]. Recently, however, such interactions are expected to be even far smaller than the SOC between the singlet CT and the triplet LE states in intramolecular CT thermally activated delayed fluorescence (TADF) molecules [49, 50]. The strong vibronic coupling between the triplet CT state and the triplet LE state can facilitate the ISC between the singlet and triplet CT exciplexes unless the triplet CT and the triplet LE states are significantly apart in energy [49]. It is not clear at this moment that the same mechanism can be applied to intermolecular CT exciplexes. Further study is required to clarify the mechanism of ISC or reverse ISC in exciplex.
10.5 Exciplexes in Organic Solid Films
Organic films in organic electronics typically have low static dielectric constants of 3–4 [51–54]. Therefore, the Coulomb attraction in the radical ion pair is sufficiently strong to make the exciplex states more stable than the SSRIP states, and the transition from the latter to the former is expected to be highly effective in organic films. In the case of OLEDs aiming for efficient light emission, the exciplex and the LE states are of high importance. In the case of OPVs, on the other hand, the transition from the exciplex state to the SSRIP, so‐called charge‐separated state, has long been of utmost interest because it is an essential process for the OPVs to be functional. Because our interests lie in the utilization of the exciplex in OLEDs in this chapter, we will limit our discussion within the processes regarding the exciplex and the LE states in the organic films hereafter.
It is useful at this stage to name two different systems as in Figure 10.13. If the energy of the triplet exciplex (3Exciplex) is higher than the triplet LE state (3LE) (right in Figure 10.13a), the transition from the 3Exciplex to the 3LE must be fast because it is the exothermic process. Therefore, the 3Exciplex will end up in the 3LE. On the other hand, if the 3Exciplex is more stable (left in Figure 10.13a), the transition from the 3Exciplex to the 3LE is an energetically uphill process, and the complex remains in 3CT. In the literature, the latter is called as a confined system but the former as a non‐confined one.
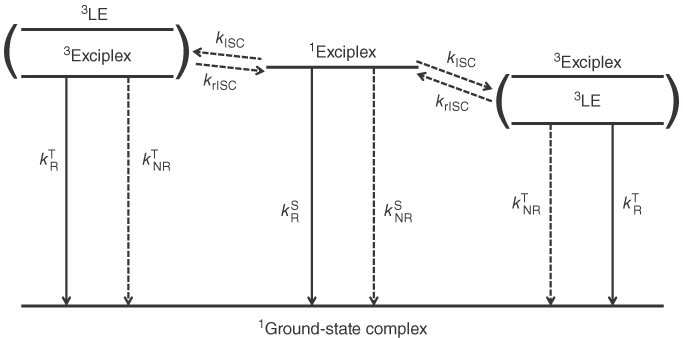
Figure 10.13 Schematic illustration of the energy diagram regarding the lowest excited states and various processes among them.
10.5.1 Prompt Versus Delayed Fluorescence
When the ISC between the singlet and triplet states is sufficiently facilitated, the fluorescence of organic molecular systems including the exciplex should compete with ISCs. Therefore, the molecules in the S1 state can fluoresce not only instantly (prompt fluorescence (PF)) but also after being back from the journey to the triplet state (delayed fluorescence (DF)). In the case of the electronic excitation in OLEDs, in particular, the light‐emitting molecules are more prone to delay their emissions due to the dominant triplet state population.
Relying on the simplest two‐model system (Figure 10.13), the rate equations for the concentrations of such a system in the S1 and T1 states are given in Eqs. (10.26) and (10.27):
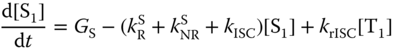
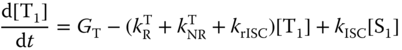
where [S1] and [T1] are the concentrations of the singlet and triplet states, respectively, and GS and GT are their respective generation rates. It is generally assumed that GT is zero for photoexcitation and GS:GT = 1 : 3 for electrical excitation. The photoluminescence quantum yield (PLQY) (ΦPL) of exciplexes can be obtained from the steady‐state solution with GT = 0 as follows when their phosphorescence is ignored:
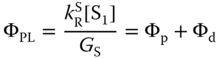
where Φp and Φd are the PLQY of the prompt and delayed components, respectively, defined by


with ![]() .
.
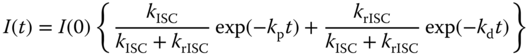
In the transient PL experiments, generation rates of singlet and triplet exciplexes from the excitation source could be considered as the delta function at t = 0, and the concentration of the singlet exciplex state can be obtained by solving Eqs. ( 10.26 ) and ( 10.27 ) and described by
where kp and kd and Cp and Cd are the decay rate constants and the intensities at t = 0 of the prompt and delayed emissions, respectively, which are expressed by
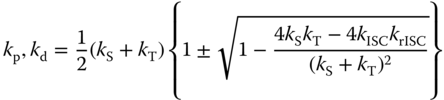
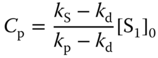
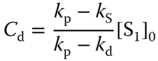
where [S1]0 is the concentration of the singlet exciplex state at t = 0, ![]() , and
, and ![]() . The diagram for transient PL profiles obeying two‐exponential model of Eq. (10.31) is depicted in Figure 10.14 [2, 55–57].
. The diagram for transient PL profiles obeying two‐exponential model of Eq. (10.31) is depicted in Figure 10.14 [2, 55–57].

Figure 10.14 Schematic diagram of the transient PL profiles with prompt and delayed components obeying Eq. ( 10.31 ).
To sum up, there are only four equations relating to the experimentally obtainable values (PLQY, kp, kd, and Cp/Cd) in spite of six unknowns ![]() . Therefore, we need an approximation to get the rate constants, which depends on materials of interest. Generally, phosphorescence is hardly observed from organic molecules without heavy atoms at room temperature, and thus
. Therefore, we need an approximation to get the rate constants, which depends on materials of interest. Generally, phosphorescence is hardly observed from organic molecules without heavy atoms at room temperature, and thus ![]() of exciplexes could be ignored when heavy atoms are absent in the exciplex system at room temperature.
of exciplexes could be ignored when heavy atoms are absent in the exciplex system at room temperature.
The ISC from the triplet to the singlet state plays an important role in improving the OLED efficiency:
where A is the pre‐exponential factor and ΔEST is the singlet–triplet energy splitting [2, 6, 22, 57, 58]. Therefore, when ΔEST is small, the rISC can occur effectively, and the exciplex emission is expected to show DF characteristics. Temperature‐dependent DF variation, i.e. so‐called thermally activated delayed fluorescence, for example, is observed in the 50 mol% m‐MTDATA:3TPYMB blend film, as shown in Figure 10.15. As expected, the measured krISC does increase as the ΔEST decrease. ΔEST of the exciplex was computed to be about 50 meV [2], comparable to the thermal energy at the room temperature (∼25 meV). Note that the LE states of the constituent molecules are higher in energy than the exciplex state (Figure 10.15c); the exchange energy, K, for the highly CT exciplex state and thus ΔEST between them are expectedly small. Assuming their complex is nonemissive in the triplet state, the increase of krISC could induce the increase of the population of the singlet exciplex state being an emissive state, resulting in higher PLQY of exciplexes as long as other transition rate constants remain the same.
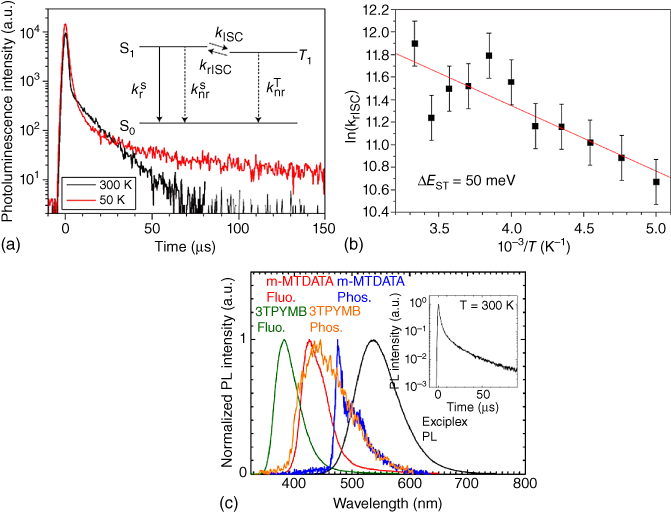
Figure 10.15 (a) Transient PL profiles of the m‐MTDATA:3TPYMB exciplex in the 50 mol% m‐MTDATA:PBD blend film. (b) krISC of the m‐MTDATA: 3TPYMB exciplex in the 50 mol% m‐MTDATA:PBD blend film at different temperature and a plot of Eq. (10.35). (c) Fluorescence (300 K) and phosphorescence (10 K) spectra of the constituent m‐MTDATA and 3TPYMB molecules with the PL spectra (300 K) of their blend film [2]. Reproduced with permission of Springer Nature.
One should note that the PLQY of DF does not solely depend on the ISC rate constant. As a typical example, Figure 10.16 shows PLQYs of PF, DF, and total fluorescence and the rate constants for various associated processes as a function of temperature for the TCTA:B4PYMPM exciplex. Their transient PL profiles are also shown in Figure 10.16a [6]. In the range of 150–300 K, the PLQYs of both total PL and DF counterintuitively increase as the temperature decreases. Detailed analyses, however, revealed that krISC did increase with temperature as expected. It was nonradiative decay processes (both for the singlet and triplet states) that become more effective and thus suppress the PLQY as the temperature increases [6]. ΔEST of this exciplex was estimated to be only 8.5 meV, smaller than the thermal energy even at 150 K (c. 13 meV).
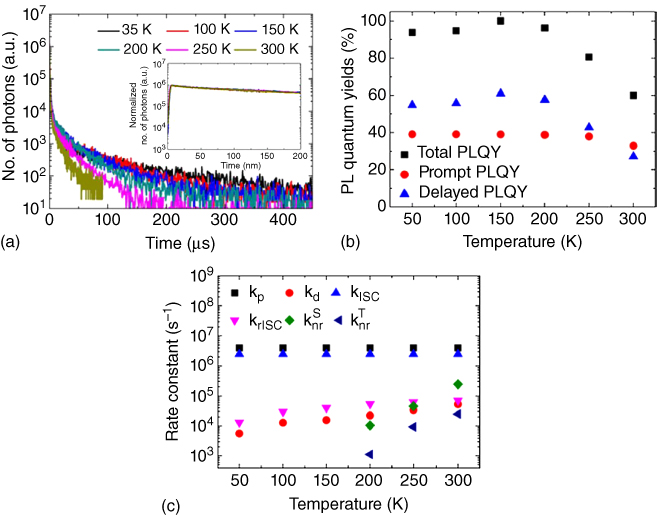
Figure 10.16 Transient PL profiles. (a), Total, prompt, and delayed PLQYs (b) and the prompt and delayed decay rate constants and four different radiationless transition rate constants (c) at various temperatures of the TCTA:B4PYMPM exciplex in the TCTA:B4PYMPM blend film [6]. Reproduced with permission of American Chemical Society.
If ![]() and 4kSkT − 4kISCkrISC ≪ (kS + kT)2, ΔEST can be obtained from the transient PL profiles [55], which can be simulated using Eq. (10.36) from Eq. ( 10.31
):
and 4kSkT − 4kISCkrISC ≪ (kS + kT)2, ΔEST can be obtained from the transient PL profiles [55], which can be simulated using Eq. (10.36) from Eq. ( 10.31
):
Then, kISC/krISC can be obtained from the ratio of the pre‐exponential factors of two different exponential functions in Eq. ( 10.36 ). Considering the degeneracy for the triplet states (factor of 3), ΔEST is given in Eq. (10.37), which is the relation between the free energy change and the equilibrium constant of the reaction: [55, 59]
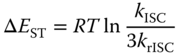
where R is the gas constant.
10.5.2 Spectral Shift as a Function of Time
The time‐resolved spectra of the exciplex emission generally redshift as time goes by. Figure 10.17 shows the time‐resolved spectra of the TCTA:B3PYMPM exciplex. The origin of the spectral shift is still under discussion. Adachi and coworkers suggested that the polarization of the medium be different when initially the S1 state forms; it depends on the way it is generated, either via direct charge recombination or via the rISC from the T1 state. Such medium polarization varies with time in the solid‐state film and thus redshift with time is observed in transient emission spectra [2]. On the other hand, it was proposed that the broad distribution of the energy level of the exciplex state caused by the different geometries of the constituent molecules in the exciplexes and the relaxations to the stable geometries of the constituent molecules induce the transient redshift of the emission spectra of the exciplexes. They also explained that the transient redshift of the emission spectra of exciplexes is smaller at lower temperatures due to the reduced movements to the stable geometry of the molecules at lower temperatures, as shown in Figure 10.17. The transient PL profiles of exciplexes showing the multiexponential decays in Figure 10.17a could be explained by the broad distribution of ΔEST of exciplexes caused by the different geometries of the constituent molecules in the exciplexes [3]. Also the same group recently reported that different exciplexes with different dimer geometries have different degrees of CT and resultantly different decay rates. An exciplex with larger degree of CT gives emission at lower energy and longer decay time than an exciplex with smaller degree of CT. The spectral redshift with delay time originates from the superposition of the fast‐decaying high‐energy exciplex and slow‐decaying low‐energy exciplex (C.‐K. Moon and J.‐J. Kim, unpublished).

Figure 10.17 Time‐resolved spectra and transient PL profiles of the TCTA:B3PYMPM exciplex in the TCTA:B3PYMPM blend film at 300 K and 35 K [3]. Reproduced with permission of AIP Publishing LLC.
Baldo and coworkers proposed that the energy distribution of the HOMO of the donor and LUMO of the acceptor in the blend films causes the transient redshift as time flows. By means of the time‐resolved spectrum measurement and the kinetic Monte Carlo simulation, they uncovered that the CT exciplex state migrates along the donor–acceptor grain boundary in the m‐MTDATA:3TPYMB blend film to find more stable interfacial CT site, fluctuating the distance of the geminate pair of the hole and electron and thus their binding energy/CT state energy; see Figure 10.18 [60]. Therefore, the energy of the CT state gets lower, and the PL spectra redshift along with time. Further study is required for the clarification of the spectral shift with delay time.
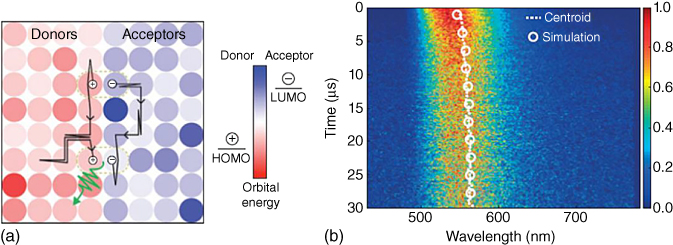
Figure 10.18 (a) Schematic diagram of exciplex diffusion by the geminate recombination of the exciplexes. (b) Streak camera measurement of the m‐MTDATA:3TPYMB blend film with the centroid (dot) of the time‐resolved PL spectra and the simulation (open circles) by the kinetic Monte Carlo simulation [60]. Reproduced with permission of Springer Nature.
10.6 OLEDs Using Exciplexes
10.6.1 Exciplexes as Emitters
Exciplex emissions at the interface between a charge transporting layer and an emitting layer in OLEDs were reported long time ago as an origin of low efficiency or as an active emission source for white OLEDs [61, 62]. The research activities on exciplex‐based OLEDs increased rapidly after the demonstration of the potential to convert the triplet excited state to the singlet excited state without using the heavy atom effect, resulting in the larger singlet portion than 25% in OLEDs using fluorescent materials. Maximum achievable internal quantum efficiency (IQEmax) under the assumption of no electrical loss in the devices can be calculated based on the spin statistics of OLEDs. From the steady‐state solution of Eqs. ( 10.26 ) and ( 10.27 ) with the GS: GT = 0.25 : 0.75, IQEmax is described by the following equation if the impacts of environments, e.g. Purcell factor, are not considered: [2, 6]

High ΦrISC is required to achieve high efficiency, which in turn requires the reduction of the ![]() and ΔEST but the enhancement of the SOC.
and ΔEST but the enhancement of the SOC.
Table 10.1 summarizes the device structures, maximum EQEs and PLQYs, EL peak wavelength, ΔEST, and whether the exciplex system is the triplet confined system or not for the exciplex‐based OLEDs with the EQE over 1%. The underlined layers in device structures are the light‐emitting layers. The EQEs have been increased rapidly from 5.4% to 17.8% during the last several years by properly developing new materials. Most of donors are amine‐ and carbazole‐based hole‐transporting materials such as TCTA, NPB, and m‐MTDATA. A variety of electron‐transporting materials such as Bphen, PO‐T2T, and TPBi have been used as acceptors.
Table 10.1 Characteristics of exciplex‐emitting OLEDs.
| No. | Device structure | Maximum EQE (%)/PLQY (%) | EL peak (nm) | Confined system/ΔEST (eV) | References (year) |
| 1 | ITO/NPB (50 nm)/PPSPP (50 nm)/PyPySPyPy (10 nm)/Mg:Ag (100 nm) | 3.4/62 | 495 | —/— | [63] (2003) |
| 2 | ITO (110 nm)/m‐MTDATA (20 nm)/m‐MTDATA:PBD (60 nm, m.r 5 : 5)/PBD (20 nm)/LiF (0.8 nm)/Al (50 nm) | 2/20 | — | O/0.050 | [2] (2012) |
| 3 | ITO (110 nm)/m‐MTDATA (20 nm)/m‐MTDATA:3TPYMB (60 nm, m.r 5 : 5)/3TPYMB (20 nm)/LiF (0.8 nm)/Al | 5.4/26 | 543 | O/— | [2] (2012) |
| 4 | ITO/m‐MTDATA (35 nm)/m‐MTDATA:PPT (30 nm, m.r 5 : 5)/PPT (35 nm)/LiF (0.8 nm)/Al | 10.0/28.5 | — | —/— | [1] (2012) |
| 5 | ITO/NPB (30 nm)/NPB:TPBi (35 nm, 5 : 5)/TPBi (35 nm)/LiF(1 nm)/Al(100 nm) | 2.7/28 | 450 | X/— | [64] (2013) |
| 6 | ITO/TAPC (30 nm)/TCTA (10 nm)/TCTA:B3PYMPM (30 nm, m.r 5 : 5)/B3PYMPM (30 nm)/LiF (1 nm)/Al (100 nm) | 3.1/36 | 506 | —/— | [3] (2013) |
| 7 | ITO/PEDOT:PSS (30 nm)/NPB (20 nm)/TCTA (5 nm)/3P‐T2T (75 nm)/Liq/Al | 7.7/— | 548 | O/— | [5] (2013) |
| 8 | ITO/PEDOT:PSS (30 nm)/NPB (20 nm)/TCTA (5 nm)/TCTA:3P‐T2T (25 nm, m.r 5 : 5)/3P‐T2T (50 nm)/Liq/Al | 7.8/— | 548 | O/— | [5] (2013) |
| 9 | ITO/m‐MTDATA (27 nm)/m‐MTDATA:BPhen (23 nm, m.r 3 : 7)/BPhen (20 nm)/Alq3 (13 nm)/LiF (1 nm)/Al (80 nm) | 7.79/15 | 563 | O/0.001 | [65] (2014) |
| 10 | ITO/NPB (30 nm)/TCTA (10 nm)/mCP:HAP‐3MF (20 nm, w.r 92 : 8)/DPEPO (10 nm)/TPBi (40 nm)/LiF (0.8 nm)/Al (100nm) | 11.3/66.1 | 540 | —/— | [66] (2014) |
| 11 | ITO/mCP (20 nm)/mCP:TPBi (20 nm, w.r 5 : 5)/TPBi (5 nm)/Bphen (30 nm)/LiF (1 nm)/Al (80 nm) | 1.48/— | 450 | X/— | [67] (2015) |
| 12 | ITO/mCP (20 nm)/mCP:BPhen (20 nm, w.r 5 : 5)/ BPhen (35 nm)/LiF (1 nm)/Al (80 nm) | 2.23/— | 462 | X/— | [67] (2015) |
| 13 | ITO/CuI (8 nm)/THCA (40 nm)/FIrpic (9 nm)/TCz1 (10 nm)/Ca (50 nm)/Al (200 nm) | 5/— | 572 | O/0.02 | [68] (2015) |
| 14 | ITO (95 nm)/HATCN (5 nm)/TAPC (20 nm)/m‐MTDATA:26DCzPPy (20 nm, m.r 5 : 5)/TmPyPB (50 nm)/LiF (1 nm)/Al (100 nm) | 5.03/20.3 | 525 | —/— | [69] (2015) |
| 15 | ITO/MoO3 (3 nm)/TCTA (15 nm)/TCTA:BPhen (12 nm, m.r 5 : 5)/BPhen (30 nm)/LiF/Al | 2.65/— | 461 | —/— | [70] (2015) |
| 16 | ITO/MoO3 (3 nm)/TAPC (15 nm)/TAPC:3P‐T2T (12 nm, m.r 5 : 5)/3P‐T2T (25 nm)/LiF/Al | 6.86/— | 572 | —/— | [70] (2015) |
| 17 | ITO/TPAPB (30 nm)/TPAPB:TPBi (30 nm, m.r 5 : 5)/TPBi (40 nm)/LiF (1 nm)/Al | 7.0/44.1 | 464 | X/— | [71] (2015) |
| 18 | ITO/MoO3 (3 nm)/mCBP (20 nm)/mCBP:PO‐T2T (20 nm, m.r 5 : 5)/PO‐T2T (40 nm)/LiF (0.8 nm)/Al | 7.66/34 | 475 | O/— | [72] (2015) |
| 19 | ITO/MoO3 (3 nm)/TPD (20 nm)/TPD:DMAC‐DPS (25 nm, w.r 5 : 5)/PO‐T2T (45 nm)/LiF (0.8 nm)/Al | 1.63/— | 586 | —/— | [73] (2015) |
| 20 | ITO/MoO3 (3 nm)/mCBP (20 nm)/DMAC‐DPS:B4PyMPM (25 nm, w.r 5 : 5)/B4PyMPM (40 nm)/LiF (0.8 nm)/Al | 4.40/— | 492 | —/— | [73] (2015) |
| 21 | ITO/MoO3 (3 nm)/mCBP (20 nm)/DMAC‐DPS:T2T (25 nm, w.r 5 : 5)/T2T (40 nm)/LiF (0.8 nm)/Al | 4.44/— | 489 | —/— | [73] (2015) |
| 22 | ITO/MoO3 (3 nm)/mCBP (20 nm)/DMAC‐DPS:PO‐T2T (25 nm, w.r 5 : 5)/PO‐T2T (40 nm)/LiF (0.8 nm)/Al | 9.08/— | 537 | —/— | [73] (2015) |
| 23 | ITO (120 nm)/PEDOT:PSS (60 nm)/TAPC (30 nm)/TAPC:DTrz (25 nm, 5 : 5)/TSPO1 (5 nm)/TPBi (30 nm)/LiF (1 nm)/Al (200 nm) | 3.27/— | 525 | —/0.05 | [74] (2015) |
| 24 | ITO (120 nm)/PEDOT:PSS (60 nm)/TAPC (30 nm)/TCTA:DTrz (25 nm, 5 : 5)/TSPO1 (5 nm)/TPBi (30 nm)/LiF (1 nm)/Al (200 nm) | 5.52/— | 512 | —/0 | [74] (2015) |
| 25 | ITO (120 nm)/PEDOT:PSS (60 nm)/TAPC (30 nm)/TAPC:CzTrz (25 nm, 5 : 5)/TSPO1 (5 nm)/TPBi (30 nm)/LiF (1 nm)/Al (200 nm) | 8.88/— | 512 | —/0.04 | [74] (2015) |
| 26 | ITO (120 nm)/PEDOT:PSS (60 nm)/TAPC (30 nm)/TCTA:CzTrz (25 nm, 5 : 5)/TSPO1 (5 nm)/TPBi (30 nm)/LiF (1 nm)/Al (200 nm) | 12.62/— | 505 | —/0 | [74] (2015) |
| 27 | ITO/TAPC (30 nm)/CDBP (10 nm)/CDBP:PO‐T2T (30 nm, w.r 5 : 5)/PO‐T2T (40 nm)/LiF (1 nm)/Al (100 nm) | 13.0/51 | 480 | O/0.03 | [75] (2015) |
| 28 | ITO/HATCN (5 nm)/TAPC (55 nm)/TCTA:Tm3PyBPZ (30 nm, 5 : 5)/Tm3PyBPZ (40 nm)/Liq (2 nm)/Al (100 nm) | 13.1/— | 528 | O/— | [76] (2015) |
| 29 | ITO/TAPC (35 nm)/NPB (5 nm)/NPB:DPTPCz (30 nm, w.r 5 : 5)/TmPyPB (40 nm)/LiF (1 nm)/Al (100 nm) | 0.6/15 | 502 | X/— | [75] (2015) |
| 30 | ITO/TAPC (35 nm)/TCTA (5 nm)/TCTA:DPTPCz (30 nm, w.r 5 : 5)/TmPyPB (40 nm)/LiF (1 nm)/Al (100 nm) | 11.9/55 | 510 | O/0.062 | [75] (2015) |
| 31 | ITO/TAPC (40 nm)/TAPC:DPTPCz (30 nm, w.r 5 : 5)/TmPyPB (40 nm)/LiF (1 nm)/Al (100 nm) | 15.4/68 | 520 | O/0.047 | [75] (2015) |
| 32 | ITO (70 nm)/TAPC (75 nm)/TCTA (10 nm)/TCTA:B4PYMPM (30 nm, m.r 5 : 5)/B4PYMPM (40 nm)/LiF (0.7 nm)/Al (100 nm). | 11.0/60 | 530 | —/0.009 | [6] (2016) |
| 33 | ITO/4% ReO3:TCTA (60 nm)/TCTA (15 nm)/TCTA:CNT2T (25 nm, m.r 5 : 5)/CN‐T2T (50 nm)/Liq (0.5 nm)/Al (100 nm) | 9.7/50.0 | 540 | O/— | [55] (2016) |
| 34 | ITO/4% ReO3:Tris‐PCz (60 nm)/Tris‐PCz (15 nm)/Tris‐PCz:CN‐T2T (25 nm, m.r 5 : 5)/CN‐T2T (50 nm)/Liq (0.5 nm)/Al (100 nm) | 11.9/52.9 | 525 | O/0.026 | [55] (2016) |
| 35 | ITO/TCTA (85 nm)/TmPyTZ (85 nm)/LiF (1 nm)/Al (150 nm) | 10.1/— | 540 | O/0.030 | [77] (2016) |
| 36 | ITO/TAPC (85 nm)/TmPyTZ (85 nm)/LiF (1 nm)/Al (150 nm) | 12.0/— | 552 | O/0.053 | [77] (2016) |
| 37 | ITO/TAPC (40 nm)/mCP (10 nm)/ mCP:PO‐T2T (20 nm, w.r 5 : 5)/PO‐T2T (45 nm)/LiF (1 nm)/Al (150 nm) | 8.6/— | 476 | O/0.010 | [78] (2016) |
| 38 | ITO/TAPC (40 nm)/mCP (10 nm)/ MAC:PO‐T2T (20 nm, w.r 5 : 5)/PO‐T2T (45 nm)/LiF (1 nm)/Al (150 nm) | 17.8/— | 516 | O/0.014 | [78] (2016) |
Confined exciplex systems appear to be useful to improve the device performance utilizing small ΔEST as exemplified in Devices 29–31 [79]. NPB:DPTPCz singlet exciplexes of Device 29 are higher in energy than the T1 state of NPB (triplet non‐confined system). The small EQE/PLQY of this device might be attributed to the less effective ΦrISC. In contrast, TCTA:DPTPCz exciplexes of Device 30 and TAPC:DPTPCz exciplexes of Device 31 show large EQE/PLQY because of the triplet confined characteristics of them [79].
Observation of delayed emission in a mixed film does not necessarily mean that it is from TADF. Triplet–triplet annihilation (TTA) is another way to get singlet exciplexes from the triplet ones. The major difference between the TADF through the rISC and the TTA is molecularity of the reaction; the former is an unimolecular reaction, while the latter a bimolecular one [3, 22, 64]. Therefore, the intensity of the delayed emission arising from the TADF is linearly proportional to [T1], while that stemming from the TTA is linearly proportional to [T1]2. Therefore, the mechanism responsible for the delayed emission can be identified by investigating either the incident light intensity dependence or the current density dependence of the delayed emission. Figure 10.19a, b displays the delayed PL intensity of m‐MTDATA:PBD exciplex and that of NPB:TPBi exciplex employed in Device 5 as a function of the pulse fluence, respectively [22, 64]. [T1] is linearly proportional to the pulse fluence for the m-MTDATA:PBD exciplex. Thus, it could be concluded that the delayed emission of m‐MTDATA:PBD exciplexes arises from the TADF and that of NPB:TPBi exciplexes arises from the TTA inferred from its slope. The transition of the slope from 2 to 1 in Figure 10.19b may be because of the active quenching of the excitons caused by high concentration of excitons [80]. Device 17 with triplet non‐confined exciplexes also shows higher EQE than the expected maximum EQE from PLQY of TPAPB:TPBi exciplexes, assuming they are the conventional fluorescent emitters, and TTA would be the dominant way for the delayed emission of TPAPB:TPBi exciplexes [71].
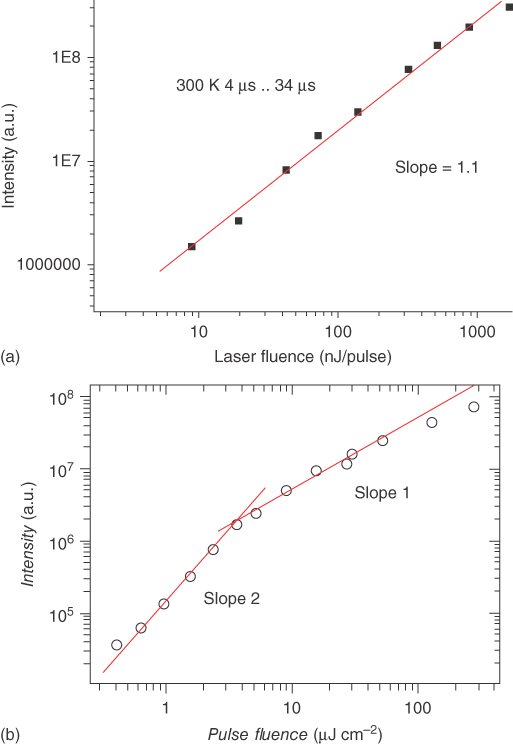
Figure 10.19 Delayed PL intensity of m‐MTDATA:PBD exciplexes (a) and NPB:TPBi exciplexes [22] (b) as a function of the pulse fluence [64]. Reproduced with permission of John Wiley & Sons.
10.6.2 Exciplexes as Sensitizers
Exciplex OLEDs are interesting because of their capability to harvest triplet excited states leading to higher efficiency than the singlet limit. However, the PLQY of exciplexes is rather small up to now, below 70%, reflecting a rather small oscillator strength probably because of the small overlap between spatially separated HOMO (donor) and LUMO (acceptor). More importantly, the emission spectrum of exciplex is rather broader, limiting the exciplex application to the OLEDs in terms of color purity. Employing both exciplexes as the host and sensitizer and conventional fluorescent dopant with narrow emission spectra could enhance the device performance via the ENT from the singlet exciplex to the dopant. Assuming that the direct exciton formation and the ISC/rISC in dopants are negligible, the efficiency of generating the S1‐state dopant in this device, ![]() can be written as Eq. (10.39):
can be written as Eq. (10.39):

where ![]() are the ENT efficiency from the singlet exciplex to the dopant and the ISC and rISC efficiencies of exciplex under the consideration of the ENT, respectively, and represented by
are the ENT efficiency from the singlet exciplex to the dopant and the ISC and rISC efficiencies of exciplex under the consideration of the ENT, respectively, and represented by


where ![]() and
and ![]() are the rate constants for the singlet and triplet ENT from the host to the dopant, respectively. Then, the EQE of OLEDs with exciplex sensitizers can be written as Eq. (10.43) if the Purcell factor is ignored:
are the rate constants for the singlet and triplet ENT from the host to the dopant, respectively. Then, the EQE of OLEDs with exciplex sensitizers can be written as Eq. (10.43) if the Purcell factor is ignored:
where γ is the recombination efficiency of electrons and holes in OLEDs, PLQY(D) is the PLQY of the dopant, and ηout is the light‐out coupling efficiency, which is generally considered to be 20–30% when the emitting transition dipole moment vectors are randomly distributed [64, 65].
Note here that the concentration ratio between the exciplex sensitizer and dopant must be carefully controlled to maximize the efficiency. If the concentration of exciplex sensitizer is too low, the conversion of triplet exciplexes to the singlet ones is not effective. Therefore, the exciplex sensitizing effect is hardly expected, undermining the device efficiency. In too high exciplex concentration, on the other hand, the average distance between the sensitizer and the dopant will increase, and the concentration of the ground‐state dopant remains low. Therefore, the ENT from the sensitizer to the dopant would not be effective. In addition, at both extremes, the concentration quenching and triplet‐polaron quenching of dopants or exciplexes are still expected to be active.
Regarding the ENT, both Förster and Dexter mechanisms are in action; the former stems from the transition dipole–transition dipole interactions between the energy donor and acceptor, hence proportional to r−6 where r is the distance between the exciplex and dopant molecule. To facilitate Förster ENT, the spectral overlap of the dopant absorption and the sensitizer emission should also be substantial. On the other hand, Dexter ENT occurs via the quantum electronic coupling, and thus the wave function overlap between molecules should be significant. As such, Dexter ENT decays exponentially as a function of distance. Given that the transition dipole between the singlet and triplet states is negligible for organic molecules, Dexter mechanism dominates the triplet ENT, whereas Förster ENT is more important for the singlet one. Therefore, the conditions for decreasing the Dexter ENT rate must be considered when an exciplex host and a dopant are selected, which warrants further studies.
Table 10.2 collects information on the exciplex‐sensitized OLEDs: device structures, maximum EQEs, EL peak wavelengths, and PLQYs of the device, and singlet–triplet energy splitting and triplet confinement of the exciplex. The light‐emitting layer in device structures is underlined. When both emissions from exciplexes and fluorescent dopants are observed, two EL maximum peaks are provided. Devices 5–8 performed better than the conventional fluorescent OLEDs, demonstrating the sensitizing effect of exciplex‐forming hosts. As discussed before, the concentration of dopants does influence the properties of OLEDs. OLEDs using small concentration of dopants show the exciplex emission as seen in Devices 2–4, 9, and 10, indicating less effective ENT from the exciplex to dopants. At high concentration of dopants, on the other hand, devices do not show the exciplex emission, but EQE could decrease as seen in Devices 7 and 8 [4, 55, 72]. The concentration quenching of dopants might also play a role in the reduction in PLQY [82, 83]. Thus far, the highest efficiency of the conventional fluorescent dye‐doped OLEDs is reportedly about 15%, and there must be a room for further enhancement by developing proper exciplex hosts and dopants molecules, tuning the concentration ratio, and so on.
Table 10.2 Characteristics of OLEDs employing exciplexes as the host and conventional fluorescent emitters as the dopant.
| No. | Device structure | Maximum EQE (%)/PLQY (%) | EL peak (nm) | Confined system/ΔEST (eV) | References (year) |
| 1 | ITO/MoO3 (3 nm)/mCBP (20 nm)/mCBP:PO‐T2T (20 nm)/mCBP:POT2T:1.0 wt.% Rubrene (5 nm)/PO‐T2T (40 nm)/LiF (0.8 nm)/Al | 6.09/— | 560 | O/— | [72] (2015) |
| 2 | ITO/MoO3 (3 nm)/mCBP (20 nm)/mCBP:PO‐T2T:0.4 wt.% Rubrene (20 nm)/PO‐T2T (40 nm)/LiF (0.8 nm)/Al | 7.05/— | 475, 550 | O/— | [72] (2015) |
| 3 | ITO/MoO3 (3 nm)/mCBP (20 nm)/mCBP:PO‐T2T:0.2 wt.% DCJTB (20 nm)/PO‐T2T (40 nm)/LiF (0.8 nm)/Al | 5.75/— | 475, 582 | O/— | [72] (2015) |
| 4 | ITO/MoO3 (3 nm)/mCBP (20 nm)/mCBP:PO‐T2T:0.4 wt.% DCJTB (20 nm)/PO‐T2T (40 nm)/LiF (0.8 nm)/Al | 6.16/— | 480, 600 | O/— | [72] (2015) |
| 5 | ITO/MoO3 (3 nm)/NPB (20 nm)/TCTA (8 nm)/TCTA:3P‐T2T:1 wt.% DCJTB (15 nm)/3P‐T2T (45 nm)/LiF (1 nm)/Al | 10.15/68.5 | 544, 605 | —/— | [81] (2015) |
| 6 | ITO (100 nm)/TAPC (75 nm)/TCTA (10 nm)/TCTA:B4PYMPM:0.5 wt.% DCJTB (30 nm)/B4PYMPM (50 nm)/LiF (0.7 nm)/Al (100 nm) | 10.6/73 | 600 | —/— | [82] (2015) |
| 7 | ITO/TAPC (40 nm)/ TAPC:DPTPCz:1 wt.% C545T (30 nm)/TmPyPB (50 nm)/LiF (1 nm)/Al (100 nm) | 7.5/64 | 496 | —/— | [4] (2015) |
| 8 | ITO/TAPC (40 nm)/TAPC:DPTPCz:0.2 wt% C545T (30 nm)/TmPyPB (50 nm)/LiF (1 nm)/Al (100 nm) | 14.5/68 | 496 | —/— | [4] (2015) |
| 9 | ITO/4% ReO3:Tris‐PCz (60 nm)/Tris‐PCz (15 nm)/Tris‐PCz:CN‐T2T:1 wt.% Rubrene (25 nm)/CN‐T2T (50 nm)/Liq (0.5 nm)/Al (100 nm) | 6.9/— | 510, 566 | O/0.026 | [55] (2016) |
| 10 | ITO/4% ReO3:Tris‐PCz (60 nm)/Tris‐PCz (15 nm)/Tris‐PCz:CN‐T2T:1 wt.% DCJTB (25 nm)/CN‐T2T (50 nm)/Liq (0.5 nm)/Al (100 nm) | 9.7/— | 510, 610 | O/0.026 | [55] (2016) |
10.7 Summary and Outlook
In this chapter, we covered the fundamentals of exciplexes from their electronic structures and optical properties to various transition processes associated with them. Due to its dominant CT character, the exciplexes are not such effective in light emission. Nevertheless, inherently small ΔEST in confined systems, they have potentials to effectively convert the triplet excited states to the singlet ones. This paves the road toward OLEDs with the IQE of unity using organic molecules and their significant fabrication cost reduction. As we discussed, the application of exciplexes will remain as one of the important topics for OLED applications.
Apart from their utilization as emitters or sensitizers in OLEDs, interfaces between different molecules are ubiquitous in organic electronics. In addition, it is noteworthy that the electronic structures and properties of exciplexes are also influenced by their configurations as mentioned earlier, and thus their configuration control is considered to have fundamental importance; the intermolecular interactions in the exciplex state, however, are markedly different than that in the ground state and are relatively weak, leading to various configurations. As such, further studies of exciplexes are highly warranted.
Appendix
10.A.1 Small Molecular Pairs of Donors and Acceptors Forming Exciplexes
The exciplex consists of a pair of an electron donor molecule and an electron acceptor molecule. Here, electron donor molecules generally contain electron‐donating moieties such as carbazoles, triarylamines, and 9,10‐dihydroacridines [84–88]. Electron acceptor molecules typically have electron‐withdrawing moieties such as 1,3,5‐triazines, quinoxalines, pyrazines, pyrimidines, quinolines, phenanthrolines, pyridines, 1,3,4‐oxadiazoles, benzimidazoles, benzotriazoles, triarylboranes, siloles, phosphine oxides, sulfones, cyano groups, fluoro groups, and carbonyl groups [84, 86, 87, 89–96]. The HOMO/LUMO energy levels of electron donor molecules and electron acceptor molecules and exciplex emission peak energies are summarized in Table 10.A.1.
Table 10.A.1 Energy levels of HOMO and LUMO of molecules forming exciplexes and PL‐spectra peaks of exciplexes in the blended films.
| Donor | HOMO/LUMO (eV) | Acceptor | HOMO/LUMO (eV) | Exciplex emission peak (eV) | References | Donor | HOMO/LUMO (eV) | Acceptor | HOMO/LUMO (eV) | Exciplex emission peak (eV) | References |
| CBP | −6.1/— | B3PYMPM | −6.77/−3.2 | 2.92 | [97] | NPB | −5.5/−2.4 | PPSPP | −5.9/−3.1 | 2.50 | [15] |
| CBP | −6.1/−2.5 | B4PYMPM | −7.1/−3.5 | 2.82 | [98] | NPB | −5.5/−2.4 | PyPySPyPy | −5.9/−3.2 | 2.25 | [15] |
| CBP | −5.9/−2.5 | B4PyPPM | −7.2/−3.4 | 2.78 | [99] | NPB | −5.5/−2.4 | TPBi | −6.4/−2.7 | 2.73 | [64] |
| CBP | −5.5/−2.0 | CPP | −6.2/−3.3 | 2.40 | [100] | TPD | −5.4/−2.3 | BCP | −6.4/−2.8 | 2.78 | [101] |
| CBP | −5.7/−2.2 | CPQ | −6.2/−3.3 | 2.26 | [93] | TPD | −5.4/−2.4 | BPhen | −6.4/−2.8 | 2.64 | [102] |
| CDBP | −5.86/−2.41 | PO‐T2T | −7.10/−3.30 | 2.61 | [75] | TPD | —/— | Gd(DBM)3bath | —/— | 2.12 | [103] |
| mCBP | −6.1/−2.4 | PO‐T2T | −6.8/−2.8 | 2.70 | [72] | TPD | −5.4/−2.4 | STO | −7.7/−3.0 | 2.23 | [104] |
| mCP | −6.1/−2.4 | 3P‐T2T | −6.5/−3.0 | 2.83 | [67] | TPD | −5.4/−2.3 | Tb(PMIP)3(Phen) | −5.9/−2.7 | 2.30 | [105] |
| mCP | −6.1/−2.4 | B3PYMPM | −6.77/−3.2 | 2.97 | [106] | TPD | —/— | TBOB | —/— | 2.41 | [107] |
| mCP | −6.1/−2.4 | BPhen | −6.4/−2.5 | 3.06 | [67] | FL2 | −5.4/−2.4 | Alq3 | −5.9/−3.2 | 2.38 | [108] |
| mCP | −5.9/−2.4 | HAP‐3MF | −6.0/−3.4 | 2.23 | [66] | FL3 | −5.3/−2.3 | Alq3 | −5.9/−3.2 | 2.36 | [108] |
| mCP | −6.1/−2.4 | POPH | −6.7/−2.5 | 3.22 | [109] | m‐MTDATA | −5.1/−2.0 | 3TPYMB | −6.8/−3.3 | 2.34 | [110] |
| mCP | −6.1/−2.4 | PO‐T2T | −7.5/−3.5 | 2.64 | [111] | m‐MTDATA | −5.1/−2.1 | Alq3 | −5.9/−3.2 | 2.16 | [108] |
| mCP | −6.1/−2.4 | TPBi | −6.4/−2.7 | 3.16 | [67] | m‐MTDATA | —/— | BCP | —/— | 2.34 | [112] |
| THCA | −4.63/−1.98 | Alq3 | −5.7/−3.1 | 2.21 | [113] | m‐MTDATA | −5.1/−1.9 | BPhen | −6.0/−2.5 | 2.36 | [114] |
| THCA | −4.63/−1.98 | BPhen | −6.4/−3.0 | 2.25 | [115] | m‐MTDATA | −5.1/−2.0 | PBD | −6.1/−2.4 | 2.25 | [22] |
| THCA | −4.63/−1.98 | FIrpic | −5.8/−2.9 | 2.21 | [68] | m‐MTDATA | −5.1/−2.0 | PPT | −6.7/−3.0 | 2.38 | [1] |
| TCTA | −5.8/−2.5 | 3P‐T2T | −6.4/−3.0 | 2.31 | [81] | m‐MTDATA | −5.1/−2.0 | PtL2Cl | −5.6/−3.1 | 2.07 | [61] |
| TCTA | −5.83/−2.43 | B3PYMPM | −6.77/−3.2 | 2.55 | [3] | m‐MTDATA | −5.1/−2.0 | T2T | −6.5/−2.8 | 2.14 | [116] |
| TCTA | −5.83/−2.43 | B4PYMPM | −7.30/−3.71 | 2.44 | [6] | m‐MTDATA | −5.10/−1.92 | TmPyPb | −6.63/−2.54 | 2.59 | [117] |
| TCTA | −5.7/−2.3 | BPhen | −6.1/−2.8 | 2.68 | [118] | m‐MTDATA | −5.1/−1.9 | TPBi | −6.2/−2.7 | 2.36 | [119] |
| TCTA | −5.70/— | DTrz | −7.01/−3.34 | 2.41 | [74] | MTDATA | −5.0/−1.9 | B1PPQ | −5.7/−2.7 | 2.11 | [26] |
| TCTA | −5.8/−2.4 | POPH | −6.7/−2.5 | 2.77 | [109] | TDDP | −4.7/−1.6 | BCP | −6.2/−2.6 | 2.46 | [120] |
| TCTA | −5.7/−2.5 | TBOB | −6.6/−2.9 | 2.48 | [121] | TPB | −5.2/−2.0 | Alq3 | −5.9/−3.2 | 2.30 | [108] |
| TCTA | −5.8/−2.4 | Tm3PyBPZ | −6.6/−3.1 | 2.41 | [76] | SiDMAC | −5.60/−1.97 | BPSPF | −6.60/−2.69 | 2.84 | [122] |
| TCTA | −5.83/−2.5 | TmPyTZ | −6.63/−3.09 | 2.34 | [77] | MAC | −5.64/−2.97 | PO‐T2T | −7.04/−3.22 | 2.42 | [78] |
| TCTA | −5.7/−2.4 | TPBi | −6.1/−2.8 | 2.85 | [123] | TPAPB | −5.36/−2.35 | TPBi | −6.20/−2.70 | 2.65 | [71] |
| TCTA | −5.8/−2.4 | TPO | −7.1/−2.75 | 2.77 | [124] | DMAC‐DPS | −5.9/−2.9 | B4PyMPM | −7.3/−3.7 | 2.52 | [73] |
| TCTA | −5.8/−2.4 | TPOB | −6.7/−3.0 | 2.67 | [125] | DMAC‐DPS | −5.9/−2.9 | PO‐T2T | −7.5/−3.5 | 2.31 | [73] |
| Cz3d | −5.64/−2.68 | Oxa3d | −5.91/−2.78 | 2.62 | [126] | DMAC‐DPS | −5.9/−2.9 | T2T | −6.5/−3.0 | 2.62 | [73] |
| Tris‐PCz | −5.6/−2.1 | CN‐T2T | −6.7/−2.78 | 2.34 | [55] | TPD | −5.5/−2.4 | DMAC‐DPS | −5.9/−2.9 | 2.25 | [73] |
| TAPC | −5.5/— | 3P‐T2T | — / – | 2.28 | [70] | m‐MTDATA | −5.1/−1.9 | 26DCzPPy | −6.05/−2.56 | 2.41 | [69] |
| TAPC | −5.3/−1.8 | B1PPQ | −5.7/−2.7 | 2.50 | [26] | TAPC | −5.3/−1.8 | 26DCzPPy | −6.05/−2.56 | 2.77 | [69] |
| TAPC | −5.6/−2.0 | BTPS | −6.7/−2.9 | 2.62 | [127] | TAPC | −5.50/ — | CzTrz | −6.08/−3.28 | 2.41 | [74] |
| TAPC | −5.50/— | DTrz | −7.01/−3.34 | 2.36 | [74] | TCTA | −5.70/ — | CzTrz | −6.08/−3.28 | 2.43 | [74] |
| TAPC | −5.6/−2.0 | POPH | −6.7/−2.5 | 2.70 | [109] | NPB | −5.50/−2.30 | CzPhB | −5.92/−2.91 | 2.67 | [20] |
| TAPC | −5.39/−1.8 | TmPyTZ | −6.63/−3.09 | 2.24 | [77] | m‐MTDATA | −4.97/−1.88 | 2d | −6.18/−3.19 | 2.13 | [128] |
| TAPC | −5.5/−2.1 | TPBi | −6.1/−2.8 | 2.71 | [129] | NPB | −5.43/−2.40 | 2d | −6.18/−3.19 | 2.38 | [128] |
| 2‐TNATA | −5.1/— | Alq3 | — / – | 2.15 | [130] | TAPC | −5.47/−2.00 | 2d | −6.18/−3.19 | 2.38 | [128] |
| 2‐TNATA | −5.15/−2.13 | Spiro‐DPVBi | −5.50/−2.50 | 2.36 | [131] | TPD | −5.6/−2.5 | CzOxa | −6.22/−3.13 | 2.62 | [132] |
| TTA | −5.3/−1.8 | B1PPQ | −5.7/−2.7 | 2.50 | [26] | NPB | −5.40/−2.81 | DPTPCz | −6.03/−3.08 | 2.53 | [79] |
| NPB | −5.5/−2.5 | Alq3 | −5.9/−3.2 | 2.38 | [108] | TAPC | −5.43/−2.67 | DPTPCz | −6.03/−3.08 | 2.47 | [79] |
| NPB | −5.4/−2.4 | B4PyPPM | −7.15/−3.44 | 2.25 | [133] | TCTA | −5.51/−2.71 | DPTPCz | −6.03/−3.08 | 2.47 | [79] |
| NPB | −5.2/−2.2 | CPP | −6.2/−3.3 | 1.94 | [100] | THCA | −4.63/−1.98 | IC2 | −5.56/−2.73 | 1.97 | [132] |
| NPB | −5.2/— | CPQ | −6.2/−3.3 | 1.98 | [93] | TPD | −5.40/−2.20 | ANHC | −5.60/−2.63 | 2.39 | [21] |
| NPB | −5.2/−2.1 | F2Py | −6.19/−2.92 | 2.27 | [134] | TPD | −5.40/−2.20 | CNHC | −5.65/−2.70 | 2.37 | [21] |
| NPB | −5.4/−2.4 | PBD | −6.1/−2.7 | 2.57 | [135] |
10.A.2 Small Molecules with Electron‐donating Moieties Forming Exciplexes
Figure 10.A.1 shows the molecular structures of electron donors employed in OLEDs utilizing small molecule‐based exciplexes. Figure 10.A.1a depicts the molecular structures of electron donors containing carbazoles, which are 4,4′‐N,N′‐dicarbazole‐biphenyl (CBP) [93, 97–100], 4,4′‐bis(9‐carbazolyl)‐2,2′‐dimethylbiphenyl (CDBP) [75], 9,9′‐biphenyl‐3,3′‐diylbis‐9H‐carbazole (mCBP) [72], N,N′‐dicarbazolyl‐3,5‐benzene (mCP) [66, 67, 78, 106, 109, 111, 129, 136, 137], tri(9‐hexylcarbazol‐3‐yl)amine (THCA) [68, 113, 115], TCTA [3, 5, 6, 70, 74, 76, 77, 81, 82, 109, 118, 121, 123–125, 129, 138, 139], 3,6‐bis(2‐{4‐[3,6‐bis(4‐tert‐butylphenyl)carbazole‐9‐yl]phenyl}‐vinyl)‐9‐p‐tolyl‐9H‐carbazole (Cz3d) [126], and 9,9′,9″‐triphenyl‐9H,9′H,9″H‐3,3′:6′,3″‐tercarbazole (Tris‐PCz) [55].
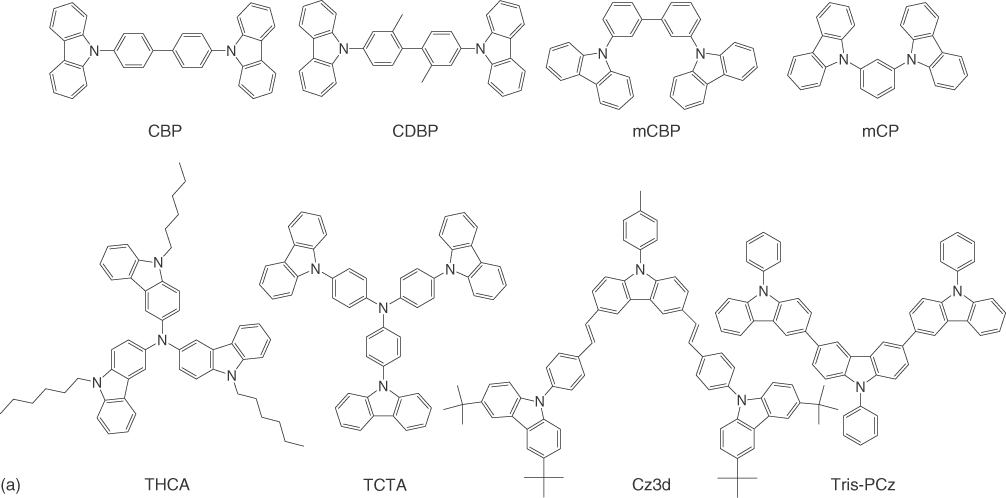
Figure 10.A.1 Electron donors containing carbazoles (a) and triphenylamines (b).
Figure 10.A.1b shows the molecular structures of the electron donors including triphenylamines. TAPC [26, 70, 74, 77, 109, 127, 129], 4,4′,4′′‐tris[2‐naphthyl(phenyl)amino]triphenylamine (2‐TNATA) [130], tris(p‐tolyl)amine (TTA) [26], N,N′‐diphenyl‐N,N′‐bis(1‐naphthylphenyl)‐1,1′‐biphenyl‐4,4′‐diamine (NPB) [15, 63, 64, 93, 100, 108, 133–135], N,N′‐diphenyl‐N,N′‐bis‐(3‐methylphenyl)‐1,1′‐biphenyl‐4,4′‐diamine) (TPD) [101–105, 107, 140–142], 2,7‐bis(diphenylamino)‐9,9‐bis(1,1′‐biphenyl‐4‐yl)‐9H‐fluorene (FL2) [108], 2,7‐bis[di(4‐methylphenyl)amino]‐9,9‐bis(1,1′‐biphenyl‐4‐yl)‐9H‐fluorene (FL3) [108], m‐MTDATA [1, 2, 22, 61, 65, 108, 110, 112, 114, 116, 117, 119, 143–147], 4,4′,4′′‐tris(3‐methylphenylamino)triphenylamine (MTDATA) [26], 1,4‐bis(di‐4‐tert‐butylphenylamino)benzene (TDDP) [120], 1,4‐bis[4‐methylphenyl(phenyl)amino]benzene (TPB) [108], and bis[4‐(9,9‐dimethyl‐9,10‐dihydroacridine)phenyl]diphenylsilane (SiDMAC) [122] are used for OLEDs employing small molecular exciplexes.
10.A.3 Small Molecules with Electron‐accepting Moieties Forming Exciplexes
Figure 10.A.2 shows the molecular structures of electron acceptors employed in OLEDs utilizing small molecule‐based exciplexes. Electron acceptors containing 1,3,5‐triazines for small molecular OLEDs using exciplexes are 3P‐T2T [5, 67, 70, 81], 3′,3′′′,3′′′′′‐(1,3,5‐triazine‐2,4,6‐triyl)tris(([1,1′‐biphenyl]‐3‐carbonitrile)) (CN‐T2T) [55], 3,3′‐bis(4,6‐diphenyl‐1,3,5‐triazin‐2‐yl)‐1,1′‐biphenyl (DTrz) [74], 2,4,6‐tris(3‐(pyridin‐3‐yl)phenyl)‐1,3,5‐triazine (TmPyTZ) [77], 2,4,6‐tris(biphenyl‐3‐yl)‐1,3,5‐triazine (T2T) [116], (1,3,5‐triazine‐2,4,6‐triyl)tris(benzene‐3,1‐diyl))tris(diphenylphosphine oxide) (PO‐T2T) [72, 75, 78, 111], 2,4,6‐tris(3′‐(pyridin‐3‐yl)biphenyl‐3‐yl)‐1,3,5‐triazine (Tm3PyBPZ) [76], and 2,5,8‐tris(4‐fluoro‐3‐methylphenyl)‐1,3,4,6,7,9,9b‐heptaazaphenalene (HAP‐3MF) [66] shown in Figure 10.A.2a.
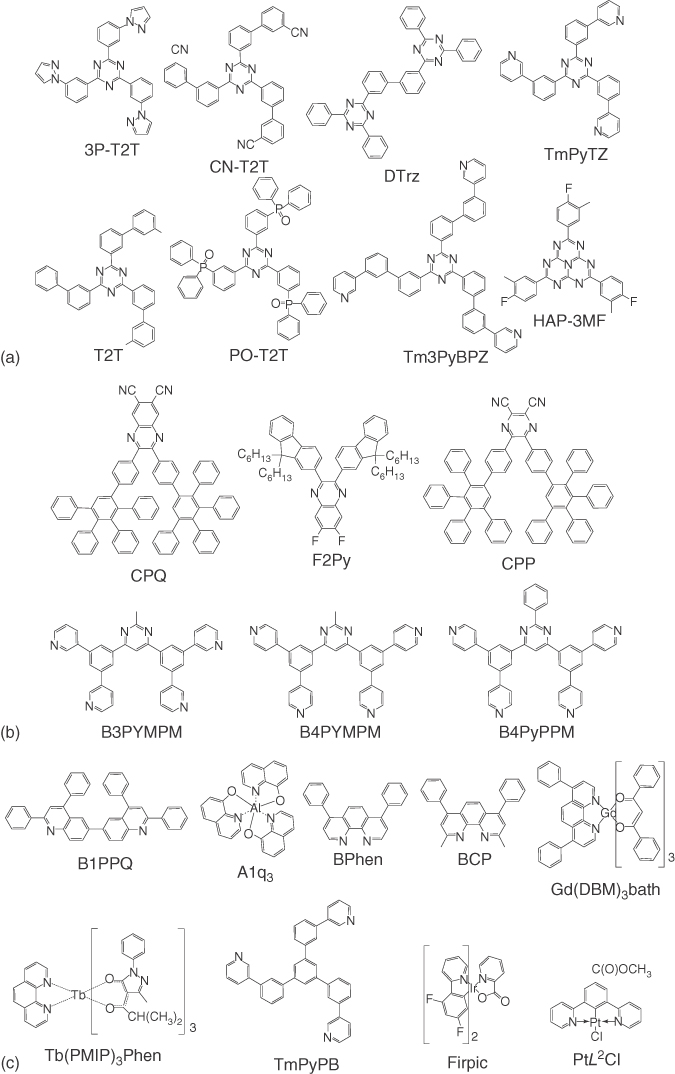
Figure 10.A.2 Electron acceptors containing 1,3,5‐triazines (a), quinoxalines (b), quinolones (c), 1,3,4‐oxadiazoles (d), and triarylboranes or siloles or phosphine oxides or sulfones (e).
Figure 10.A.2b shows the molecular structures of electron acceptors having quinoxalines such as 6,7‐dicyano‐2,3‐di‐[4‐(2,3,4,5‐tetraphenylphenyl)phenyl]quinoxaline (CPQ) [93] and 2,3‐bis(9,9‐dihexyl‐9H‐fluoren‐2‐yl)‐6,7‐difluoroquinoxaline (F2Py) [134], having pyrazines such as 2,3‐dicyano‐5,6‐di‐(4‐(2,3,4,5‐tetraphenylphenyl)phenyl)pyrazine (CPP) [100], and having pyrimidines such as bis‐4,6‐(3,5‐di‐3‐pyridylphenyl)‐2‐methylpyrimidine (B3PYMPM) [3, 97, 106, 136–139], B4PYMPM [6, 82, 98], 2‐phenyl‐4,6‐bis(3,5‐di‐4‐pyridylphenyl)pyrimidine (B4PyPPM) [99, 133].
Figure 10.A.2c depicts the molecular structures of electron acceptors containing quinolines such as B1PPQ [26] and tris(8‐hydoxyquinolate)aluminum (Alq3) [108, 113, 130]; containing phenanthrolines such as 4,7‐diphenyl‐1,10‐phenanthroline (Bphen) [65, 67, 70, 114, 115, 118, 144–146], 2,9‐dimethyl‐4,7‐diphenyl‐1,10‐phenanthroline (BCP) [101, 112, 120], gadolinium(dibenzoylmethanato)3(bathophenanthroline) (Gd(DBM)3bath) [103, 140], and tris‐(1‐phenyl‐3‐methyl‐4‐isobutyryl‐5‐pyrazolone)‐1,10‐phenanthroline‐terbium (Tb(PMIP)3(Phen)) [105]; and containing pyridines such as 1,3,5‐tri(m‐pyrid‐3‐yl‐phenyl)benzene (TmPyPB) [117], iridium(III) bis‐[4,6‐difluorophenyl]‐pyridinato‐N,C2′]‐picolinate (FIrpic) [68], and platinum [methyl‐3,5‐di‐(2‐pyridyl) benzoate] chloride (PtL2Cl) [61].
Molecular structures of electron acceptors with 1,3,4‐oxadiazoles such as 2‐[3,5‐bis(2‐{4‐[5‐(4‐tert‐butylphenyl)‐1,3,4‐oxadiazole‐2‐yl]phenyl}vinyl)phenyl]‐5‐(4‐methylphenyl)‐1,3,4‐oxadiazole (Oxa3d) [126], 2‐(biphenyl‐4‐yl)‐5‐(4‐tert‐butylphenyl)‐1,3,4‐oxadiazole (PBD) [2, 22, 135], and 1,3,5‐tris(4‐tert‐butylphenyl‐1,3,4‐oxadiazolyl)benzene (TBPOB (TPOB)) [107, 121] and electron acceptors with benzimidazoles such as 1,3,5‐tris(N‐phenyl‐benzimidazol‐2‐yl) benzene (TPBi) [64, 65, 67, 119, 123, 125, 129, 147] and 1,3,5‐tris(1‐(4‐(diphenylphosphoryl)phenyl)‐1H‐benzo[d]imidazol‐2‐yl)benzene (TPOB) [125] are shown in Figure 10.A.2d.
Figure 10.A.2e shows the electron acceptors involving triarylboranes or siloles or phosphine oxides or sulfones. 3TPYMB [2, 110, 143] contains a triarylborane. 2,5‐Di‐(3‐biphenyl)‐1,1‐dimethyl‐3,4‐diphenylsilacyclopentadiene (PPSPP) [63] and 2,5‐bis(2′,2′′‐bipyridin‐6‐yl)‐1,1‐dimethyl‐3,4‐diphenylsilacyclopentadiene (PyPySPyPy) [15] contain siloles. (5‐Terphenyl‐1,3‐phenylene)bis(diphenylphosphine oxide) (POPH) [109], 2,8‐bis(diphenylphosphoryl)dibenzo[b,d]thiophene (PPT) [1], and 1,3,5‐tris(diphenylphosphoryl)benzene (TPO) [124] have phosphine oxides. 9,9‐Bis[4‐(phenylsulfonyl)phenyl]fluorene (BPSPF) [122], 5′,5′′′′‐sulfonyl‐di‐1,1′:3′,1′′‐terphenyl (BTPS) [127], and 2,5‐bis(trimethylsilyl)‐thiophene‐1,1‐dioxide (STO) [104, 141, 142] involve sulfones.
10.A.4 Small Molecules with Electron‐donating and Electron‐accepting Moieties Forming Exciplexes
Not only could typical pairs of donor molecules and acceptor molecules form exciplexes, but bipolar molecules could form exciplexes with typical donors or acceptors. The examples of the bipolar small molecules that were employed for OLEDs as exciplexes are shown in Figure 10.A.3. 6‐(9,9‐Dimethylacridin‐10(9H)‐yl)‐3‐methyl‐1H‐isochromen‐1‐one (MAC) [78] and bis[4‐(9,9‐dimethyl‐9,10‐dihydroacridine)phenyl]sulfone (DMAC‐DPS) [73] contain 9,10‐dihydroacridines as donor units. (4‐Dimesitylboryl)phenyltriphenylamine (TPAPB) [71] has a triarylamine as a donor unit. (3′‐(4,6‐Diphenyl‐1,3,5‐triazin‐2‐yl)‐(1,1′‐biphenyl)‐3‐yl)‐9‐carbazole (CzTrz) [74, 148], 3‐{4‐(1,1‐dimesitylboryl)‐phenyl}‐9‐ethyl‐9H‐carbazole (CzPhB) [20], 9‐[2,8]‐9‐carbazole‐[dibenzothiophene‐S,S‐dioxide]‐carbazole (2d) [128], iridium(III)‐bis{5‐(9‐carbazolyl)‐2‐phenyl‐1,2,3‐benzotriazolato‐N,C2′}acetyl‐acetonate complex (IC2) [132], 2,6‐bis(3‐(carbazol‐9‐yl)phenyl)pyridine (26DCzPPy) [69], 3‐(4,6‐diphenyl‐1,3,5‐triazin‐2‐yl)‐9‐phenyl‐9H‐carbazole (DPTPCz) [4, 79], 2‐(4‐biphenylyl)‐5‐(4‐carbazole‐9‐yl)phenyl‐1,3,4‐oxadiazole (CzOxa) [149], 3,6‐di‐(p‐acetylphenyl)‐N‐hexylcarbazole (ANHC) [21], and 3,6‐di‐(p‐cyanophenyl)‐N‐hexylcarbazole (CNHC) [21] have carbazoles as donor moieties. Meanwhile, MAC and ANHC have carbonyl groups as acceptor units. TPAPB and CzPhB have triarylboranes as electron acceptor moieties. CzTrz and DPTPCz contain 1,3,5‐triazines as acceptor units. IC2, 26DCzPPy, CzOxa, and CNHC involve acceptor moieties that are a benzotriazole, a pyridine, a 1,3,4‐oxadiazole, and a cyano group, respectively.

Figure 10.A.3 Bipolar molecules employed for OLEDs as exciplexes.
References
- [1] Goushi, K. and Adachi, C. (2012). Appl. Phys. Lett. 101: 23306.
- [2] Goushi, K., Yoshida, K., Sato, K., and Adachi, C. (2012). Nat. Photonics 6: 253.
- [3] Park, Y.S., Kim, K.H., and Kim, J.J. (2013). Appl. Phys. Lett. 102: 153306.
- [4] Liu, X.K., Chen, Z., Zheng, C.J., Chen, M., Liu, W., Zhang, X.H., and Lee, C.S. (2015). Adv. Mater. 27: 2025.
- [5] Hung, W., Fang, G., Chang, Y., Kuo, T., Chou, P., Lin, S., and Wong, K. (2013). ACS Appl. Mater. Interfaces 5: 6826.
- [6] Kim, K.H., Yoo, S.J., and Kim, J.J. (2016). Chem. Mater. 28: 1936.
- [7] Kavarnos, G.J. and Turro, N.J. (1986). Chem. Rev. 86: 401.
- [8] Kim, D. (2015). J. Phys. Chem. C 119: 12690.
- [9] Halls, J., Cornil, J., dos Santos, D., Silbey, R., Hwang, D.‐H., Holmes, A., Brédas, J., and Friend, R. (1999). Phys. Rev. B 60: 5721.
- [10] Hontz, E., Chang, W., Congreve, D.N., Bulović, V., Baldo, M.A., and Van Voorhis, T. (2015). J. Phys. Chem. C 119: 25591.
- [11] Lee, K. and Kim, D. (2016). J. Phys. Chem. C 120: 28330.
- [12] Samanta, P.K., Kim, D., Coropceanu, V., and Brédas, J.L. (2017). J. Am. Chem. Soc. 139: 4042.
- [13] Dexter, D.L. (1953). J. Chem. Phys. 21: 836.
- [14] Brédas, J.‐L., Beljonne, D., Coropceanu, V., and Cornil, J. (2004). Chem. Rev. 104: 4971.
- [15] Palilis, L.C., Murata, H., Uchida, M., and Kafafi, Z.H. (2003). Org. Electron. 4: 113.
- [16] Inai, Y., Sisido, M., and Imanishi, Y. (1990). J. Phys. Chem. 94: 6237.
- [17] Wang, H., Xie, L., Peng, Q., Meng, L., Wang, Y., Yi, Y., and Wang, P. (2014). Adv. Mater. 26: 5198.
- [18] Lee, J., Yuan, Y.Y., Kang, Y., Jia, W.L., Lu, Z.H., and Wang, S. (2006). Adv. Funct. Mater. 16: 681.
- [19] Yip, W.T. and Levy, D.H. (1996). J. Phys. Chem. 100: 11539.
- [20] Lin, S.L., Chan, L.H., Lee, R.H., Yen, M.Y., Kuo, W.J., Chen, C.T., and Jeng, R.J. (2008). Adv. Mater. 20: 3947.
- [21] Nayak, P.K., Agarwal, N., Periasamy, N., Patankar, M.P., and Narasimhan, K.L. (2010). Synth. Met. 160: 722.
- [22] Graves, D., Jankus, V., Dias, F.B., and Monkman, A. (2014). Adv. Funct. Mater. 24: 2343.
- [23] Gould, I.R., Young, R.H., Mueller, L.J., Albrecht, A.C., and Farid, S. (1994). J. Am. Chem. Soc. 116: 8188.
- [24] Gould, I.R., Boiani, J.A., Gaillard, E.B., Goodman, J.L., and Farid, S. (2003). J. Phys. Chem. A 107: 3515.
- [25] Young, R.H., Feinberg, A.M., Dinnocenzo, J.P., and Farid, S. (2015). Photochem. Photobiol. 91: 624.
- [26] Kulkarni, A.P. and Jenekhe, S.A. (2008). J. Phys. Chem. C 112: 5174.
- [27] Vandewal, K., Gadisa, A., Oosterbaan, W.D., Bertho, S., Banishoeib, F., Van Severen, I., Lutsen, L., Cleij, T.J., Vanderzande, D., and Manca, J.V. (2008). Adv. Funct. Mater. 18: 2064.
- [28] Itaya, A., Kitagawa, T., Moriyama, T., Matsushita, T., and Miyasaka, H. (1997). J. Phys. Chem. B 101: 524.
- [29] Goris, L., Haenen, K., Nesládek, M., Wagner, P., Vanderzande, D., De Schepper, L., D'haen, J., Luisen, L., and Manca, J.V. (2005). J. Mater. Sci. 40: 1413.
- [30] Goris, L., Poruba, A., Hod'Ákova, L., Vaněček, M., Haenen, K., Nesládek, M., Wagner, P., Vanderzande, D., De Schepper, L., and Manca, J.V. (2006). Appl. Phys. Lett. 88: 52113.
- [31] Vandewal, K., Goris, L., Haeldermans, I., Nesládek, M., Haenen, K., Wagner, P., and Manca, J.V. (2008). Thin Solid Films 516: 7135.
- [32] Vandewal, K., Tvingstedt, K., Gadisa, A., Inganäs, O., and Manca, J.V. (2009). Nat. Mater. 8: 904.
- [33] Clarke, T.M. and Durrant, J.R. (2010). Chem. Rev. 110: 6736.
- [34] Vandewal, K., Albrecht, S., Hoke, E.T., Graham, K.R., Widmer, J., Douglas, J.D., Schubert, M., Mateker, W.R., Bloking, J.T., Burkhard, G.F., Sellinger, A., Frechet, J.M., Amassian, A., Riede, M.K., McGehee, M.D., Neher, D., and Salleo, A. (2014). Nat. Mater. 13: 63.
- [35] Hallermann, M., Kriegel, I., Da Como, E., Berger, J.M., Von Hauff, E., and Feldmann, J. (2009). Adv. Funct. Mater. 19: 3662.
- [36] Gould, I.R., Noukalcis, D., Gomez‐Jahn, L., Young, R.H., Goodman, J.L., and Farid, S. (1993). Chem. Phys. 176: 439.
- [37] Bixon, M., Jortner, J., and Verhoeven, J.W. (1994). J. Am. Chem. Soc. 116: 7349.
- [38] Verhoeven, J.W., Scherer, T., Wegewijs, B., Hermant, R.M., Jortner, J., Bixon, M., Depaemelaere, S., and de Schryver, F.C. (1995). Rec. Trav. Chim. Pays Bas 114: 443.
- [39] Arnold, B.R., Farid, S., Goodman, J.L., and Gould, I.R. (1996). J. Am. Chem. Soc. 118: 5482.
- [40] Jortner, J. and Bixon, M. (1988). J. Chem. Phys. 88: 167.
- [41] Gould, I.R., Young, R.H., Moody, R.E., and Farid, S. (1991). J. Phys. Chem. 95: 2068.
- [42] Asahi, T. and Mataga, N. (1991). J. Phys. Chem. 95: 1956.
- [43] Iwai, S., Murata, S., Katoh, R., Tachiya, M., Kikuchi, K., and Takahashi, Y. (2000). J. Chem. Phys. 112: 7111.
- [44] Turro, N.J. (1991). Modern Molecular Photochemistry. University Science Books.
- [45] Morais, J., Hung, R.R., Grabowski, J.J., and Zimmt, M.B. (1993). J. Phys. Chem. 97: 13138.
- [46] El‐Sayed, M.A. (1963). J. Chem. Phys. 38: 2834.
- [47] Kuzmin, M.G., Soboleva, I.V., Dolotova, E.V., and Dogadkin, D.N. (2005). High Energy Chem. 39: 86.
- [48] Ogiwara, T., Wakikawa, Y., and Ikoma, T. (2015). J. Phys. Chem. A 119: 3415.
- [49] Gibson, J., Monkman, A.P., and Penfold, T.J. (2016). Chem. Phys. Chem. 17: 2956.
- [50] Marian, C.M. (2016). J. Phys. Chem. C 120: 3715.
- [51] Rao, A., Chow, P.C.Y., Gélinas, S., Schlenker, C.W., Li, C.‐Z., Yip, H.‐L., Jen, A.K.Y., Ginger, D.S., and Friend, R.H. (2013). Nature 500: 435.
- [52] Giebink, N.C., D'Andrade, B.W., Weaver, M.S., MacKenzie, P.B., Brown, J.J., Thompson, M.E., and Forrest, S.R. (2008). J. Appl. Phys. 103: 44509.
- [53] Berleb, S., Brütting, W., and Paasch, G. (2000). Org. Electron. 1: 41.
- [54] Noguchi, Y., Miyazaki, Y., Tanaka, Y., Sato, N., Nakayama, Y., Schmidt, T.D., Brütting, W., and Ishii, H. (2012). J. Appl. Phys. 111: 114508.
- [55] Hung, W.Y., Chiang, P.Y., Lin, S.W., Tang, W.C., Chen, Y.T., Liu, S.H., Chou, P.T., Hung, Y.T., and Wong, K.T. (2016). ACS Appl. Mater. Interfaces 8: 4811.
- [56] Baldo, M., Adachi, C., and Forrest, S.R. (2000). Phys. Rev. B 62: 10967.
- [57] Baleizão, C. and Berberan‐Santos, M.N. (2007). J. Chem. Phys. 126: 204510.
- [58] Frederichs, B. and Staerk, H. (2008). Chem. Phys. Lett. 460: 116.
- [59] Bachilo, S.M., Benedetto, A.F., Weisman, R.B., Nossal, J.R., and Billups, W.E. (2000). J. Phys. Chem. A 104: 11265.
- [60] Deotare, P.B., Chang, W., Hontz, E., Congreve, D.N., Shi, L., Reusswig, P.D., Modtland, B., Bahlke, M.E., Lee, C.K., Willard, A.P., Bulović, V., Van Voorhis, T., and Baldo, M.A. (2015). Nat. Mater. 14: 1130.
- [61] Kalinowski, J., Cocchi, M., Virgili, D., Fattori, V., and Williams, J.A.G. (2007). Adv. Mater. 19: 4000.
- [62] Tamoto, N., Adachi, C., and Nagai, K. (1997). Chem. Mater. 9: 1077.
- [63] Palilis, L.C., Makinen, A.J., Uchida, M., and Kafafi, Z.H. (2003). Appl. Phys. Lett. 82: 2209.
- [64] Jankus, V., Chiang, C.J., Dias, F., and Monkman, A.P. (2013). Adv. Mater. 25: 1455.
- [65] Zhang, T., Chu, B., Li, W., Su, Z., Peng, Q.M., Zhao, B., Luo, Y., Jin, F., Yan, X., Gao, Y., Wu, H., Zhang, F., Fan, D., and Wang, J. (2014). ACS Appl. Mater. Interfaces 6: 11907.
- [66] Li, J., Nomura, H., Miyazaki, H., and Adachi, C. (2014). Chem. Commun. (Camb). 50: 6174.
- [67] Zhang, T., Zhao, B., Chu, B., Li, W., Su, Z., Wang, L., Wang, J., Jin, F., Yan, X., Gao, Y., Wu, H., Liu, C., Lin, T., and Hou, F. (2015). Org. Electron. 24: 1.
- [68] Cherpak, V., Stakhira, P., Minaev, B., Baryshnikov, G., Stromylo, E., Helzhynskyy, I., Chapran, M., Volyniuk, D., Hotra, Z., Dabuliene, A., Tomkeviciene, A., Voznyak, L., and Grazulevicius, J.V. (2015). ACS Appl. Mater. Interfaces 7: 1219.
- [69] Chen, D., Wang, Z., Wang, D., Wu, Y.C., Lo, C.C., Lien, A., Cao, Y., and Su, S.J. (2015). Org. Electron. physics, Mater. Appl. 25: 79.
- [70] Zhao, B., Zhang, T., Chu, B., Li, W., Su, Z., Luo, Y., Li, R., Yan, X., Jin, F., Gao, Y., and Wu, H. (2015). Org. Electron. physics, Mater. Appl. 17: 15.
- [71] Chen, Z., Liu, X.‐K., Zheng, C.‐J., Ye, J., Liu, C.‐L., Li, F., Ou, X.‐M., Lee, C.‐S., and Zhang, X.‐H. (2015). Chem. Mater. 27: 5206.
- [72] Zhang, T., Zhao, B., Chu, B., Li, W., Su, Z., Yan, X., Liu, C., Wu, H., Gao, Y., Jin, F., and Hou, F. (2015). Sci. Rep. 5: 10234.
- [73] Zhang, T., Zhao, B., Chu, B., Li, W., Su, Z., Yan, X., Liu, C., Wu, H., Jin, F., and Gao, Y. (2015). Org. Electron. physics, Mater. Appl. 25: 6.
- [74] Oh, C.S., Kang, Y.J., Jeon, S.K., and Lee, J.Y. (2015). J. Phys. Chem. C 119: 22618.
- [75] Liu, X.K., Chen, Z., Qing, J., Zhang, W.J., Wu, B., Tam, H.L., Zhu, F., Zhang, X.H., and Lee, C.S. (2015). Adv. Mater. 27: 7079.
- [76] Zhang, L., Cai, C., Li, K.F., Tam, H.L., Chan, K.L., and Cheah, K.W. (2015). ACS Appl. Mater. Interfaces 7: 24983.
- [77] Chen, D., Xie, G., Cai, X., Liu, M., Cao, Y., and Su, S.J. (2016). Adv. Mater. 28: 239.
- [78] Liu, W., Chen, J.‐X., Zheng, C.‐J., Wang, K., Chen, D.‐Y., Li, F., Dong, Y.‐P., Lee, C.‐S., Ou, X.‐M., and Zhang, X.‐H. (2016). Adv. Funct. Mater. 26: 2002.
- [79] Liu, X.K., Chen, Z., Zheng, C.J., Wang, K., Chen, D.-Y., Li, F., Dong, Y.-P., Lee, C.-S., Ou, X.-M., and Zhang, X.-H. (2015). Adv. Mater. 27: 2378.
- [80] Mikhnenko, O.V., Blom, P.W.M., and Nguyen, T.‐Q. (2015). Energy Environ. Sci. 8: 1867.
- [81] Zhao, B., Zhang, T., Chu, B., Li, W., Su, Z., Wu, H., Yan, X., Jin, F., Gao, Y., and Liu, C. (2015). Sci. Rep. 5: 10697.
- [82] Kim, K.H., Moon, C.K., Sun, J.W., Sim, B., and Kim, J.J. (2015). Adv. Opt. Mater. 3: 895.
- [83] Kawamura, Y., Brooks, J., Brown, J.J., Sasabe, H., and Adachi, C. (2006). Phys. Rev. Lett. 96: 11.
- [84] Shirota, Y. and Kageyama, H. (2007). Chem. Rev. 107: 953.
- [85] Zhigang, R.L. (2015). Organic Light‐Emitting Materials and Devices. CRC Press.
- [86] Ge, Z., Hayakawa, T., Ando, S., Ueda, M., Akiike, T., Miyamoto, H., Kajita, T., and Kakimoto, M. (2008). Chem. Lett. 37: 262.
- [87] Chen, Y.‐M., Hung, W.‐Y., You, H.‐W., Chaskar, A., Ting, H.‐C., Chen, H.‐F., Wong, K.‐T., and Liu, Y.‐H. (2011). J. Mater. Chem. 21: 14971.
- [88] Zhang, X., Shen, W., Zhang, D., Zheng, Y., He, R., and Li, M. (2015). RSC Adv. 5: 51586.
- [89] Gaspar, D.J. and Polikarpov, E. (2015). OLED Fundamentals: Materials, Devices, and Processing of Organic Light‐Emitting Diodes. CRC Press.
- [90] Hughes, G. and Bryce, M.R. (2005). J. Mater. Chem. 15: 94.
- [91] Jeon, S.O. and Lee, J.Y. (2012). J. Mater. Chem. 22: 4233.
- [92] Sasabe, H., Seino, Y., Kimura, M., and Kido, J. (2012). Chem. Mater. 24: 1404.
- [93] Xu, X., Yu, G., Chen, S., Di, C., and Liu, Y. (2008). J. Mater. Chem. 18: 299.
- [94] Murata, H., Malliaras, G.G., Uchida, M., Shen, Y., and Kafafi, Z.H. (2001). Chem. Phys. Lett. 339: 161.
- [95] Banal, J.L., Subbiah, J., Graham, H., Lee, J.‐K., Ghiggino, K.P., and Wong, W.W.H. (2013). Polym. Chem. 4: 1077.
- [96] Tekarli, S.M., Cundari, T.R., and Omary, M.A. (2008). J. Am. Chem. Soc. 130: 1669.
- [97] Park, Y.S., Jeong, W.I., and Kim, J.J. (2011). J. Appl. Phys. 110: 124519.
- [98] Komatsu, R., Sasabe, H., Inomata, S., Pu, Y.J., and Kido, J. (2015). Synth. Met. 202: 165.
- [99] Seino, Y., Inomata, S., Sasabe, H., Pu, Y.J., and Kido, J. (2016). Adv. Mater. 28: 2638.
- [100] Xu, X., Chen, S., Yu, G., Di, C., You, H., Ma, D., and Liu, Y. (2007). Adv. Mater. 19: 1281.
- [101] Zhu, H., Xu, Z., Zhang, F., Zhao, S., and Song, D. (2008). Appl. Surf. Sci. 254: 5511.
- [102] Kalinowski, J., Cocchi, M., Virgili, D., and Sabatini, C. (2006). Appl. Phys. Lett. 89: 11105.
- [103] Wang, D.Y., Li, W.L., Chu, B., Liang, C.J., Hong, Z.R., Li, M.T., Wei, H.Z., Xin, Q., Niu, J.H., and Xu, J.B. (2006). J. Appl. Phys. 100: 24506.
- [104] Mazzeo, M., Pisignano, D., Favaretto, L., Sotgiu, G., Barbarella, G., Cingolani, R., and Gigli, G. (2003). Synth. Met. 139: 675.
- [105] Xin, H., Guang, M., Li, F.Y., Bian, Z.Q., Huang, C.H., Ibrahim, K., and Liu, F.Q. (2002). Phys. Chem. Chem. Phys. 4: 5895.
- [106] Shin, H., Lee, S., Kim, K.H., Moon, C.K., Yoo, S.J., Lee, J.H., and Kim, J.J. (2014). Adv. Mater. 26: 4730.
- [107] Ogawa, H., Okuda, R., and Shirota, Y. (1998). Mol. Cryst. Liq. Cryst. Sci. Technol. Sect. A. 315: 187.
- [108] Matsumoto, N., Nishiyama, M., and Adachi, C. (2008). J. Phys. Chem. C 112: 7735.
- [109] Ban, X., Sun, K., Sun, Y., Huang, B., Ye, S., Yang, M., and Jiang, W. (2015). ACS Appl. Mater. Interfaces 7: 25129.
- [110] Huang, Q., Zhao, S., Xu, Z., Fan, X., Shen, C., and Yang, Q. (2014). Appl. Phys. Lett. 104: 161112.
- [111] Lee, J.H., Cheng, S.H., Yoo, S.J., Shin, H., Chang, J.H., Wu, C.I., Wong, K.T., and Kim, J.J. (2015). Adv. Funct. Mater. 25: 361.
- [112] Chen, L.L., Li, W.L., Li, M.T., and Chu, B. (2007). J. Lumin. 122–123: 667.
- [113] Michaleviciute, A., Gurskyte, E., Volyniuk, D.Y., Cherpak, V.V., Sini, G., Stakhira, P.Y., and Grazulevicius, J.V. (2012). J. Phys. Chem. C 116: 20769.
- [114] Wang, D., Li, W., Chu, B., Su, Z., Bi, D., Zhang, D., Zhu, J., Yan, F., Chen, Y., and Tsuboi, T. (2008). Appl. Phys. Lett. 92: 53304.
- [115] Chapran, M., Ivaniuk, K., Stakhira, P., Cherpak, V., Hotra, Z., Volyniuk, D., Michaleviciute, A., Tomkeviciene, A., Voznyak, L., and Grazulevicius, J.V. (2015). Synth. Met. 209: 173.
- [116] Nakanotani, H., Furukawa, T., Morimoto, K., and Adachi, C. (2016). Sci. Adv. 2: e1501470.
- [117] Wang, S., Wang, X., Yao, B., Zhang, B., Ding, J., Xie, Z., and Wang, L. (2015). Sci. Rep. 5: 12487.
- [118] Duan, Y., Sun, F., Yang, D., Yang, Y., Chen, P., and Duan, Y. (2014). Appl. Phys. Express 7: 52102.
- [119] Zhang, G., Li, W., Chu, B., Su, Z., Yang, D., Yan, F., Chen, Y., Zhang, D., Han, L., Wang, J., Liu, H., Che, G., Zhang, Z., and Hu, Z. (2009). Org. Electron. physics, Mater. Appl. 10: 352.
- [120] Wu, C., Djurovich, P.I., and Thompson, M.E. (2009). Adv. Funct. Mater. 19: 3157.
- [121] Ogawa, H., Okuda, R., and Shirota, Y. (1998). Appl. Phys. A Mater. Sci. Process. 67: 599.
- [122] Seino, Y., Sasabe, H., Kimura, M., Inomata, S., Nakao, K., and Kido, J. (2016). Chem. Lett. 45: 283.
- [123] Wang, X., Wang, R., Zhou, D., and Yu, J. (2016). Synth. Met. 214: 50.
- [124] Ban, X., Sun, K., Sun, Y., Huang, B., and Jiang, W. (2016). Org. Electron. 33: 9.
- [125] Ban, X., Sun, K., Sun, Y., Huang, B., and Jiang, W. (2016). ACS Appl. Mater. Interfaces 8: 2010.
- [126] Cha, S.W. and Jin, J.‐I. (2003). J. Mater. Chem. 13: 479.
- [127] Seino, Y., Sasabe, H., Pu, Y.J., and Kido, J. (2014). Adv. Mater. 26: 1612.
- [128] Jankus, V., Data, P., Graves, D., McGuinness, C., Santos, J., Bryce, M.R., Dias, F.B., and Monkman, A.P. (2014). Adv. Funct. Mater. 24: 6178.
- [129] Kim, B.S. and Lee, J.Y. (2014). Adv. Funct. Mater. 24: 3970.
- [130] Okumoto, K. and Shirota, Y. (2000). J. Lumin. 87: 1171.
- [131] Li, G., Kim, C.H., Zhou, Z., Shinar, J., Okumoto, K., and Shirota, Y. (2006). Appl. Phys. Lett. 88: 10.
- [132] Cherpak, V., Stakhira, P., Minaev, B., Baryshnikov, G., Stromylo, E., Helzhynskyy, I., Chapran, M., Volyniuk, D., Tomkuté‐Lukšiené, D., Malinauskas, T., Getautis, V., Tomkeviciene, A., Simokaitiene, J., and Grazulevicius, J.V. (2014). J. Phys. Chem. C 118: 11271.
- [133] He, S.J., Wang, D.K., Jiang, N., Tse, J.S., and Lu, Z.H. (2016). Adv. Mater. 28: 649.
- [134] Zhang, W., Yu, J.S., Huang, J., Jiang, Y.D., Zhang, Q., and Cao, K.L. (2010). Chinese Phys. B 19: 47802.
- [135] Zhao, D., Zhang, F., Xu, C., Sun, J., Song, S., Xu, Z., and Sun, X. (2008). Appl. Surf. Sci. 254: 3548.
- [136] Sun, J.W., Lee, J.H., Moon, C.K., Kim, K.H., Shin, H., and Kim, J.J. (2014). Adv. Mater. 26: 5684.
- [137] Lee, S., Shin, H., and Kim, J.J. (2014). Adv. Mater. 26: 5864.
- [138] Lee, S., Kim, K.H., Limbach, D., Park, Y.S., and Kim, J.J. (2013). Adv. Funct. Mater. 23: 4105.
- [139] Park, Y.S., Lee, S., Kim, K.H., Kim, S.Y., Lee, J.H., and Kim, J.J. (2013). Adv. Funct. Mater. 23: 4914.
- [140] Liang, C.J., Zhao, D., Hong, Z.R., Li, R.G., Li, W.L., and Yu, J.Q. (2000). Thin Solid Films 371: 207.
- [141] Mazzeo, M., Pisignano, D., Della Sala, F., Thompson, J., Blyth, R.I.R., Gigli, G., Cingolani, R., Sotgiu, G., and Barbarella, G. (2003). Appl. Phys. Lett. 82: 334.
- [142] Mazzeo, M., Thompson, J., Blyth, R.I.R., Anni, M., Gigli, G., and Cingolani, R. (2002). Phys. E Low‐Dimensional Syst. Nanostructures 13: 1243.
- [143] Lei, Y., Zhang, Q., Chen, L., Ling, Y., Chen, P., Song, Q., and Xiong, Z. (2016). Adv. Opt. Mater. 4: 694.
- [144] Zhu, L., Xu, K., Wang, Y., Chen, J., and Ma, D. (2015). Front. Optoelectron. 8: 439.
- [145] Yan, F., Chen, R., Sun, H., and Sun, X.W. (2014). Appl. Phys. Lett. 104: 2012.
- [146] Kalinowski, J. (2008). J. Non. Cryst. Solids 354: 4170.
- [147] Zhou, D.Y., Cui, L.S., Zhang, Y.J., Liao, L.S., and Aziz, H. (2014). Appl. Phys. Lett. 105: 2012.
- [148] Zhang, D., Cai, M., Zhang, Y., Bin, Z., Zhang, D., and Duan, L. (2016). ACS Appl. Mater. Interfaces 8: 3825.
- [149] Guan, M., Bian, Z.Q., Zhou, Y.F., Li, F.Y., Li, Z.J., and Huang, C.H. (2003). Chem. Commun. (Camb). 21: 2708.