
12
Photophysics of Thermally Activated Delayed Fluorescence
Andrew Monkman
University of Durham, OEM Research Group, Department of Physics, South Road, Durham, DH1 3LE, England
12.1 Introduction
One of the major successes of OLED research has been the discovery of methods to overcome the limitation imposed by charge recombination spin statistics [1]. As we know, upon charge recombination three times more triplet excited states are generated than singlet states; therefore the maximum internal efficiency (IQE) of an OLED is limited to 25% [2], unless methods to “harvest” the triplets, i.e. convert them to emissive singlet states, are used. Saying this, in many fluorescent OLEDs, the 25% limit is exceeded by the “accidental” use of triplet fusion (TF), one decay channel from the process of triplet–triplet annihilation (TTA) [3]. In this case, the maximum theoretical total singlet yield can reach 62.5% with devices showing >40% TF contribution having been demonstrated [4, 5]; however this approach is unsatisfactory as it falls far short of what can be achieved using phosphorescent emitters and also in practice only gives rise to best blue fluorescent OLEDs with around 11% IQE.
Phosphorescent materials containing Ir(III), Pt(II), or other heavy metals can harvest both singlet and triplet excited states by means of enhanced intersystem crossing (ISC), via the heavy atom effect, and have been used widely to increase the internal emission yield in an OLED to ∼100% [6]. Currently, these provide the state‐of‐the‐art green and red emitting complexes but have to be dispersed in charge transporting matrices to avoid aggregation‐induced quenching, and obtaining stable long lifetime deep blue emitting phosphors has proved difficult and requires suitable high triplet level hosts [7]. Thus long lifetime deep blue phosphorescent OLEDs have not been demonstrated because of a variety of reasons [8, 9]. This has led to new searches for methods by which triplets can be converted to singlets efficiently to yield near 100% efficient OLEDs, especially in the elusive deep blue.
What in fact has been known for over 90 years is that there is just such another triplet harvesting method that uses thermal activation to enable the upconversion of triplet into singlet states [10, 11]. Perrin in 1929 [12] first proposed that thermal activation of a “dark” state to a singlet state gave rise to delayed fluorescence. It was not until the mid‐1940s that such a dark state was proposed to be a triplet excited state [13, 14]. E‐type delayed fluorescence was described by Parker et al. [15] as the thermal activation of a triplet state to a higher‐lying vibronic state followed by “reverse” intersystem crossing (rISC) to a resonant singlet vibronic state, giving the first real experimental proof of the existence of unique triplet excited states in organic materials. It was termed E‐type delayed fluorescence having been first observed in eosin dyes. It is distinct from P‐type delayed fluorescence that arises from triplet annihilation, often incorrectly ascribed as E‐type [16], and is directly proportional to the energy gap between the triplet and singlet states, ΔEST, as depicted in Scheme 12.1. As will be shown later, this is a very simplified overview of the physics involved in the rISC step. However, the term “TADF,” or thermally activated delayed fluorescence, now used throughout the OLED literature was first used by Wilkinson and Horrocks as far back as 1968. In order to maximize E‐type delayed fluorescence, ΔEST should be minimized. As predicted by Beens and Weller [17], intramolecular charge‐transfer (ICT) states where the electron and hole are decoupled on different orbitals of the donor and acceptor fragments of the system have zero exchange energy to first order, giving rise to E‐type delayed fluorescence [18]. This is because they are separated spatially to a large extent and do not interact, or in some cases the donor and acceptor fragments are orthogonal and again the two electrons do not interact [19]. E‐type delayed fluorescence remained a scientific “curiosity” until very recently because no molecules with low enough ΔEST were discovered and almost all work was carried out in solution, not solid state.
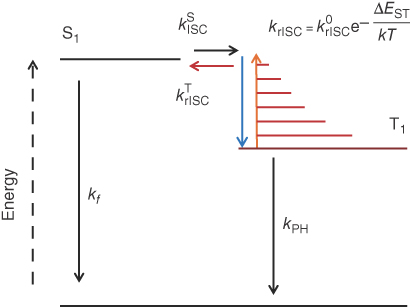
Scheme 12.1 Simplified schematic energy level diagram for an E‐type process with transition rates shown.
The two‐step nature of the rISC is shown in this scheme, whereby thermal activation is required to increase the triplet state to a vibrational level isoenergetic with one in the singlet manifold such that an adiabatic spin flip can proceed. This is required because the energy change during the spin flip is negligible, ≪μJ. The overall rate of rISC is thus dictated by both the Boltzmann term and the rate of the spin flip, k0rISC. In the case of charge‐transfer (CT) molecules however, this is not the case, as explained here and in the Chapter by Tom Penfold.
The recent change in fortune for E‐type delayed fluorescence is told in the opening chapters of this book, and the term thermally activated delayed fluorescence or “TADF” reused by Adachi et al. [20] ICT molecules based on electron‐ and hole‐transporting molecules used in OLEDs were found to have sufficiently small ΔEST such that the TADF effect greatly enhanced OLED efficiency [11, 21], up to a point where near 100% internal efficiency has been reported [22, 23]. Similar progress was also made in Cu(I) metalorganic complexes as well (see Chapter by Yersin et al.), although devices are more difficult to fabricate with these systems. Surprisingly, the ΔEST gap measured for most of these early systems was still rather large, much greater than the expected difference between the singlet and triplet CT states in a simple ICT system (<100 meV), but could yield efficient TADF. For example, in a series of materials containing electron donor (D) and electron acceptor (A) units, and D–A–D structures, showing singlet–triplet energy gaps (ΔEST) from 0.32 to 0.54 eV and efficient TADF in the blue spectral region [23], the authors tentatively describe the origin of TADF to a mechanism that involves reverse internal conversion (rIC), from the donor‐centered 3ππ* lowest triplet state to the 3CT, followed by rISC to the 1CT emissive state. However, the total energy gap between the lowest singlet 1CT and triplet 3ππ* states is still surprisingly high in order to give such efficient TADF, when compared with the 25 meV, kT value at room temperature (RT).
From these initial promising findings using TADF to harvest triplets, we set out to use a range of different spectroscopic measurements to try to unravel the mechanisms that drive and control both rISC and hence TADF. We established that the energy levels involved are more complex than previously appreciated, with heteroatom lone pair orbitals playing a key role in this process, and that the key excited states involved in rISC are the lowest‐energy local triplet state along with the singlet and triplet CT states. In this chapter we show the types of measurements we have employed and how the analysis of these results has led us to a detailed understanding of rISC and TADF, as well as factors that greatly influence TADF efficiency in devices.
In addition to ICT molecules, the CT states formed in an exciplex (excited‐state complex) between donor and acceptor molecules also give rise to small ΔEST gap, and exciplex TADF devices with enhanced efficiency have been subsequently demonstrated [11, 21]. However, as our spectroscopic studies have shown, the picture in exciplexes is made more complex by structural inhomogeneity [24]. This leads on to very complex, mixed photophysics with contributions from dimer states [25] as well as exciplex delayed fluorescence and strongly competing TTA [16]. Thus, for clarity, in this chapter, only measurements on ICT systems are given so that a clearer picture can emerge. However, from a large‐scale investigation of exciplex systems, we have been able to conclude that the same basic underlying photophysics and mechanisms control TADF in exciplexes as we find in the ICT molecules but the dispersion caused by morphological inhomogeneity smears out all responses and the competition with TTA is far more prevalent than in ICT systems. The reader is pointed to the work of dos Santos for a clearer understanding of the photophysics of exciplexes [26].
12.2 Comments on the Techniques Used in Our Studies
Basic absorption and fluorescence measurements using standard laboratory spectrometers can give a good idea about the potential efficiency of TADF in a candidate molecule, especially using slightly nonstandard measurements, described in subsequent sections. In all cases we extract excited‐state energies from spectra by calculating the onset of emission. This is obvious for local excited states, but in the case of CT states, there is a tendency to take the energy from the peak position of the broad emission band. This we believe is incorrect because as with local bands, the onset gives pure electronic energy, whereas the lower‐energy part of the band arises from transitions to vibronic levels of the ground state. The band is structureless because of inhomogeneity and vibronic and phonon coupling within the manifold of emitting molecules. However, these basic measurements can only go so far, and it is time‐resolved measurements that are the real workhorse here. The main problem though is the time regime of most interest, the microsecond, because this is the most neglected in time‐resolved spectroscopy. Whereas both picosecond and nanosecond fluorescence lifetime measurements are now rather routine, especially using time‐correlated single‐photon counting techniques [27], measuring emission at longer times is not common, and moreover, to study delayed emission, the (usually) far stronger prompt emission must be gated out to give sufficient signal to noise to allow proper kinetic measurement and lifetime determination of the delayed component to be made. In Durham we have been developing time‐resolved gated emission measurements to study both delayed fluorescence [27, 28] and phosphorescence (PH) [29, 30] from OLED materials for over a decade. Our methodology is based on the use of intensified CCD cameras and 100 ps pulse Nd:YAG (355 nm) and 1 ns pulse nitrogen laser (337 nm) sources. The iCCDs can be gated within 100 ps of the excitation pulse and detection delays ranging from 200 ps to 100's of milliseconds programmed. This makes them ideal tools to study delayed emission, and with careful sliding gate and delay protocols, single measurements can be made with very high dynamic range, up to 9 decades of time and 13 decades of intensity [31, 32]. These measurements give not only the lifetime of the various decay channels seen in these ICT materials but also the emission spectrum at each delay time so that contributions from various species can be differentiated and assigned. Further, and very importantly, the intensity dependence of the delay emission can be measured to unambiguously differentiate between TADF and TTA and geminate pair recombination [33].
12.3 Basic Absorption and Emission Properties
Photophysical measurements in isolation on one material tell you a lot about that material but little about the general photophysics and mechanisms underpinning the class of molecular responses. Thus it is vital for the spectroscopist to work hand in hand with chemistry colleagues to generate series of materials and next‐generation materials designed from what is learned from photophysics. In Durham we are very fortunate to have Prof. Martin Bryce and his team in chemistry whom we have worked with for a very long time; without their input we could not have made much progress in this field. Our first ICT materials were a family based around our then newly designed electron‐transport building block (the acceptor unit, A) dibenzothiophene‐S,S‐dioxide, with weak donor groups (D) based on fluorene units [34, 35]. These systems are more classical ICT systems and display the characteristic responses of CT excited states but little hint of TADF as the ΔEST is large, but from them though the basic D–A–D motif was born and a new generation of materials synthesized. A systematic series of D–A–D materials comprising five different core A units substituted with five different D units was subsequently synthesized [23, 36, 37]. These then led on to new generations of materials with very large TADF efficiencies. Various evolutions of the D–A–D (and analogous D–A molecules) motif are shown throughout the chapter, where possible X‐ray crystal structures are also given to show the orientation of D and A, which is very informative, even if somewhat of a single “snapshot” of the molecular structure. We have found through careful study of pure compounds very little difference in the photophysics and optical properties of D–A–D and D–A analogues [38]. What is important for all efficient TADF molecules we have found so far is the bonding pattern between D and A; they should be bound through a nitrogen atom at the para position (with respect to the A sulfur heteroatom) of the A unit, which in most cases leads to near orthogonality between D and A unit. For a very typical TADF ICT molecule, phenothiazine‐dibenzothiophene‐S,S‐dioxide (PTZ‐DBTO2), this can be seen in the X‐ray structure of the molecule (Figure 12.1).
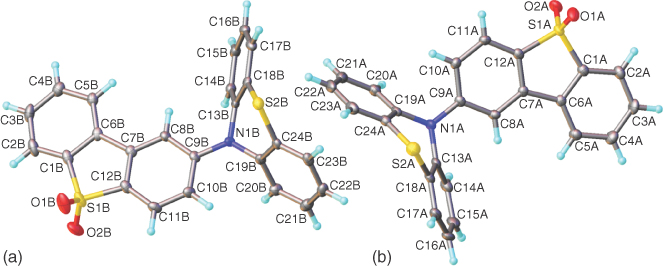
Figure 12.1 X‐ray crystal structure of phenothiazine‐dibenzothiophene‐S,S‐dioxide. The asymmetric unit contains two molecules (a and b) of similar conformation. In both, the dibenzothiophene system is planar, while the phenothiazine moiety is folded along the N…S vector by 47.0° (a) and 52.6° (b). The N atom is nearly, but not fully, planarized (sum of bond angles 356.0° and 358.1°); its bonding plane is inclined by 10.2° (a) and 5.2° (b) to the dibenzothiophene plane. The angle between dibenzothiophene and the C(9)N(1)S(2) plane equals 83.2° (a) and 87.1° (b).
Consistent with the single‐crystal X‐ray data, showing potentially very weak ground‐state electronic coupling between the D and A units, the absorption spectrum of PTZ‐DBTO2 is almost entirely formed by the superposition of the D and A fragment absorptions (Figure 12.2). This confirms the very limited conjugation between the D and A units, i.e. electronically decoupled nature of the D and A fragments in the molecule, such that the D and A are effectively isolated electronically from one another, which is imposed by the nearly perpendicular D–A orientation. The emission of the D–A molecule is strongly redshifted compared with the emission of either D or A fragments. The fluorescence from PTZ‐DBTO2 appears broad and featureless, as is typically observed from excited states with strong CT character, in both solution and solid state [20]. This Gaussian band shape is not dependent on the polarity of the medium in which the PTZ‐DBTO2 is dissolved, unlike ICT molecules with weaker CT or nonperpendicular D–A structure. In these cases structured emission is usually seen in nonpolar solvents. The emission Stokes shift is large and is dependent on solvent polarity. The emissive singlet state in PTZ‐DBTO2 is thereafter identified as 1CT.

Figure 12.2 (a) Chemical structures of PTZ‐DBTO2. (b) The absorption spectra of the D and A fragments as well as that of PTZ‐DBTO2 in dilute toluene solution. (c) Fluorescence spectra of the same in toluene solution.
More careful study of the PTZ‐DBTO2 absorption spectrum compared with its D and A fragments reveals a very small “tail” absorption to the red, 400–500 nm region (ε ∼ 100 M−1 cm−1), indicative of a weak n–π* transition, but which is found to be solvent dependent with a weak redshift on increasing solvent polarity, consistent with a mixed n–π*/π–π* transition [19, 39–42] (Figure 12.3). Further, excitation into this very weak band still gives rise to 1CT emission and is thus identified as a direct CT absorption: 1CT ← S0.

Figure 12.3 Absorption of PTZ‐DBTO2 obtained at high concentration (10−3 M) in solvents of increasing polarity (DCB = 1,2‐dichlorobenzene). A weak direct CT absorption is identified at the onset of the main absorption band.
However, the exact nature of this absorption feature is hard to reconcile. Take 2,7‐bis(phenoxazin‐10‐yl)‐9,9‐dimethylthioxanthene‐S,S‐dioxide (DPO‐TXO2) as another example, a D–A–D ICT molecule, again with near‐perpendicular D and A units, but with a more deformed A structure and D with a different heteroatom opposite the bonding N (Figure 12.4). The normalized optical absorption spectra of the A and D units as well as DPO‐TXO2 molecule, measured in dilute methylcyclohexane (MCH), are also shown in Figure 12.4. The inset of Figure 12.4 shows the absorption peak around 390 nm in different solvents. In the DPO‐TXO2 absorption spectrum, the first two absorption peaks (higher energy) match well with a linear combination of the A and D absorption. The third peak, around 390 nm, does not appear in neither the D nor the A absorption spectra and is much stronger when compared with the tail emission seen in PTZ‐DBTO2. This band shows a slight redshift on increasing solvent polarity, which again suggests a n–π*/π–π* mixed‐state transition. We again can assign this peak to the direct 1CT absorption. This is a relatively strong transition confirming a more pronounced π–π* character [41]. The exact nature of these “CT” absorption bands, the degree of state mixing, and the transfer of oscillator strength from A to D or vice versa are as yet not well understood.
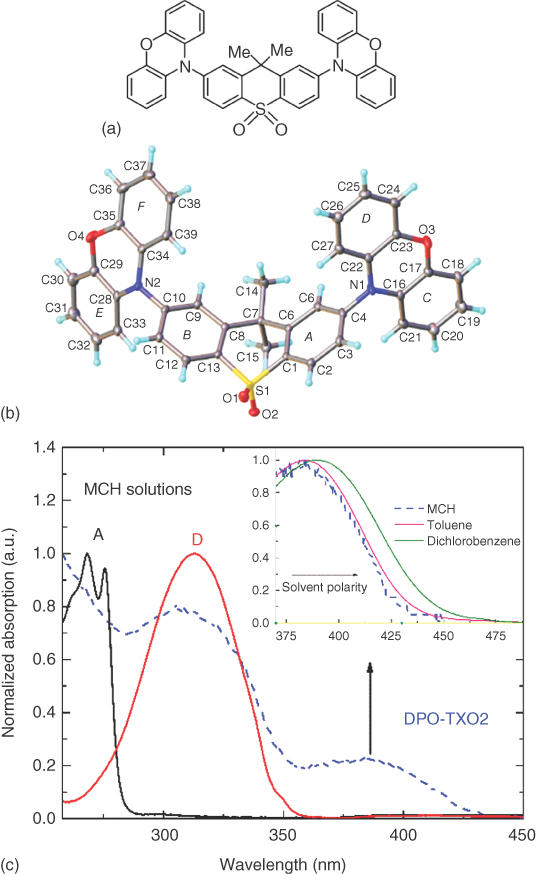
Figure 12.4 (a) and (b): The structure and X‐ray crystal structure of DPO‐TXO2. The optical absorption spectra of the A and D fragments and DPO‐TXO2 molecule, all measured in diluted in methylcyclohexane (MCH). The inset shows the absorption spectra peak around 390 nm of DPO‐TXO2 in different solvents clearly showing the band to redshift with increasing polarity.
It is interesting to note that PTZ‐DBTO2 has more efficient TADF (as defined by the measure DF/PF ratio; see Section 12.5.1) than DPO‐TXO2 and makes much more efficient OLEDs, and correlation between this direct CT absorption band and the efficiency of TADF is not trivial. The reason for this we believe arises from the nature of the wave function of this ground state. Marian [40] has shown that many of the states in these D–A systems have highly mixed n–π* and π–π* character and as such cannot be simply interpreted. More work is required to fully understand these low‐energy low oscillator strength bands in the highly twisted ICT molecules. However, for weaker ICT molecules, we have observed strong competition between planarity and twisted ground‐state configuration as a function of polarity driven by the competition between π conjugation and steric hindrance [42].
As we have seen from the data so far, the emission spectra of the ICT molecules are a broad Gaussian profile, redshifted with respect to the individual D and A fragments. In the systems with large dihedral angle between D and A, the CT excited state is stabilized in all environments, nonpolar as well as polar. This is indicative of strong CT in these systems, that is to say, near full transfer of an electron from D to A. In other ICT systems where the geometric structure is not so well defined, or the CT is weaker, this is not the case, and the CT band is only observed in polar solvents, which help to stabilize the CT. Strong solvatochromism is observed however in all CT bands [34, 43]. In the cases where the CT state is not stabilized in nonpolar solvents or host materials, only local D (or A) emission is observed. This we term 1LE emission arising from the lowest‐energy “local” excited singlet state. Such behavior is exemplified by FASAF, Figure 12.5.
The plots of the emission maxima, νmax, of FASAF as a function of the solvent orientation polarizability parameter (Lippert–Mataga Eq. (12.1) [44, 45]) (Figure 12.5)

Figure 12.5 (a) Chemical structure of FASAF. (b) Solvatochromic shift of the emission spectrum of FASAF in solvents with different orientation polarizability Δf. (c) Solvatochromic shift of the emission maximum, νmax, FASAF against the solvent polarity parameter.
showed a good linear relationship (correlation coefficient of 0.98), with a decrease in the energy of the emission maximum with an increase in Δf, showing that the excited‐state dipole moment is larger [46] for FASAF, compared with its ground‐state dipole moment. Note that no significant differences were found between protic and nonprotic solvents, showing that hydrogen bonding is not responsible for the observable redshift. The Lippert–Mataga plot is also linear with no inflection showing a simple evolution from one state, the 1LE state, given by the well‐structured blue emission in weakly polar solvents, to the 1CT state, highly redshifted Gaussian band in highly polar solvents. The redshift and loss of structure is due to the increasing stabilization of the CT character of the excited state:
As the polarity of the surrounding medium increases, the charge separation increases, and thus the CT character of the excited state increases. Equation (12.2) also explains how one can observe dual fluorescence, i.e. emission from both 1LE and 1CT states at the same time.
The energy of the CT state is given by the following equation to first order:
where ID is the ionization potential of the D, AA the electron affinity of the A, and EC the Coulomb energy term from the charge separation. Thus, as the charges separate further or the charges are screened by the surrounding (polar) environment, Ec increases, and the energy of the CT state decreases, i.e. redshifts. In weak CT states, much of the relaxation process is a “twisting mechanism,” TICT [ 44], assuming that the molecule is capable of internal rotation, leading to a 90° twist between the D and A units in the final equilibrated CT state.
One can study this relaxation mechanism in further detail using temperature. If a rotation about the D–A bond is active in stabilizing the CT state, then it can be frozen out as the solvent freezes and a marked change in the emission should be observed, as is seen in D–A–D molecules where the D and A and bonded through a C–C link [42] (Figure 12.6).

Figure 12.6 Temperature‐dependent emission of DCz‐DBTO2 (structure given) dissolved in ethanol. At room temperature the emission is strongly CT in character. On cooling one observes the onset of dual fluorescence (1LE + 1CT). Upon freezing of the solvent, 1LE emission dominates accompanied by phosphorescence from the 3LE state.
For ICT molecules such as PTZ‐DBTO2, where D and A are bounded through a nitrogen atom, which is already highly twisted in the ground state, we observe stabilization of the CT state even in nonpolar solvents, thus favoring the TICT picture, but with an already ideal molecular structure in the ground state. However, again strong solvatochromism is observed, identifying the role of the polarity shielding the separated charges (Figure 12.7). This is one of the reasons why only the D–A and D–A–D molecules having such a highly twisted ground state give efficient TADF, especially in devices where weakly polar host materials are used.

Figure 12.7 Chemical structure, X‐ray crystal structure, and solvatochromic shift observed in DPTZ‐DBTO2. Strong 1CT emission is observed in nonpolar MCH solution that redshifts with increasing solvent polarity, accompanied by an increasing loss of emission yield.
For these D–A–D twisted molecules, one observes strong CT emission in nonpolar solvents such as MCH, with further redshift of the CT emission in more polar solvents such as toluene and chlorobenzene, as shown in Figure 12.7. Along with this redshift one also observes strong loss in the emission yield. For the typical molecule DPTZ‐DBTO2, as we see from the X‐ray structure having almost perfect orthogonality between D and A units, [47] the increasing polarity cannot further relax the molecule by increasing the twist angle between the D and A units. However, from Eq. (12.3) we see that part of the energy of the CT state is governed by the Coulomb term between the two separated charges and here the solvent polarity acts to shield the charges so that they can separate further on the molecule, increasing the Coulomb energy term and thus reducing the energy of the CT state. This accounts the redshift on increasing polarity in these highly twisted molecules. The loss in emission yield is most probably accounted for by the energy gap law [48], combined with the fact that the lifetime of the more relaxed 1CT state increases and thus competition with internal conversion back to the ground state also increases. We shall return to this observation later.
As we have seen in Figures 12.3 and 12.4, a weak direct CT absorption band is observed on the red edge of the main absorption band of many ICT molecules. Excitation into this band excites the 1CT, the emission from which is readily detected. For DPTZ‐DBTO2 we explored this transition in more detail using highly concentrated solutions, c. 10−2 M. The calculated extinction coefficient for this transition is of order 102 M−1 cm−1. Unlike DPO‐TXO2, this red edge absorption shows weak but measureable blueshift with increasing solvent polarity (Figure 12.8) indicative of a transition with n–π* character. However following Marian [40] we believe it is again a transition having considerable mixed character.

Figure 12.8 Effect of solvent polarity on the red edge, direct CT absorption spectra of DBTZ‐DBTO2. On the left shows the weak red edge absorption band measured at high concentration on a log extinction coefficient scale, as well as the various excitation wavelengths used to obtain the emission spectra shown in Figure 12.9. On the right the absorption data plotted on a linear scale is shown.
Because this red edge band is so weak compared with the neighboring transitions, there is considerable overlap between it and the higher‐lying band associated with the 1LE ← S0 transition. Therefore, it proved necessary to excite very low down in this band to observe the pure nature of the transition. A series of measurements were made exciting at lower energies, as indicated in Figure 12.8, and the emission spectra recorded (Figure 12.9). These were normalized to the absorptivity and excitation power at each excitation wavelength so that the effect on the 1CT emission quantum yield could be observed. In this way we could then probe the mechanistic difference between direct and indirect CT formation. These will be discussed fully in the following section once time‐resolved measurements have been introduced. At this juncture, the main observation, which is rather surprising at first glance, is the fact that exciting the “pure” direct CT absorption leads to a near doubling in the measured emission quantum yield from the 1CT state as compared with excitation via the 1LE state (Figure 12.9).
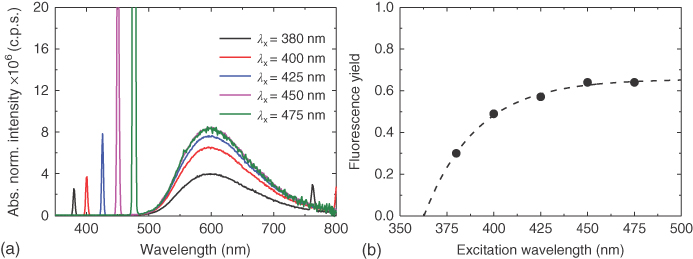
Figure 12.9 (a) Emission spectra of DPTZ‐DBTO2 in toluene with varying excitation wavelengths shown in Figure 12.9. The spikes show the corresponding excitation wavelength. (b) The variation of the DPTZ‐DBTO2 fluorescence yield with excitation wavelength. All measurements at room temperature.
This near doubling of the emission yield is however only observed in the D–A–D molecule, and exciting the D unit through the red edge of its absorption band shows no increase in emission yield, unambiguously showing that this is a phenomenon related to the channel through which the CT state is directly photocreated [47]. This difference we hypothesize is due to the competition between slow electron transfer (ET) from 1LE to 1CT and “fast” ISC from 1LE to 3LE. When exciting directly into the 1CT state, the competition is avoided and subsequently gives a higher emission yield. This result has direct ramifications on device performance. As is well known in an OLED device within the emitter to region, electrons are injected into the LUMO of the emitter and holes into the HOMO. For an ICT molecule this means that the electrons are injected into the acceptor unit, which possesses the lowest‐energy LUMO, and the holes are injected into the donor unit, which has the highest‐energy HOMO. Electrochemical cyclic voltammetry measurements confirm this to be the case for all ICT molecules measured to date [38]. This of course means that the CT state is directly created on charge recombination on the ICT molecule, avoiding the excited donor species, and from our observations above, this implies that the ICT molecule when acting as the emitter in the OLED will have a much higher emission quantum yield than measured in a standard integrating sphere measurement on the sample film. In the case of DPTZ‐DBTO2, this has been directly measured, devices made using this material as the emitter give greater than 19% EQE requiring a photoluminescence quantum yield of the emitter of order 65%, whereas a standard measurement of the photoluminescence quantum yield of DPTZ‐DBTO2 returns a value of 30%, clearly showing that recombination in the device does not form excited donor units but instead directly creates the CT excited state, which as we have seen above then has a photoluminescence quantum yield of the required 65%. This observation gives great insight into the charge recombination and excited‐state formation step within an OLED.
12.4 Phosphorescence and Triplet State Measurements
As seen in Figure 12.6, strong PH can be observed in many ICT molecules, even at RT in some cases [23, 38, 39]. Being able to accurately measure PH from the spectra to extract the energy of the lowest triplet state is one of the most important measurements to make on TADF systems.
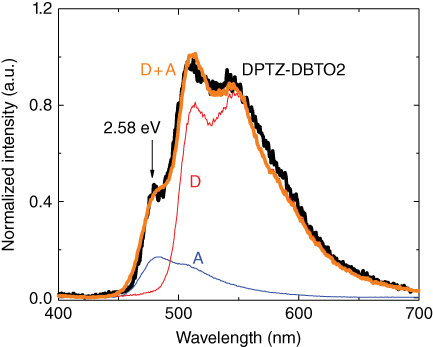
Figure 12.10 Phosphorescence spectra of DPTZ‐DBTO2 (see Figure 12.5) in zeonex at 80 K (black), compared with the phosphorescence of the individual D (red) and A (blue) fragments.
In Figure 12.10 a typical PH spectrum of a D–A–D molecule (DPTZ‐DBTO2) is shown, compared with the PH of the individual D and A units. Sample films were prepared by spin coating with sample–zeonex ratio of (1 : 20 w/w) onto sapphire substrates. Zeonex is a commercial branched polyolefin that is primarily used to make CDs and makes an ideal inert host material with excellent film‐forming properties and optical transparency. The PH spectra are measured using the gated iCCD method, with a delay time between 1 and 10 ms and integration typically 50–100 ms. These measurements are explained further in the next section. Zeonex is also close to MCH in polarity, so a nonpolar host. For DPTZ‐DBTO2 a well‐structured PH emission is observed very close in energy to the 1CT emission. However, on careful inspection, when compared with the PH from its constituent D and A units, it is clear that the DPTZ‐DBTO2 PH is a linear combination of both D and A PH. Again this reflects the electronically decoupled nature of the D and A fragments in the molecule. Moreover, this leads to potential errors in estimating the triplet energy of the molecule. Clearly, the lowest‐energy triplet state of the molecule is the 3LE state of its D fragment and cannot simply be taken from the onset of the PH spectrum. This is a very critical observation dictating that measurements of triplet states in TADF molecules must be made with care and good resolution and be compared with D and A units for completeness. We observe such dual PH in many TADF materials.
One of the most simplest spectroscopic methods for determining the nature of the states involved in the generation of delayed fluorescence in TADF molecules is to use oxygen quenching to quench all triplet states from the system, and from this, one can determine what proportion of the delay fluorescence arises from an excited state, which sometime in its lifetime has been a triplet state [49]. In Figure 12.11 the result for DPTZ‐DBTO2 is shown; this material shows a particularly strong oxygen dependence on its delayed fluorescence. Comparing the integrated fluorescence from degassed and oxygenated solutions, we find a ratio of 12.67, equating to circa 95% of all 1CT excited‐state emission arising through a channel in which the excited state has passed through a triplet state, thus the triplet formation quantum yield, and only 5% of 1CT states emit promptly, i.e. before they have time to cross to the triplet manifold. These experiments require rigorous degassing. Typically we use five freeze–thaw cycles to remove all traces of oxygen from the solution before measurement [47]. Although this experiment clearly shows that the vast majority of delayed fluorescence comes from states that had formal triplet character at some time in its life, it does not tell you which triplet state it was, i.e. CT or local excited, nor how the triplet was originally formed, i.e. 1LE → 3LE or 1CT → 3LE or 1CT → 3CT. This simple experiment is an excellent first step in the identification of potentially efficient TADF molecules. We shall subsequently show that this measurement correlates well with the measured ratio of prompt to delayed emission in time‐resolved spectroscopic measurements where rISC is moderately slow.
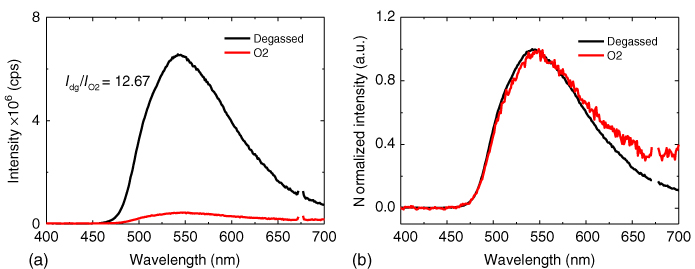
Figure 12.11 (a) A comparison is shown between aerated (red) and degassed (black) steady‐state fluorescence spectra of DPTZ‐DBTO2 in MCH solution at RT. Upon degassing the solution, the integrated fluorescence signal increases by a factor of c. 13. (b) The normalized emissions obtained in aerated and degassed solutions very closely match each other, confirming that the same CT state gives rise to the emission in both cases.
12.5 Characteristics of the Delayed Fluorescence
12.5.1 Time‐resolved Emission in Solution
The evolution of emission from any typical TADF D–A system can be measured using the gated time‐resolved emission measurements as outlined in the experiment section of this chapter [50]. Depending on the absorption spectrum of the molecule to be investigated, we typically use a 355 nm or 337 nm pulsed laser as the excitation source and the gated iCCD detection system. Measurements can be made either in solution or in solid state – solution measurements as a function of temperature are more difficult because of the fact that many solvents do not form stable glass at low temperatures, limiting the temperature range over which the measurements can be made. However, it is very informative to make such time‐resolved measurements on molecules in different solvents of different polarities to see how the various components of emission change as a function of polarity as well as to make the measurement as a function of temperature. To start, a typical set of data for a good TADF material in solution is discussed before going on to solid‐state measurements where the interpretation of the decay curves is a little more involved. For all good TADF materials, the same characteristic decay curves are measured; however the decay times of various different decaying emissions change markedly.
The delayed fluorescence in nonpolar MCH and more polar toluene solutions of DPO‐TXO2, from the early prompt emission (time delay, TD = 1.1 ns) to the end of the DF (TD = 0.14 ms), at different temperatures is shown in Figure 12.12a. DPO‐TXO2 has weak ion pair character in the CT state in nonpolar environments, i.e. the state retains some local excited‐state character [41]. The contribution of triplet excited states to the overall emission was determined by comparing the emission intensity in aerated and degassed solutions. The time‐integrated emission spectra in degassed and nondegassed solutions matched each other, showing that DF and prompt fluorescence come from the same 1CT state. The CT emission intensity in MCH increases by a factor of 3.10 when oxygen is removed, indicating a “through triplet” contribution to delayed fluorescence of 52%.

Figure 12.12 (a) Time‐resolved fluorescence decay of DPO‐TXO2 in MCH solution. The curves were obtained with 355 nm excitation. (b) Time‐resolved normalized emission spectra in the entire region of analyses.
The decay curves for DPO‐TXO2 are rather complex, and prompt and delayed emission regions are not well defined, but the DF emission has clearly higher intensity at high temperatures, indicating TADF. The analyses of the normalized spectra (Figure 12.12b) taken over the entire measurement region show that at c. 1.1 ns (and earlier) the emission spectra observed match that of the 1LED emission of the donor unit. In DPO‐TXO2 it is possible to identify the two types of the donor emission, from separate measurements of the donor unit photophysics [51]: a peak around 375 nm identified in steady‐state measurements as the phenoxazine singlet emission and a dimer emission, peak around 450 nm, that can be seen only in the time‐gated measurements [41]. However, in the ICT molecule, the 1LED is sufficiently quenched by ET that the dimer emission appears as the significant contribution to the very early time prompt emission (first few nanoseconds). This is a rather unique system but highlights the possible complexities these ICT systems can show. Increasing the time delay (TD), the emission spectra progressively shift to longer wavelengths, moving from the 1LED dimer emission to that of stabilized 1CT emission, passing through a region where dual emission is observed, indicating very slow ET, with a typical rate, KET ∼ 108 s−1. This is very common in the highly twisted D–A molecules. At TD = 14.9 ns, the CT emission is clearly observed and has onset at (2.94 ± 0.02) eV. However, the emission shows a slight redshift at very late times, indicating a contribution from donor PH. After TD = 0.8 μs, the PH emission is stabilized with onset at (2.78 ± 0.02) eV and was collected until 0.14 ms. The observed triplet emission could come from the localized triplet state of the donor and/or the acceptor. We measured the PH of the donor and acceptor units separately to identify this behavior. The 3LED PH of the donor unit was found to have onset at (2.79 ± 0.02) eV in toluene solution, corroborating with the PH spectra obtained for DPO‐TXO2 and also with the triplet levels of phenoxazine reported previously in other solvents. [51] The PH spectra of the acceptor unit were found to have onset at (3.39 ± 0.02) eV, higher energy than the PH of DPO‐TXO2. In this way we identify the triplet emission observed in DPO‐TXO2 to come from the donor units. Thus, the 1CT state and the 3LED state were identified in a MCH solution, and the splitting between these states was found to be ΔEST = (0.16 ± 0.03) eV.
The delayed fluorescence in slightly more polar toluene solution was also measured and clearly demonstrates how sensitive the CT state is to environment as the CT state is strongly stabilized (Figure 12.13). The contribution of DF to the overall emission in DPO‐TXO2 was found to be 4.8% or 82% from degassing studies, indicating a much strong ion pair character to the CT state. Figure 12.13a shows the decay curve of DPO‐TXO2 in toluene solution. There is a clear biexponential decay with a fast component of τPF = 24.8 ns, assigned to a prompt fluorescence 1CT component, and a longer decay of τDF = 4.61 μs, assigned to the delayed fluorescence 1CT component. The ratio between IDF and IPF, the intensity integrals of DF and PF regions, respectively, was calculated and found to be ![]() = 4.81, where
= 4.81, where ![]() is emission contribution of TADF. This is in excellent agreement with the value calculated by the degassing test in toluene solution (
is emission contribution of TADF. This is in excellent agreement with the value calculated by the degassing test in toluene solution (![]() = 4.80). From this, the rISC rate constant was determined using Eq. (12.4) and to be 1.04 × 10⁶ s−1 [5]:
= 4.80). From this, the rISC rate constant was determined using Eq. (12.4) and to be 1.04 × 10⁶ s−1 [5]:
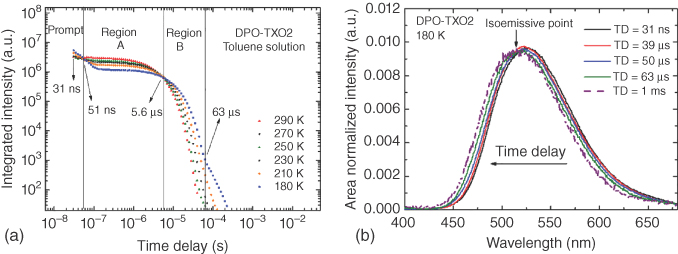
Figure 12.13 (a) Time‐resolved fluorescence decay of DPO‐TXO2 molecules in toluene solution in different temperatures. The curves were obtained with 337 nm excitation and data collected from 31 ns onward. (b) Time‐resolved area normalized emission spectra in the entire region of analyses.

Figure 12.14 Delayed fluorescence spectra of DPO‐TXO2 at different laser excitation doses. Inset graph shows the area of each spectrum as a function of excitation dose. Spectra collected with TD = 100 ns.
The decay curves of DPO‐TXO2 in toluene solution at different temperatures clearly exhibit four distinct regions, delineated by three well‐defined crossing points, i.e. isoemissive points: 51 ns, 5.6 μs, and 63 μs. The decay below 51 ns is dominated by 1CT → S0 prompt fluorescence, and between 51 ns and 63 μs is the 1CT → S0 delayed fluorescence. 3LED → S0 PH is also clearly observed in the region from 63 μs to 1 ms. The isoemissive points show that these are separate well‐defined species that are independent of each other. As a function of temperature, the prompt emission increases in intensity on cooling, and at 180 K the onset of DF occurs at later times, showing increased prompt emission dominating the decreasing DF component as less thermal activation occurs. In region A, the DF emission is clearly observed to increase in intensity with increasing temperature, indicating the thermally activated nature of the DF mechanism. As can also be seen, the DF intensity is nearly time independent, a characteristic of efficient TADF and a dispersion in the rISC rate that gives rise to a more power law decay. [24] Again, this shows the great sensitivity of the rISC rate of each emitter to local environment. The intensity dependence of the DF emission in this region was analyzed as a function of the laser excitation dose, and a linear gradient of 1.045 ± 0.005 was found (Figure 12.14).
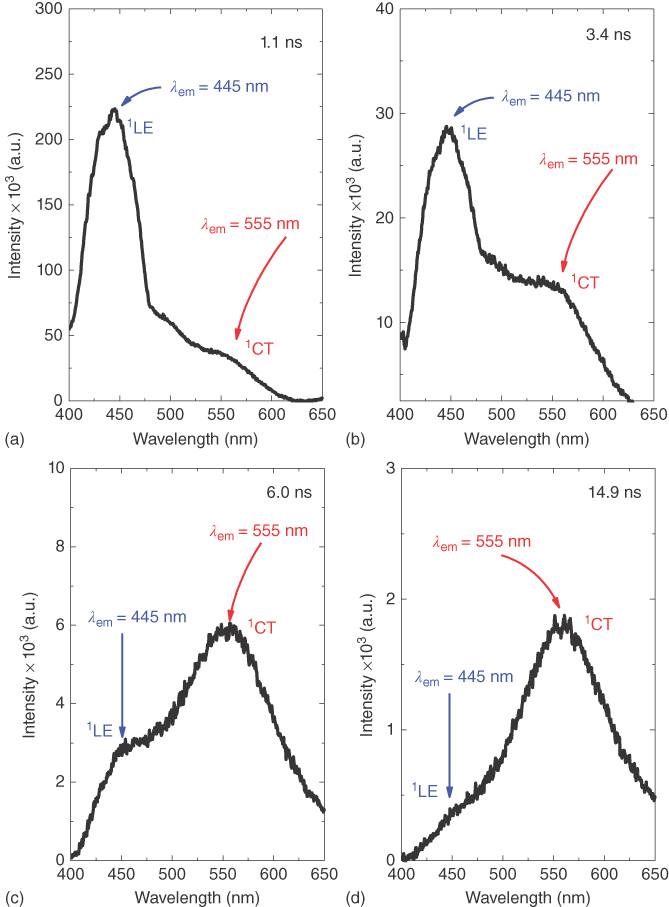
Figure 12.15 Time‐resolved emission spectra of DPTZ‐DBTO2 in CBP host film, obtained over the first 15 ns following excitation. Evolution of the decay of the local donor excited‐state 1LE by electron transfer to form the singlet charge‐transfer excited‐state 1CT at (a) 1.1 ns, (b) 3.4 ns, (c) 6 ns, and (d) 14.9 ns.
This result confirms the thermally assisted mechanism as opposed to TTA and is a very important measurement to make for every material to confirm that the temperature‐dependent DF component is TADF, not TTA or a combination of both [52]. In region B the intensity of the emission increases as the system temperature decreases, mirroring the behavior of the prompt emission. The DF intensity dependence spectra as a function of excitation dose in this region also show a linear gradient (1.025 ± 0.004), confirming that this region also has monomolecular thermally dependent character. The behavior of the temperature dependence in this region is unexpected and can be understood by analyses of the triplet lifetime (τT), given by Eq. (12.5:
where krISC is the rate of the rISC process and kT is the sum of nonradiative (NR) and radiative triplet decays. At high temperature, krISC ≫ kT, and the triplet lifetime is τT. At low temperature, krISC and kT decrease due to their temperature dependence, and consequently, τT increases, making the decay curve of DPO‐TXO2 longer lived, so PH occurs with higher efficiency at longer times where TADF no longer occurs. Hence, we can see a crossing point at TD = 5.6 μs in the decay curves in different temperatures indicating the turning point in this TADF/PH competition. Also, the dielectric constant of toluene slightly increases with decreasing temperature [53]. Hence, at lower temperature, the CT state has slightly lower energy, leading to an increased ΔEST and consequently longer triplet lifetime. Beyond region B the longest‐lived component of the decay curve is observed. This appears just at low temperatures, vanishing at RT, and is assigned to the long‐lived 3LED PH.
Figure 12.13b shows the area normalized emission spectra at 180 K, giving the peak position of each spectrum. From TD = 31 ns to 39 μs, all the spectra have the same position, onset at (2.70 ± 0.02) eV, and same spectral shape. From TD = 39 to 63 μs, a very slight and continuous blueshift is observed, due to the growing contribution of 3LED PH. The prompt and DF emission, to TD = 63 μs, have almost identical spectral shape, showing that both originate from the same singlet excited state, again as one must expect for TADF. After 63 μs the spectra reach an onset at (2.77 ± 0.02) eV, and the same emission was collected until TD = 1 ms. The isoemissive point (labeled on the figures) gives a clear indication for the presence of two excited‐state species, firstly the 1CT state and then a triplet state (3LED). The PH emission has onset very close to that found in MCH solution (2.78 ± 0.02) eV, showing that the PH of the donor does not change in different solvents, as expected for a neutral local excited state. Thus, the 1CT state and the 3LED state are identified in DPO‐TXO2 in toluene solution, and the splitting between these states was found to be ΔEST = (0.07 ± 0.03) eV. Additionally, the activation energy (EA) required for the DF process was calculated from an Arrhenius fit of the temperature‐dependent DF emission intensity and found to be EA = (0.031 ± 0.005) eV. The difference between these two values is rather insightful [54]. From modeling of the rISC process, described in Chapter (Penfold), these two independent measurements actually measure two different properties of the rISC process: The optical one measures the 1CT (fluorescence) 3LE (PH) ΔEST, whereas thermal measurement gives the energy of the main molecular vibration that couples the singlet 3LE and CT states, wherein 31 meV (c. 250 cm−1) is indicative of a torsional rocking mode between the D and A units about the N–C bond.
Comparing both environments, we observed that in toluene solution the contribution of delayed fluorescence is higher than in MCH solution, 82% and 52% respectively. This is a direct consequence of the larger ΔEST in MCH solution. Also, the lifetime of the DF in MCH is clearly longer than in toluene, due to the larger ΔEST, corroborating measurements from other TADF emitters [55]. It is important to notice that the 3LED energy level in MCH and in toluene solutions differs by just (0.01 ± 0.02) eV less than the uncertainty of the measurement, whereas the 1CT energy levels change considerably with solvent polarity, causing a big difference in the energy splitting according to the environment. Therefore, the environment has a strong influence on the ΔEST energy value through the extreme sensitivity of the CT energy to polarity and the very small energy gaps that differentially change as the CT energies change.
One may ask how the situation changes if the energy ordering of the triplet states such that the 3CT state lies below the 3LE state. In this situation dynamic modeling indicates that the mechanism for rISC is still the same and that vibronic coupling between these two triplet states is still required to mediate the spin flip back to the singlet CT manifold [56]. Spectroscopically, the situation is a little different with the 3CT state being the lowest‐energy triplet state, which becomes the reservoir for all triplet excitations. The coupling of the 3CT state to the ground state will be effectively zero given that PH is forbidden between the 3CT and singlet ground state and the electronic coupling between the CT states and the ground state is negligible in these highly twisted molecules. Therefore, one will not observe PH at long times in the decay of the molecule. Instead one will see a much longer DF emission as the triplet excitations slowly reverse intersystem across back to the singlet manifold. Again any dispersion in environment of the system will lead to a dispersion in rISC rates, and the decay of the DF will take on a more power‐like slope as opposed to an exponential decay.
Throughout we have only seen D–A–D systems where it is the donor fragment of the molecule that has the lowest‐energy local singlet and triplet energy levels. This is not a prerequisite, and recently unambiguous spectroscopic data has been presented for a D–A–D system with a rather different accept unit whose singlet and triplet local energy levels are below that of the donor units [57]. Even though it is the acceptor unit that is photoexcited and has the lowest‐energy local triplet state, the photophysics of the D–A–D molecule and the strong TADF that it shows is identical to the other TADF molecules presented here with a donor having the lowest local energy levels.
12.5.2 Time‐resolved Emission in Solid State
Solid‐state measurements here refer mainly to the study of films of an emitter in a host material, either the inert, nonpolar polymer zeonex or as a coevaporated film in a typical OLED host material, not a pure film of the emitter. This avoids self‐quenching issues. The initial emission in the first few nanoseconds after excitation from DPTZ‐DBTO2 in CBP host (Figure 12.15) clearly shows 1LE fluorescence characteristic of the donor phenothiazine unit, as confirmed from the integrated fluorescence spectra of phenothiazine. This decays with an average lifetime of c. 3 ns and is effectively quenched by ET to form the CT state, as seen by the rise of the “prompt” 1CT emission. This shows how slow the ET step is when the D and A fragments are near perpendicular to one another. Compared with other simple DA molecules, the rate of ET in DPTZ‐DBTO2, KET ∼ 108 s−1, estimated from the lifetime of the prompt 1LE emission, is 3–4 orders of magnitude slower than in a molecule free to reorganize its geometry. [58] Because the ET rate is slow, it is in competition with both radiative decay of the initial local excited state and ISC of 1LE to 3LE. Given the time resolution of our iCCD camera is around 1 ns, we cannot always resolve this first ET step. This initial emission is not usually seen in more polar environments.
This early time behavior of DPTZ‐DBTO2 in solvent‐free rigid matrix can be understood from the basic equation governing ET, KET = 4π2/hVDA2 (FCWD) [59, 60], where VDA is the electronic D–A coupling, which is minimized in the ICT molecules having the near orthogonality of the D and A fragments, and the FCWD is the Franck–Condon weighted density of states, the measure of the total spatial overlap of all D and A vibrational modes. In the case where D and A are nearly perpendicular, only out‐of‐plane vibrational modes can thus couple to enable state crossing, also causing the FCWD to be rather small. Thus, in rigid matrix, initial intramolecular ET is extremely slow.
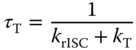
Over the full decay period, lasting into 10's of ms, the decay is very similar to what is observed in solution, except for the added complication of the appearance of PH at longer times (Figure 12.16).
Figure 12.16 A full series of emission decay and time‐resolved spectra obtained at different delay times following the intensity decay curve (left) from (a) 1 ns to (f) 1 ms, for DPTZ‐DBTO2 dispersed in zeonex at RT, showing the complex evolution of the spectral decay components over many decades of time. Clearly, measuring over a limited time window can cause difficulties if interpreting the photophysics of the molecule under investigation.
In a nonpolar zeonex matrix, during the formation of the 1CT state, over the first 10–15 ns, the prompt emission progressively shifts to longer wavelengths (from 512 nm to 560 nm) due to the growing contribution of the 1CT emission (Figure 12.15). The prompt 1CT state (those singlet CT states that never cycle through the triplet manifold) decays with a 30 ns time constant, measured by an exponential fit of the data (Figure 12.16). The delayed fluorescence, also from the 1CT state, as seen from the time‐resolved spectra, decays with a time constant of 1.5 μs, the emission peak being observed at 560 nm up to a delay time of approximately 400 ns. It then progressively shifts back to shorter wavelengths, due to the growing contribution of the underlying 3LE PH. For delay times in the μs time range, the delayed emission maximum is at 540 nm (2.29 eV), and at late times, into the ms time range, the emission peaks at 512 nm, closely matching the peak of the 3LE PH.
The temperature dependence of the DPTZ‐DBTO2 emission decay in nonpolar CBP matrix is given in Figure 12.17. At RT the decay of the emission is very similar to that measured in zeonex because both hosts are similar in polarity and the rISC energy barriers are very similar in both, on the order of 20 meV. From 298 to 220 K, the emission decay appears almost independent of temperature, in line with this small energy barrier. Below 220 K, the 1CT delayed fluorescence is progressively quenched, and at later times, the long‐lived 3LE PH becomes dominant. As the PH is of higher energy than 1CT, this gives rise to a blueshift of emission at later times. In all cases, only the delayed 1CT emission shows thermally activated behavior. These decay curves are typical for all ICT molecules that have a significant TADF contribution.
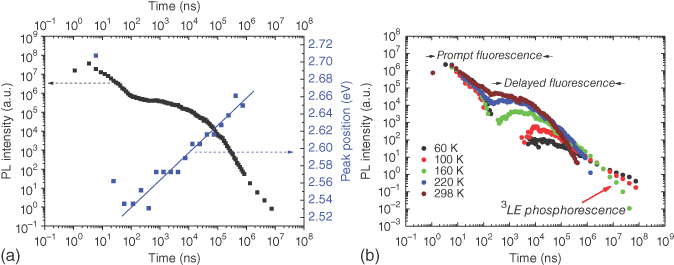
Figure 12.17 (a) Plot of the DPTZ‐DBTO2 emission intensity decay in CBP, obtained at RT with the change in emission peak position also observed as a function of time. (b) Temperature dependence of the DPTZ‐DBTO2 emission decay in CBP matrix clearly identifying that the DF increases strongly with increasing temperature, whereas the PF is unaffected.
The intramolecular TADF origin of the delayed fluorescence observed in DPTZ‐DBTO2 films in zeonex and CBP was again confirmed by the strictly linear dependence of the integrated delayed fluorescence intensity with excitation intensity. Moreover, the temperature dependence of the DPTZ‐DBTO2 delayed fluorescence (Figure 12.17b) shows a pronounced increase of the emission intensity with temperature from 20 to 250 K, but remains practically constant above 250 K, due to the very small 3CT–3LE energy barrier, determined as 0.02 eV.
![Illustrations of time-resolved normalized emission spectra of DDMA-TXO2 in bis[2-(diphenylphosphino)phenyl] ether oxide (DPEPO) matrix at (top) 80 K and (bottom) 290 K.](http://images-20200215.ebookreading.net/4/1/1/9783527339006/9783527339006__highly-efficient-oleds__9783527339006__images__c12f018.jpg)
Figure 12.18 Time‐resolved normalized emission spectra of DDMA‐TXO2 in bis[2‐(diphenylphosphino)phenyl] ether oxide (DPEPO) matrix at (a) 80 K and (b) 290 K. The first 100 ns evolution of the 1CT state and the DF in the millisecond are highlighted.
12.5.3 Kinetics of the 1CT Prompt State
As we have seen, photoexcitation of the local singlet excited‐state 1LE leads on to ET to form the 1CT state within the first few nanoseconds. In a polar host environment, one then observes an energetic relaxation of the 1CT state over the next 50–100 ns. After this time there is no further observable energetic relaxation of 1CT state (Figure 12.18). From close inspection of the measured emission spectra during this first 100 ns, we see a more pronounced loss of the blue edge of the emission band, which we ascribe to dispersion in the lifetimes of 1CT states of different energy. Higher‐energy 1CT states have shorter lifetimes as they have more local exciton character (see Eq. ( 12.2 )), while lower‐energy 1CT states that are more energetically relaxed have longer lifetimes as the excited state has more CT character. Thus, during this initial period, we see the decay of prompt CT states having a dispersion in lifetime. This means that it is difficult to ascribe a single well‐defined energy to the 1CT states. If we assume this dispersion in lifetime arises from an energetic relaxation of the state, then energy of the 1CT state is the energy on initial creation, and so one should measure the CT energy from its emission spectrum at the earliest times.
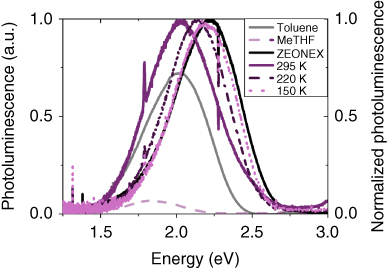
Figure 12.19 Photoluminescence of DPTZ‐DBTO2 in a variety of hosts. The transparent curves of toluene and MeTHF solution (2 × 10⁻⁵ M) correspond to the left scale, and the bold lines (λex = 400 nm) of zeonex and PEO (at 295, 220, and 150 K) correspond to the right scale (λex = 375 nm). The reduction in magnitude for MeTHF is polarity related, while the shift of emission in PEO is related to the glass transition temperature.
12.6 Understanding Which Excited States are Involved
Taking DPTZ‐DBTO2 as our model ICT‐TADF molecule, in nonpolar MCH and zeonex, the CT states lie above 3LE, as we have already seen in Figure 12.10. To investigate what happens to the rISC efficiency as this energy ordering changes, we can make use of the differential polarity dependence of these excited states. 20 μM solutions of DPTZ‐DBTO2 in toluene (ε = 2.38) and 2‐methyltetrahydrofuran (MeTHF) (ε = 6.97) were studied alongside films using zeonex and polyethylene oxide (PEO). Figure 12.19 shows the resulting steady‐state emission spectra at RT. Zeonex has a similar polarity to nonpolar solvents such as MCH (ε = 2.02) and also has a very high glass transition temperature (375 K), meaning that there is no “solvent” reorientation over standard measurement temperatures and the CT energy and the molecular structure of the guest are fixed for all temperatures. Although PEO has a dielectric constant of ε = 5, this polarity is measured at microwave frequencies [61], and at optical frequencies PEO is seen to have a similar polarity to toluene at RT (ε = 2.38). It also has a low glass transition temperature (Tg) of 220 K, much lower than that of zeonex [62], which gives PEO a temperature‐dependent polarity, whereas zeonex is a polarity inert reference. The emission peak of DPTZ‐DBTO2 in toluene and MeTHF is redshifted compared with that in zeonex by 0.2 and 0.4 eV, respectively, in line with the polarity of the solvents. In PEO the emission is at about the same energy as toluene, but DPTZ‐DBTO2 has a higher emission quantum yield probably due to reduced NR quenching in the very viscous polymer host. In MeTHF with high polarity, we see the characteristic high redshift through Coulomb relaxation and strong loss of emission yield as previously described. Also the relative energy splitting between 1CT and 3LE will be large, with 1CT, and by inference 3CT, shifting some 0.3–0.4 eV below 3LE. Such a large energy gap between these states will greatly reduce the efficiency of rISC and thus the contribution of TADF to total emission. For DPTZ‐DBTO2 we have seen that in MCH this accounts for 95% of the total emission!
Using the two polymer hosts enables temperature‐dependent measurements to be made using the key difference between the two polymers, the temperature‐dependent polarity of PEO and its low Tg. By passing through Tg we can restrict vibrational motion of the guest and further affect the energetics of the system.
Figure 12.20 shows how the optical properties of DPTZ‐DBTO2 in PEO change as a function of temperature, especially around the glass transition temperature. The 1CT energy blueshifts as Tg is approached and then stabilizes when the PEO becomes rigid below Tg. With this increase in 1CT energy, the intensity of the emission also increases up to Tg but then reduces at lower temperatures. Given that the energy of the localized 3LE state is little affected by temperature and polarity, energetically this means that the 1CT energy level shifts from below the 3LE state, passing through resonance at about 220 K and then increasing further and stabilizing above the 3LE state at low temperature. The total shift in the 1CT energy onset is from 2.50 to 2.60 eV, which is a large differential shift in terms of the effect it has on the rISC rate, and is directly reflected in the shape of the temperature‐dependent intensity curve.
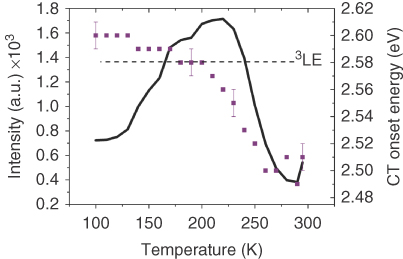
Figure 12.20 The temperature dependence of the intensity (black line) and CT onset energy (purple squares). The change in CT onset energy plateaus below the Tg, representative of the PEO film becoming rigid. The black dashed line represents the energy of the 3LE at 2.58 eV, with the peak in intensity apparent as the CT energy crosses resonance. The error bars are indicative of the error in the fit of 0.01 eV for all points; the same error is expected on the 3LE energy.
This behavior clearly demonstrates and identifies the key role played by the relative energies of the CT and 3LE states on rISC, and hence the TADF efficiency and fully supports the second‐order spin–orbit coupling (SOC) mechanism [54] (Chapter , Penfold) where the 3LE state mediates SOC by vibronic coupling, a more quantum mechanically correct picture of the SOC mechanism in CT systems where direct SOC between 1CT and 3CT is negligible [63, 64]. These results show the critical differences between rISC in an ICT molecule with orthogonal D and A units and simple molecular systems where 1LE and 3LE are energetically close enough to allow weak rISC.
12.7 Excited‐state Properties
So far we have discussed the characterization of excited states that emit light, which does however preclude any understanding of dark states, i.e. those excited states that have very weak or zero radiative decay rates or metastable excited states that decay by nonradioactive transitions to lower‐lying excited states. These dark states can however be characterized optically using the technique of photoinduced absorption (PIA) [65]. The most simple PIA measurement is that of quasi‐steady‐state PIA [66]; here the sample is excited using an electrically modulated (chopped) laser, typically a diode laser at 375 nm, and at the same time an intense white light source is used to probe the sample. After passing the sample the white light passes through a monochromator and is detected using various photodiodes and a lock‐in amplifier. The lock‐in amplifier provides the master oscillator (73 Hz), which electrically modulates the diode laser. Lock‐in detection measures the difference in optical absorption of the sample with and without the laser excitation, at a set wavelength. This gives a normalized measure of the induced absorption, that is, the absorption of the excited state created by the laser excitation normalized to the absolute absorption of the sample at the measured wavelength. Using a scanning monochromator one can then build up an absorption spectrum of the excited states of the molecule and from this identify potentially different excited‐state species that coexist. To aid identification of the different excited states, we again use the D unit of the ICT molecule as a reference. The lock‐in technique also enables signals that are in phase with the chopping frequency and those that are out of phase to be separated; in‐phase is related to species that decay on a timescale faster than the inverse chopping frequency. Here this would be the prompt 1CT emission, for example, and the out‐of‐phase component is generally related to species that live longer than the inverse chopping frequency, such as a triplet state‐induced absorption.
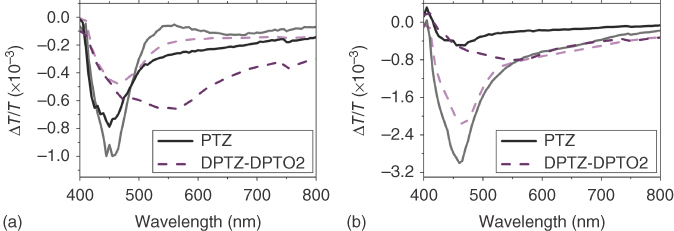
Figure 12.21 (a) The in‐phase component of the PIA of phenothiazine (black line) and DPTZ‐DBTO2 (purple dashes) in a zeonex host matrix, measured at room temperature (bold) and 20 K (transparent). (b) The out‐of‐phase component of the PIA of the same materials. (PTZ = phenothiazine donor unit).
Figure 12.21 shows the PIA for DPTZ‐DBTPO2 and the pure phenothiazine donor unit (PTZ) at RT and 20 K in zeonex. It is apparent, through comparison with the PTZ spectra, that the PIA of DPTZ‐DBTO2 is dominated by the triplet absorption of the local phenothiazine triplet, 3LED, at 20 K [67, 68]. The PIA of the acceptor dibenzothiophene has been reported at higher energies than phenothiazine in the literature [69] and thus not relevant for these spectra. At RT DPTZ‐DBTO2 deviates from the PTZ spectra with the appearance of a broad absorption between 500 and 800 nm. This absorption is attributed to the CT states. A broad band similar to this has been observed in PTZ solution and assigned to solvated electrons, created from absorption of the stabilized phenothiazine radical anion in solution analogous to the CT states here. [67, 68] This broad CT absorption is less prominent at lower temperatures in accordance with the temperature dependence of rISC, and so this low‐energy induced absorption must be dominated by the 1CT state. Thus, the 3LE and 1CT excited states can be differentiated in the D–A–D system. As we use a slow chop, 73 Hz, the 1CT states are the long‐lived states that give rise to DF and thus directly linked to the TADF signal; however it is clear from the out‐of‐phase signal that the 1CT state has a much shorter lifetime than the local triplet, which is as we expect from time‐resolved emission experiments. The residual CT PIA observed out of phase may well arise from a small 3CT population.
We can again use polarity effects in the PIA investigations. DPTZ‐DBTO2 was dissolved in toluene and MeTHF at concentrations of 10 mM (Figure 12.22). The in‐phase spectra show that the CT emission dominates and that in toluene it is stronger than in MeTHF, a result mirrored in the steady‐state PL. However, the out‐of‐phase spectra for both solvent systems are dominated by a broad, long‐lived CT state‐induced absorption. This is attributed to the fact that the energy of the CT states is stabilized in the more polar environments such that they now lie below the 3LE (unaffected by host polarity). The 3CT state now becomes the reservoir for the triplet excitations. This PIA is identified as the 3CT state due to it being dominant in the out‐of‐phase PIA signal, concomitant with it having a much longer lifetime than the emissive 1CT state (in‐phase signal). This shows that the PIA spectra can help to identify the energetic arrangements in the excited states in a TADF system, which gives the first experimental evidence that there is a well‐defined 3CT state.

Figure 12.22 The PIA of DPTZ‐DPTO2 in toluene and MeTHF at concentrations of 10 mM. The in‐phase spectra are the bold lines and the out‐of‐phase spectra the transparent lines. The broad absorption between 500 nm and 1000 nm is related to the 3CT states.
The temperature dependence of the PIA of DPTZ‐DBTO2 was also measured in PEO films (Figure 12.23). The in‐phase component (Figure 12.23a) shows that the intensity of the 1CT emission peaks at around 210–220 K, the Tg, of PEO. The polarity of the PEO decreases with decreasing temperature, causing the 1CT energy to blueshift and close the gap between the CT states and the unaffected 3LED state. The increasing intensity of emission indicates that TADF becomes more efficient because the rISC barrier reduces, which has a more important effect than reducing the amount of thermal energy available to vibronically activate the rISC. Below Tg the system is dominated by the 3LED triplet‐induced absorption, similar to that observed in zeonex. This is attributed to the fact that at lower temperatures the 1CT now lies above the 3LE state and TADF becomes less efficient and there is less thermal activation energy available, so rISC efficiency reduces and the long‐lived triplet states dominate.

Figure 12.23 (a) The in‐phase component of the PIA of DPTZ‐DPTO2 in PEO over a temperature range from 300 K to 20 K. The resonance peak occurs near the Tg at 220 K. (b) The out‐of‐phase component of the PIA of DPTZ‐DPTO2 in PEO. Between 200 and 220 K there is a crossover between triplet dominated and CT dominated absorption, highlighting the resonant point of the system.
In the out‐of‐phase signal (see Figure 12.23b) near Tg, especially 200 K, both triplet absorption and 1CT absorption are seen. This is again due to the polarity of the PEO host bringing the 1CT into resonance with 3LED. At 220 K, the 1CT absorption is the only signal, a result of rISC being extremely efficient so that a large number of triplet states are rapidly recycled into emissive 1CT states. As the temperature is further increased above Tg, the 1CT state moves below the local triplet and rISC efficiency starts to reduce, in line with the reduction in in‐phase emission. These temperature‐dependent effects are not observed in zeonex as it is nonpolar and its Tg is so high that the zeonex is a rigid matrix at all measured temperatures. The reasons why we observe a kind of phase transition around 220 K have not been explored so far, but we assume that once the host matrix becomes “solid,” then the polarity effects weaken as the host cannot rearrange around the ICT molecule to accommodate the changing electron distribution on the ICT molecule [42, 52].
The PIA measurements show that the energy separation between the local triplet state, the 3LE state, and the D–A–D molecule CT states critically controls the efficiency of the TADF process and fully supports the mechanism of rISC where 1LE mediates second‐order SOC. Furthermore, the rigidity of the host and its temperature‐dependent polarity have a major effect on rISC and hence TADF, which could be a crucial consideration in host materials for devices. It also indicates that intramolecular motion of the D–A–D molecule is critical in the TADF process, especially radiative emission. This is further explored in the next section. Three distinct regimes for TADF can thus be identified dependent on the relative energetic positions of the 1CT, 3CT, and 3LE states (Scheme 12.2). From these results it is clear that both careful molecular design and host environment are critical in controlling the efficiency of TADF and both must be correct to achieve the desired type II TADF regime.

Energy level schemes identifying three types of TADF dependent on the relative energy levels of the three key states involved in rISC: 1CT, 3CT, and 3LE.
12.8 Dynamical Processes
As stressed throughout this chapter, one of the most important criteria for an efficient TADF emitter is the near‐perpendicular orientation of the D and A such that they are electrically decoupled in the ground state and strong CT ensues in the excited state. Further, this brings the lowest 3LE state into resonance with both 1CT and 3CT to facilitate a high rate of rISC. We assumed that to enhance the rate of rISC and at the same time further reduce the rate of IC, making the D–A–D molecule as rigidly orthogonal as possible would be a way forward.
A series of sterically hindered D–A–D molecules were synthesized based on the DPTZ‐DBTO2 motif (Figure 12.24) [39]. Using the DPTZ‐DBTO2 building blocks gave us a well‐characterized D–A–D core, and by incorporating addition bulky groups on the 1‐ and/or 9‐positions of the phenothiazine D units, the near orthogonality of each D and A unit was locked in. This strategy was confirmed by NMR measurements were for the bulkiest substituents used; at RT the torsional rocking of the D groups about the C–N bridging bond between each D and A pair was slowed down and could be resolved on the NMR timescale. Only heating the solutions up to 373 K could well‐resolved NMR spectra of a single species be recorded. X‐ray crystal structure determination confirmed near 90o dihedral angles between D and A.

Figure 12.24 Chemical and X‐ray molecular structure of iPr (propyl) substituted DPTZ‐DBTO2, displayed with thermal ellipsoids at 50% probability. Time‐resolved emission decay at 290 K (355 nm excitation) and oxygen‐dependent emission at 290 K in Zeonex (excited at 355 nm). Almost all 1CT emission, prompt and delayed, is absent, but strong room temperature phosphorescence is observed. All measurements at room temperature. An absence of data points in the time‐resolved emission decays indicates signal at the noise flaw of the detector.
From the time‐resolved emission decays, we can see that no 1CT emission can be measured, either prompt or delayed, in these highly sterically hindered D–A–D molecules. Similarly, in the integrated emission, only 1LE and 3LE emission is observed. From this we conclude that excitation into the D 1LE excited state does not then undergo ET to form the 1CT state as seen in the parent DPTZ‐DBTO2 molecule, with a rate kET ∼ 108 s−1. Because of the bulky iPr substituent preventing torsional rocking about the D–A bonds, the rate of ET is slowed from the already slow rate of the parent. ET is then outcompeted by both IC and ISC of the 1LE state back to S0 or 3LE, respectively. Clearly a large D triplet population is created, leading to the strong RT PH that is observed. This also suggests that IC also has a very slow rate. With such a slow ET rate, the coupling between D and A must be extremely weak or negligible, which would also imply that the 1CT would have negligible coupling to the ground state and so very weak radiative decay as well. From the X‐ray structure we see that the D–A dihedral angles are very similar in both the parent and substituted molecules and the major difference between them is the ability to torsionally rock about the D–A bonds in the parent as revealed by the NMR results, i.e. in the substituted cases this motion is greatly slowed down. DPTZ‐DBTO2 shows very strong TADF, whereas the iPR substitution effectively kills all CT formation and emission. Thus we conclude that the dynamic torsional rocking is very important in facilitating both ET and 1CT radiative decay. From our vibronically coupled model of second‐order SOC, we find that both ISC (1CT to either 3CT/3LE) and rISC are controlled by such molecular vibrations, and this added complexity of TADF shows yet another fascinating side of a very complex but highly efficient (in some cases) mechanism.

Figure 12.25 Chemical structure of DDMA‐TXO2 and its 1CT and phosphorescence emission measured in zeonex.
12.9 Emitter–host Interactions
As we have seen in the preceding sections, the critical rISC step that harvests the triplet excitations requires a near degeneracy between one of the local triplet states, 3LE, and both of the CT excited states, 1CT and 3CT. Because the energies of the CT states are very sensitive to environment, whereas the 3LE is more robust, we have seen that it is possible to tune the CT energies in and out of resonance with 3LE using the polarity of the host environment. This fact has a major impact on the efficiency of TADF, and because a TADF emitter has to be codeposited into a (ambipolar) charge transporting host to make an OLED, the polarity of that host will perturb the CT energies of the TADF emitter. Thus, to optimize the TADF efficiency, both the emitter and host must be considered as a combined system. This “host tuning” can be dramatic given that we aim to minimize the 3LE–1CT gap to well below 25 meV. This is readily demonstrated with the blue emitting D–A–D molecule 2,7‐bis(9,9‐dimethyl‐acridin‐10‐yl)‐9,9‐dimethylthioxanthene‐S,S‐dioxide (DDMA‐TXO2) [70, 71] (Figure 12.25).
Through the introduction of the carbon bridge in both the D and A units, the triplet energy of both is increased, as well as the CT energies of the molecule. In nonpolar zeonex the energy splitting between 1CT and 3LE was found to be ΔEST = (0.15 ± 0.03) eV, which is rather large, and one would expect that the material would not be such an efficient TADF emitter.
Time‐resolved emission measured in zeonex shows a characteristic decay curve of a TADF system with a well‐resolved temperature‐dependent DF in the microsecond region, which is quenched by 80 K, indicative of the large ΔEST energy barrier (Figure 12.26). The intensity‐dependent DF curve has a slope of 0.96, and emission is from 1CT from the earliest times until the end of the decay, giving purely TADF, apart from at 80 K when D PH is observed. However codepositing DDMA‐TXO2 in DPEPO, a high triplet host material [72] with higher polarity than zeonex, we observed large changes in the emission decay (Figure 12.26b). We see the onset of the temperature‐dependent DF component at early times and an order of magnitude increase in intensity compared with the prompt CT emission, indicating a faster ISC rate. Moreover, the DF decays much faster, indicating a faster rISC rate as well. At 80 K the DF component is still very strong, indicating that the ΔEST in DPEPO must be smaller in magnitude than in zeonex. The polar nature of the DPEPO host has reduced the CT energy to bring it into resonance with the 3LE state. This is clearly seen in Figure 12.27, where the prompt 1CT emission is seen to be redshift as compared with that in zeonex, the onset now being in resonance with the PH. The EL from a device using DDMA‐TXO2:DPEPO as an emitter layer has onset at the same energy. The EL peak is redshifted, but this was found to be caused by an exciplex emission contribution (610 nm) arising at the interface with the electron‐transport layer.

Figure 12.26 Temperature‐dependent time‐resolved emission decay of DDMA‐TXO2 measured in (a) zeonex and (b) DPEPO.

Figure 12.27 A comparison of the emission of DDMA‐TXO2:DPEPO, prompt 1CT, El, and phosphorescence. The inset depicts the device structure used. On the right is the EQE curve for the device showing better than 22% EQE from the device.
We calculate that the ΔEST in DPEPO is on the order of (0.01 ± 0.03) eV at RT. Such a small energy barrier is the reason why DF is still strongly observed at 80 K and concomitantly yields near 100% triplet harvesting in an OLED with device EQE > 22% in the deep blue. This host tuning of the rISC energy gap confirms the mechanism of rISC that requires the 3LE state to be in near resonance with 1CT and act as intermediary vibronic coupling state with 3CT. Further, one would expect there be a difference in the PLQY of DDMA‐TXO2 in DPEPO if DF contributes much more strongly to the total luminescence signal. Careful O2‐free measurements give PLQY of 0.3 ± 0.03 in zeonex and 0.95 ± 0.03 in DPEPO, clearly verifying the model of rISC described.
It is also clear that this effect has to be taken into account very carefully when optimizing a TADF OLED because of the sensitivity of the rISC rate to the ΔEST energy barrier and the rather small magnitude of kT and RT. Even small induced shifts in the energies of the CT states can be enough to reduce the rISC rate by several orders of magnitude and thus greatly affect the overall TADF efficiency.
12.10 Energy Diagram for TADF
D–A–D ICT molecules that have efficient TADF, as we have seen from the polarity‐dependent measurements and PIA, show a subtle interplay between the relative energy separations of the 1CT, 3CT, and 3LE energy levels, which dictate the absolute efficiency of the rISC rate. From dynamic quantum chemistry studies (Chapter , Penfold), we find that the vibronic coupling mechanism is rather independent of the energy ordering, the rate being dominated by the energy gap between the 3CT and 3LE states that are vibronically coupled. Thus, bearing this in mind, we can give a somewhat generic Jablonski diagram for the TADF process (Scheme 12.3).
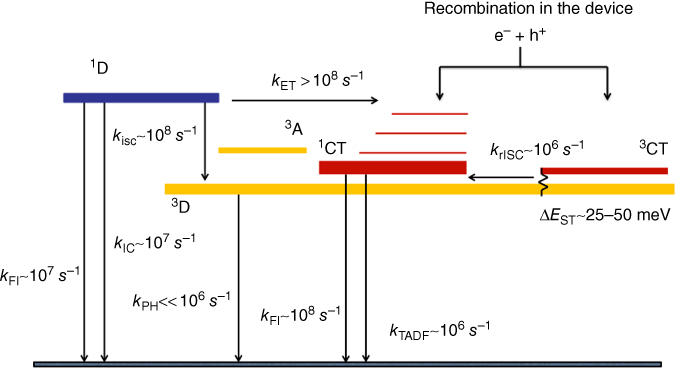
Generic Jablonski diagram for TADF. Optical excitation of the 1D state leads to lower PLQY because of the competition between slow ET and ISC to the 3D state. rISC is mediated through a vibronically coupled 3LE–3CT state. Direct CT formation either by direct CT absorption or charge recombination gives higher PLQY.
12.11 Final Comments
As we have seen throughout this chapter, the key mechanism that underlies rISC and thus the efficiency of TADF is the electronic coupling between 3LE and 3CT that mediates SOC to enable the conversion of triplet to singlet states. The experimental data clearly shows the importance of bringing the 3LE state into resonance with 1CT and hence 3CT; this is a very clear and important difference between our original understanding of TADF where it was envisaged that the gap between 1CT and 3CT was the barrier that controlled rISC and TADF. From this new understanding most of the photophysics of the D–A molecules showing TADF can then be understood. It is also important to understand that we are minimizing the gap between two dislike states, a local excited state and a CT state, and these states behave very differently to their environment. From this, we have shown that the thermal activation gap is readily tuned by environment just as much as molecular structure. It is important to start from a molecule where the donor and acceptor units are near perpendicular to each other and this is controlled by steric effects, so that the CT state is stabilized in any environment and 1CT and 3CT are effectively isoenergetic; this is still an important criterion. Fine‐tuning then comes from the environment in which molecule is coevaporated, for example. However, as we have shown, if we take this to its logical conclusion and synthesize a molecule that is rigidly orthogonal, then the electronic coupling between donor and acceptor becomes so weak that CT is outcompeted by other NR processes, i.e. internal conversion and ISC. This indicates that a certain degree of dynamic torsional rocking is required to both enable efficient ET and subsequent radiative decay of the one CT state. One also has to remember that in a device the creation mechanism of the excited state through charge recombination is different to that of photocreation through photoexcitation of the donor or acceptor unit leading on to CT. As we have shown, when one photogenerates CT states through a direct CT absorption, a strong increase in PLQY is observed by avoiding NR losses, i.e. internal conversion and ISC associated with the initially excited 1LE local state, and in the device we also avoid these losses so that the TADF emitter has an effective higher PLQY than expected. Effective electronic coupling between the CT state and the ground state is still required so that radiative recombination has a faster rate to outcompete the NR decay from the CT state. We now have a new set of guide rules for producing efficient TADF molecules that go much further to explaining how to design and optimize the TADF molecule to work in an efficient OLED. Using this new knowledge we have shown, for example, with DDMA‐TXO2:DPEPO, efficient deep blue TADF OLEDs having EQE > 22% can be demonstrated. With improved device efficiency we hope that improved device lifetime also follows on although this is the next great challenge, but these initial results go a long way to giving the holy grail of the hundred percent efficient red, green, and blue emitters for displays, although as yet it is impossible to say if the technology will go full TADF or mixed blue TADF, red and green phosphorescent, only time will tell.
Acknowledgments
I wish to thank everyone who has contributed to the work described in this chapter; Paloma Lays dos Santos, Heather Higginbotham, Fernando Dias, Marc Etherington, Jose Santos, David Graves, Przemyslaw Data, Roberto Nobuyasu, Hameed Al'Attar, Jonathan Ward, Mark Fox, Andrei Batsanov, and Martin Bryce. I thank the EPSRC and the European Union for funding our work.
References
- 1 Forrest, S.R. (2004). Nature 428: 911.
- 2 Baldo, M.A., O'Brien, D.F., Thompson, M.E., and Forrest, S.R. (1999). Phys. Rev. B: Condens Matter 60: 14422.
- 3 Monkman, A.P., Rothe, C., and King, S.M. (2009). Proc. IEEE 97: 1597.
- 4 Kondakov, D.Y., Pawlik, T.D., Hatwar, T.K., and Spindler, J.P. (2009). J. Appl. Phys. 106: 124510.
- 5 King, S.M., Cass, M., Pintani, M., Coward, C., Dias, F.B., Monkman, A.P., and Roberts, M. (2011). J. Appl. Phys. 109: 074502.
- 6 Adachi, C., Baldo, M.A., Thompson, M.E., and Forrest, S.R. (2001). J. Appl. Phys. 90: 5048.
- 7 Baldo, M.A., Forrest, S.R. and Thompson, M.E. (2005). Organic Electroluminescence (ed. Z.H. Kafafi), 267. CRC Press.
- 8 Sivasubramaniam, V., Brodkorb, F., Hanning, S., Loebl, H.P., van Elsbergen, V., Boerner, H., Scherf, U., and Kreyenschmidt, M. (2009). Cent. Eur. J. Chem 7: 836.
- 9 Sivasubramaniam, V., Brodkorb, F., Hanning, S., Loebl, H.P., van Elsbergen, V., Boerner, H., Scherf, U., and Kreyenschmidt, M. (2009). J. Fluor. Chem. 130: 640.
- 10 Wilkinson, F. and Horrocks, A. (1968). Phosphorescence and delayed fluorescence of organic substances. In: Luminescence in Chemistry (ed. E.J. Bowen), 116–153. London: Van Nostrand.
- 11 Goushi, K., Yoshida, K., Sato, K., and Adachi, C. (2012). Nat. Photonics 6: 253.
- 12 Perrin, F. (1929). Ann. Phys. (Paris) 12: 169.
- 13 Terenin, A.N. (1943). Acta Phys. Chim. USSR 18: 210.
- 14 Lewis, G.N. and Kasha, M. (1944). J. Am. Chem. Soc. 66: 2100.
- 15 Parker, C.A. and Hatchard, C.G. (1961). Trans. Faraday Soc. 57: 1894.
- 16 Jankus, V., Chiang, C.‐J., Dias, F., and Monkman, A.P. (2013). Adv. Mater. 25: 1455.
- 17 Beens, H. and Weller, A. (1968). Acta Phys. Pol. 34: 539.
- 18 Frederichs, B. and Staerk, H. (2008). Chem. Phys. Lett. 460: 116.
- 19 Marian, C.M. (2012). WIREs Comput. Mol. Sci. 2: 187.
- 20 Endo, A., Ogasawara, M., Takahashi, A., Yokoyama, D., Kato, Y., and Adachi, C. (2009). Adv. Mater. 21: 4802.
- 21 Goushi, K. and Adachi, C. (2012). Appl. Phys. Lett. 101: 023306.
- 22 Uoyama, H., Goushi, K., Shizu, K., Nomura, H., and Adachi, C. (2012). Nature 492: 234.
- 23 Dias, F.B., Bourdakos, K.N., Jankus, V., Moss, K.C., Kamtekar, K.T., Bhalla, V., Santos, J., Bryce, M.R., and Monkman, A.P. (2013). Adv. Mater. 25: 3707.
- 24 Graves, D., Jankus, V., Dias, F.B., and Monkman, A. (2014). Adv. Funct. Mater. 24: 2343.
- 25 Jankus, V., Data, P., Graves, D., McGuinness, C., Santos, J., Bryce, M.R., Dias, F.B., and Monkman, A.P. (2014). Adv. Funct. Mater. 24: 6178.
- 26 dos Santos, P.L., Dias, F.B., and Monkman, A.P. (2016). J. Phys. Chem. C 120: 18259.
- 27 Rothe, C., Guentner, R., Scherf, U., and Monkman, A.P. (2001). J. Chem. Phys. 115: 9557.
- 28 Rothe, C. and Monkman, A. (2002). Phys. Rev. B 65: 073201.
- 29 Sinha, S., Rothe, C., Güntner, R., Scherf, U., and Monkman, A.P. (2003). Phys. Rev. Lett. 90: 127402.
- 30 Rothe, C., Pålsson, L.O., and Monkman, A.P. (2002). Chem. Phys. 285: 95.
- 31 Rothe, C., Hintschich, S.I., and Monkman, A.P. (2006). Phys. Rev. Lett. 96: 163601.
- 32 Rothe, C., King, S.M., and Monkman, A.P. (2006). Phys Rev Lett. 97: 076602.
- 33 Aydemir, M., Jankus, V., Dias, F.B., and Monkman, A. (2014). Phys. Chem. Chem. Phys. 16: 21543.
- 34 Dias, F., Pollock, S., Hedley, G., Pålsson, L.-O., Monkman, A., Perepichka, I.I., Perepichka, I.F., Tavasli, M., and Bryce, M.R. (2006). J. Phys. Chem. B 110: 19329.
- 35 King, S.M., Matheson, R., Dias, F.B., and Monkman, A.P. (2008). J. Phys. Chem. B 112: 8010.
- 36 King, S.M., Perepichka, I.I., Perepichka, I.F., Dias, F.B., Bryce, M.R., and Monkman, A.P. (2009). Adv. Funct. Mater. 19: 586.
- 37 Moss, K.C., Bourdakos, K.N., Bhalla, V., Kamtekar, K.T., Bryce, M.R., Fox, M.A., Vaughan, H.L., Dias, F.B., and Monkman, A.P. (2010). J. Org. Chem. 75: 6771.
- 38 Nobuyashu, R.S., Ren, Z., Griffiths, G.C., Batsanov, A.S., Data, P., Yan, S., Monkman, A.P., Bryce, M.R., and Dias, F.B. (2016). Adv. Opt. Mater. 4: 597.
- 39 Ward, J.S., Nobuyasu, R.S., Batsanov, A.S., Data, P., Monkman, A.P., Dias, F.B., and Bryce, M.R. (2016). Chem. Commun. 52: 2612.
- 40 Marian, C.M. (2016). J. Phys. Chem. C 120: 3715.
- 41 dos Santos, P.L., Ward, J.S., Data, P., Batsanov, A.S., Bryce, M.R., Dias, F.B., and Monkman, A.P. (2016). J. Mater. Chem. C 4: 3815.
- 42 Aydemir, M., Haykír, G., Türksoy, F., Gümüş, S., Dias, F.B., and Monkman, A.P. (2015). Phys. Chem. Chem. Phys. 17: 25572.
- 43 Dias, F.B., King, S., Monkman, A.P., Perepichka, I.I., Kryuchkov, M.A., Perepichka, I.F., and Bryce, M.R. (2008). J. Phys. Chem. B 112: 6557.
- 44 Grabowski, Z.R., Rotkiewicz, K., and Rettig, W. (2003). Chem. Rev. 103: 3899.
- 45 Herbich, J. and Kapturkiewicz, A. (1998). J. Am. Chem. Soc. 120: 1014.
- 46 Yoshihara, T., Druzhinin, S.I., Demeter, A., Kocher, N., Stalke, D., and Zachariasse, K.A. (2005). J. Phys. Chem. A 109: 1497.
- 47 Dias, F.B., Santos, J., Graves, D., Data, P., Nobuyasu, R.S., Fox, M.A., Batsanov, A.S., Palmeira, T., Berberan‐Santos, M.N., Bryce, M.R., and Monkman, A.P. (2016). Adv. Sci. 3: doi: 10.1002/advs.201600080.
- 48 Bixon, M., Jortner, J., Cortes, J., Heitele, H., and Michel-Beyerle, M.E. (1994). J. Phys. Chem. 98: 7289.
- 49 Grewer, C. and Brauer, H.‐D. (1994). J. Phys. Chem. 98: 4230.
- 50 Rothe, C., Al Attar, H.A., and Monkman, A.P. (2005). Phys. Rev. B 72: 155330.
- 51 Huber, J.R. and Mantulin, W.W. (1972). J. Am. Chem. Soc. 94: 3755.
- 52 Aydemir, M., Haykır, G., Battal, A., Jankus, V., Sugunan, S.K., Dias, F.B., Al-Attar, H., Türksoy, F., Tavaslı, M., and Monkman, A.P. (2016). Org. Electron. 30: 149.
- 53 Mopsik, F.I. (1969). J. Chem. Phys. 50: 2559.
- 54 Gibson, J., Monkman, A.P., and Penfold, T.J. (2016). ChemPhysChem 17: 2956.
- 55 Lee, J., Shizu, K., Tanaka, H., Nakanotani, H., Yasuda, T., Kaji, H., and Adachi, C. (2015). J Mater Chem C 3: 2175.
- 56 Gibson, J. and Penfold, T.J. (2017). PhysChemChemPhys 19: 8428.
- 57 Data, P., Pander, P., Okazaki, M., Takeda, Y., Minakata, S., and Monkman, A.P. (2016). Angew Chem Int Edit 55: 5739.
- 58 Galievsky, V.A., Druzhinin, S.I., Demeter, A., Mayer, P., Kovalenko, S.A., Senyushkina, T.A., and Zachariasse, K.A. (2010). J. Phys. Chem. A 114: 12622.
- 59 Gould, I.R., Noukakis, D., Gomez‐Jahn, L., Young, R.H., Goodman, J.L., and Farid, S. (1993). Chem. Phys. 176: 439.
- 60 Gould, I.R., Noukakis, D., Gomez‐Jahn, L., Goodman, J.L., and Farid, S. (1993). J. Am. Chem. Soc. 115: 4405.
- 61 Fanggao, C., Saunders, G.A., Lambson, E.F., Hampton, R.N., Carini, G., Di Marco, G., and Lanza, M. (1996). J. Polym. Sci., Part B: Polym. Phys. 34: 425.
- 62 Fontanella, J.J., Wintersgill, M.C., Welcher, P.J., Calame, J.P., and Andeen, C.G. (1985). IEEE Trans. Electr. Insul. 20: 943.
- 63 Lim, B.T., Okajima, S., Chandra, A.K., and Lim, E.C. (1981). Chem. Phys. Lett. 79: 22.
- 64 vanWilligen, H., Jones, G., and Farahat, M.S. (1996). J. Phys. Chem. 100: 3312.
- 65 Etherington, M.K., Gibson, J., Higginbotham, H.F., Penfold, T.J., and Monkman, A.P. (2016). Nat. Commun. 7: 13680.
- 66 Vardeny, Z. and Tauc, J. (1985). Phys. Rev. Lett. 54: 1844.
- 67 Nath, S., Pal, H., Palit, D.K., Sapre, A.V., and Mittal, J.P. (1998). J. Phys. Chem. A 102: 5822.
- 68 Ghosh, H.N., Sapre, A.V., Palit, D.K., and Mittal, J.P. (1997). J. Phys. Chem. B 101: 2315.
- 69 Henry, B.R. and Lawler, E.A. (1974). J. Mol. Spectrosc. 51: 385.
- 70 dos Santos, P.L., Ward, J.S., Bryce, M.R., and Monkman, A.P. (2016). J. Phys. Chem. Lett. 7: 3341.
- 71 Lee, I. and Lee, J.Y. (2016). Org. Electron. 29: 160.
- 72 Han, C.M., Zhao, Y., Xu, H., Chen, J., Deng, Z., Ma, D., Li, Q., and Yan, P. (2011). Chem. Eur. J. 17: 5800.