
3
Key Methodologies in a Holistic Improvement System
“If all you have is a hammer, every problem looks like a nail.”
—Anonymous
As discussed in Chapter 1, “A New Improvement Paradigm Is Needed,” and Chapter 2, “What Is Holistic Improvement?”, Lean Six Sigma 2.0 is based on a holistic approach that incorporates and integrates multiple improvement methodologies. The specific improvement approach to be taken fits the unique aspects of the problem to be addressed. One obvious implication is that such a holistic system needs to have multiple methodologies at its disposal instead of relying on one “best” improvement method—or even two or three. The portfolio of methods needs to be dynamic; new methods are developed over time, and some older methods might no longer be appropriate at a certain point. For these reasons, we do not recommend one “optimal” portfolio of improvement methods. Instead, we advocate including certain logical methods in most organizations’ portfolios, but we think the final set of methods should be unique to the organization.
In this chapter, we briefly review the improvement methods that we feel are logical for most organizations to consider. Obviously, we cannot cover every possible improvement method; we focus instead on the ones we consider core methods. We organize them into the categories explained in Chapter 2: quality by design, breakthrough improvement, and quality and process management systems. Whole books have been written on each of these improvement methods, so we obviously cannot fully do them all justice in a single chapter. If you are not familiar with any of these methods, we recommend following up with the references given at the end of this chapter. Our purpose here is simply to briefly introduce each method and place it in the context of holistic improvement.
We begin with Six Sigma for the following reasons:
![]() It was the focus of the first edition of this book.
It was the focus of the first edition of this book.
![]() It is arguably the most successful improvement method developed to date. Thus, it deserves consideration by any organization that is serious about continuous improvement.
It is arguably the most successful improvement method developed to date. Thus, it deserves consideration by any organization that is serious about continuous improvement.
![]() It is both an overall improvement initiative, with a rigorous set of management systems and procedures (infrastructure), and a type of improvement project.
It is both an overall improvement initiative, with a rigorous set of management systems and procedures (infrastructure), and a type of improvement project.
As Chapter 2 explained, it is important to consider both the overall Six Sigma framework for managing an improvement system and also Six Sigma projects. This is because Six Sigma projects represent only one of several options within the overall improvement system. In our experience, the overall management framework utilized for Six Sigma initiatives is the best system yet seen. Therefore, even though we are expanding the project types, we recommend continuing to use the same Six Sigma management framework for holistic improvement. We explain this more in the next section.
Six Sigma: An Overall Framework and One Option for Improvement Projects
Snee and Hoerl (2003) explained that Six Sigma can be viewed as both an overall management initiative and also a set of methods and tools. In our experience, most readers tend to focus on the latter, a set of tools and project structure. However, the primary reason for the tremendous success of Six Sigma has been its overall management infrastructure, which involves developing formal roles, including Six Sigma in budgets, using project selection systems, conducting formal project reviews, implementing financial tracking systems, and so on. Many earlier improvement approaches, such as Total Quality Management, lacked these management fundamentals (Snee and Hoerl, 2003).
We said in Chapter 2 that we think the overall management infrastructure developed for Six Sigma at major deployments such as Honeywell, GE, and Bank of America, among others, is the best organizational system developed to date for leading and managing improvement. Therefore, although we acknowledge that several other improvement methods are needed within the holistic system, we recommend using the Six Sigma infrastructure for the overall improvement system. Of course, it can be modified and improved. However, beginning with this infrastructure provides a solid starting point for any organization embarking on a holistic improvement initiative. In the remaining chapters, we provide specific guidance on how to do just that.
We now want to turn our focus to Six Sigma as an option for an improvement project. Faced with a defined problem, how can an organization know whether Six Sigma is a good choice for attacking this problem or whether to use Lean, Work-Out, or some other method? As should be clear by now, Six Sigma is not the best approach for all problems. For which is it a likely choice?
First of all, Six Sigma projects are generally of the breakthrough improvement type. They are intended to take a process to a level of performance that it has not seen before. Conversely, Six Sigma is not the best approach for fixing things that are broken; that is problem solving, which fits best under quality and process management systems. We consider Design for Six Sigma (DFSS) projects separately, under quality by design. Additionally, Six Sigma projects can be further classified according to the number of required participants. Green Belt projects typically can be completed by one person; Black Belt projects, on the other hand, generally require a cross-functional team. In this section, we focus on the more common Black Belt projects.
The main structure for a Six Sigma project is Define, Measure, Analyze, Improve, Control (DMAIC). This overall approach gives practitioners a plan of attack for virtually any Six Sigma project, including ones involving finance, healthcare, or other nonmanufacturing projects. Figure 3.1, from Snee and Hoerl (2003), shows the purpose of each step, the main deliverables (what each step is attempting to produce), and some sample tools used. Of course, every project is unique; no “cookie cutter” approach will always be appropriate. Therefore, the tools in Figure 3.1 should be viewed as typical but not always the most appropriate.
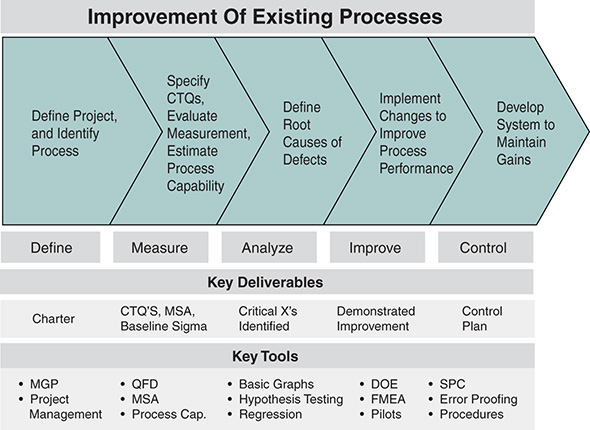
Figure 3.1 The DMAIC methodology and key tools
A closer examination of these steps and tools reveals some attributes of projects that are well suited to a Six Sigma approach:
![]() A process already exists.
A process already exists.
![]() The problem has no known solution; we need to obtain data to identify and address root causes.
The problem has no known solution; we need to obtain data to identify and address root causes.
![]() The project is complex enough that it requires significant time to generate breakthrough improvement. In our experience, typical Six Sigma projects take roughly three to six months to complete.
The project is complex enough that it requires significant time to generate breakthrough improvement. In our experience, typical Six Sigma projects take roughly three to six months to complete.
![]() A multidisciplined team is required to successfully complete the project.
A multidisciplined team is required to successfully complete the project.
Conversely, many projects do not possess these attributes and thus are not suitable for a Six Sigma approach. For example, design projects do not have an existing process. In many Lean projects, we already know what to do (provide line of sight to the process, for example); we just have to figure out exactly how to do that. Additionally, for routine problem solving, we are rarely willing to wait three to six months for a solution.
Much more can and has been written about Six Sigma projects; see, for example, Harry and Schroeder (2000), Snee and Hoerl (2003), Jones (2004), and Snee and Hoerl (2005). Our assumption is that readers are generally familiar with Six Sigma, so we have provided only a brief overview. These references deliver more detail if desired.
Quality by Design Approaches
As we noted in Chapter 2, quality by design is the element of the holistic improvement system in which new products, processes, and initiatives are identified and implemented. The importance of designing quality into products and services instead of trying to fix issues later has been well known for some time (Juran and DeFeo, 2010). The U.S. pharmaceutical industry, in particular, has made quality by design a major emphasis within the process of rolling out new drugs (Snee, 2016).
Use of Six Sigma projects is not as appropriate here because there is no existing process to study and improve. However, when we have an identified business, product, or process opportunity, Design for Six Sigma (DFSS) projects can be deployed to bring them to market. Before getting to DFSS, of course, we must identify the opportunity. As Hoerl and Gardner (2010) explain, methods quite different from DFSS are required to identify and prioritize such opportunities. In Chapter 2, we classified them under the general category of innovation and creativity. All improvement methods require some amount of these attributes, but they clearly merit a front-and-center focus when identifying new opportunities. Snee (2016) provides a more detailed discussion of quality by design, the methodologies typically applied, and how it fits into an overall quality system.
Innovation and Creativity
As explained by Xu et al. (2006), before designing a new product or process, organizations must go through an idea generation process to identify opportunities, come up with potential ideas for capturing them, and prioritize those ideas. This process is typically based on business strategy, as well as customer and competitive intelligence. Drucker (2006) provides significant practical guidance on driving innovation and fostering entrepreneurship within an organization. However, aside from formal marketing research methods and knowledge-based tools for prioritization, such as interrelationship digraphs and multivoting (Brassard, 1996), few formal, analytical tools exist for conducting such work. This is one reason innovation is so challenging and not done well by many organizations.
Despite the limited number of formal tools, we incorporate innovation and creativity in the holistic improvement system because this is a critically needed element. As we stated in Chapter 1, Birkinshaw and Gibson (2004) have noted that organizations that want to succeed in the long term must become ambidextrous—that is, they must be able to both innovate and optimize the efficiency of existing operations. Doing one or the other well is no longer sufficient to ensure organizational success. Fortunately, after identifying and prioritizing ideas, formal approaches such as DFSS and TRIZ can be applied to produce conceptual and, eventually, detailed designs.
Design for Six Sigma (DFSS)
At this point, we are ready to consider how to actually bring to fruition a new opportunity. DFSS can be very effective at this point in the innovation cycle. Early in its Six Sigma journey, GE noticed that applying the DMAIC process to new product, service, or process design efforts was usually a forced fit. For example, when attempting to measure the process, there was no existing process on which to take measurements. After struggling with this issue for some time, GE finally developed a Design for Six Sigma process using the DMADV approach. This approach borrowed heavily from ongoing design efforts at Honeywell and other organizations (Hahn et al., 2000).
Figure 3.2, analogous to Figure 3.1 for DMAIC projects, highlights the purpose, objectives, and sample tools in each phase of DMADV projects. Note that the Define phase is similar in both approaches: It is intended to develop an overall project charter to provide structure and guide the project. The Measure phase in DMADV is quite different: In this case, the team needs to determine what to measure and rigorously define the critical to quality variables (CTQs). In the case of DMADV, typically several CTQs will exist. During design, we do not have the luxury of focusing on only one CTQ; we must identify all of them.
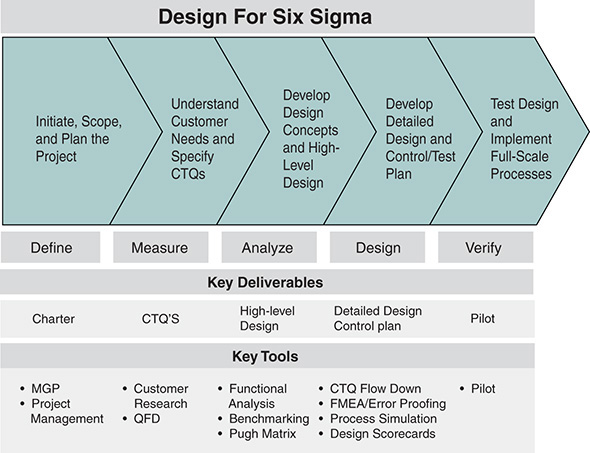
Figure 3.2 The DMADV methodology and key tools
The Analyze phase is perhaps the most different from DMAIC because there is no data on the process to analyze. At this point, the team analyzes the CTQs and considers how to best achieve them, ideally with a novel approach. This leads to a focus on conceptual design that is significantly better than current options. This focus is called conceptual design because no hardware or physical process might yet exist—it could be just a concept. Assuming that the concept appears to deliver a significant advantage, perhaps through developing and evaluating a prototype, the team can move on to the Design phase. In the Design phase, the details are added to the concept to create a detailed design. As the old saying goes, “The devil is in the details.” This tends to be the most time-consuming phase of DMADV projects.
Once a detailed design has been developed, it needs to be verified before commercial release. The intent is to rigorously evaluate the design under realistic (as opposed to ideal) conditions. Even if a prototype performed very well in a laboratory environment, a more stressful test is needed. For example, a design involving a new IT system would not be verified by professional computer scientists at night with a quiet network. Instead, it would be verified by typical end users during peak hours for network traffic. Only if the system performed well under these realistic conditions could the organization be confident that it would ultimately be successful in practice.
Clearly, typical DFSS projects require more time than DMAIC projects. The team needs to develop an entire product and process from scratch while considering all CTQs. However, if the charter indicates that this is likely to take more than a year to complete, a helpful strategy is to break the overall design project into several subprojects, using an approach called multigenerational planning (MGP). Note that MGP is listed as a key tool in the Define stage in Figure 3.2. For further details on DFSS, Creveling et al. (2002) is a classic reference; Neagu and Hoerl (2005) provide a novel application of the DMADV process to finance.
Quality Function Deployment (QFD)
Quality Function Deployment (QFD) has been used for decades to design new products and services based on customer needs (King, 1989). In fact, it has been integrated into DMAIC and DMADV Six Sigma projects, as shown in Figures 3.1 and 3.2. However, Six Sigma projects that have used QFD have typically borrowed only parts of the overall process. Many practitioners thus do not realize that QFD is an extensive, multistep methodology in its own right.
Many versions of QFD are used in practice, but its standard four-step approach is useful. This approach creates a series of matrices that map customer needs, often in raw and unstructured form (for example, “I want a knowledgeable sales rep”) first to rigorous metrics and eventually to process parameters to help manage the process (Hoerl, 2008). The four matrices, called houses of quality, sequentially translate higher-level information to lower-level information:
![]() From fuzzy customer needs to measureable quality metrics
From fuzzy customer needs to measureable quality metrics
![]() From quality metrics to process functional requirements
From quality metrics to process functional requirements
![]() From functional requirements to process steps
From functional requirements to process steps
![]() From process steps to process control measures
From process steps to process control measures
Each of these translations uses a matrix with a house structure, hence the term house of quality. Figure 3.3 shows House 1, which translates customer needs for small bank loans into measureable quality metrics (Hoerl, 2008). Note that the customer needs are written on the left side of the matrix. Potential tangible measures are written across the top. The team then fills in the interior of the matrix using its subject matter knowledge, indicating how strongly the team believes each metric is related to each customer need. For example, in this case, the team felt that measuring the actual loan amount divided by the requested loan amount would show a strong relationship to the customers’ perception of easy access to capital. The bull’s-eye indicates a strong relationship, the open circle represents a moderate relationship, and the triangle represents a weak relationship. A blank indicates a minimal relationship or no relationship.

Figure 3.3 Small business loan house of quality
The matrix can be quantified by assigning a numerical priority score to each customer need (on the right side of the matrix) and then assigning a numerical value to each symbol (typically 9, 3, 1 for strong, moderate, and weak, respectively). To see the importance of the metric actual loan/requested loan, we go down the matrix, multiply each symbol’s value by the need priority score, and then add the numbers to obtain a total. In this case, that would be: 9 × 4.8 + 3 × 4.3 = 56. Doing the same for all metrics, we obtain a relative importance for each metric.
The far-right “room” of the house shows a potential comparison of how customers rate their current satisfaction of these needs from our bank relative to the competition. The bottom room shows targets that the team has set for the metrics, relative to how competition is performing. The “roof” of the house shows how the metrics might correlate with one another, to determine which targets are reasonable and achievable.
As Figure 3.3 shows, a house of quality from a QFD contains valuable information that is useful in design projects. Typically, this first house is included in Six Sigma projects. As noted, however, completing the second, third, and fourth houses in a formal QFD exercise provides an overall integrated approach to product and process design, including process control measures. See Akao (2004) for a more complete reference on QFD.
Theory of Inventive Problem Solving (TRIZ)
TRIZ, also known as the theory of inventive problem solving, is a rigorous methodology for resolving contradictions, primarily in conceptual design. The acronym comes from a transliteration of the Russian letters for theory of inventive problem solving. As explained by Altshuller (1996), the method has Russian origins. The underpinnings of the method involve a couple critical assumptions. The first is that design will always involve contradictions or trade-offs. However, true innovation occurs when we seek to “have our cake and eat it, too”—that is, to creatively identify a novel solution that resolves the contradiction and allows us to obtain all attributes desired in the design.
As a trivial example, consider the design of a new commercial aircraft. Airlines want a plane to have excellent fuel economy, to minimize costs. At the same time, however, they want a large interior, to make room for more passengers. Of course, large interiors and fuel economy present a contradiction: A large plane generally has poor fuel economy, whereas a plane with great fuel economy tends to be small. At first glance, most designers would pick one attribute or the other, depending on which was considered the most important. However, suppose that we designed the plane with a novel metal alloy that had outstanding strength and also was extremely light? Might we be able to design an aircraft with both a large interior and also excellent fuel economy? In this simple case, refusing to accept the contradiction might lead to true innovation.
The second major assumption is that someone, somewhere in the world, has probably struggled with the same type of contradiction we are currently struggling with. The specific application might differ, but someone might have also struggled with size versus fuel economy—perhaps with a car, for example. Therefore, if we can identify and catalog the major contradictions seen in the design world and determine how they have been resolved, we would have an excellent resource for resolving our own contradiction. Various catalogs have been developed, in both matrix and schematic form. See, for example, Hua et al. (2006), and the references at the end of this chapter.
Additional Breakthrough Improvement Methods
As discussed previously, quality by design is the point at which we identify, evaluate, develop, and refine new business opportunities, new products, and new processes. This phase is critical because it is difficult to improve a poorly designed process to the point of true excellence. Six Sigma uses the term entitlement to refer to the maximum level of performance designed into a process (Harry and Schroeder, 2000). It is entitlement in the sense that management is entitled to this level of performance; management has paid for this quality level in the original design.
Unfortunately, the vast majority of processes perform well below their entitlement (Snee and Hoerl, 2003). In many cases, the designed performance is never achieved; in others, the process performs well initially but settles for suboptimal performance over time because of wear and tear, misuse, operator error, and so on. At that point, improvement methods for achieving new levels of performance are needed. As noted, this might mean finding new levels of performance that have never been achieved or making a dramatic improvement back to performance levels that have not been seen in some time.
The key point is that breakthrough improvement is not problem solving; it is not fixing something that is broken. We are not simply returning a broken system to normal; we are taking it to new levels. This is not to imply that problem solving is bad. If oil starts leaking on the floor at 3:00 AM, we need to fix the leak immediately, not launch a Six Sigma project. However, doing so just returns things to normal—it does not take us to a higher level of performance. We cover managing processes with excellence to avoid or quickly solve problems in our discussion of quality and process management systems.
Note that we have already discussed Six Sigma as an improvement method, as well as an overall framework for our holistic improvement system. Therefore, we do not discuss Six Sigma further here. Additionally, the quick-hit projects often referred to as Nike projects (Just Do It!) do not follow a formal methodology, so we do not examine Nike project methodology.
Lean Enterprise
Lean Enterprise, originally known as Lean Manufacturing, has its roots in the Toyota Production System (Monden, 2012). Lean Enterprise can be defined in many ways, although Womack and Jones (2003), who wrote one of the classic texts on Lean, emphasize Lean as an approach to eliminate waste of any type, such as excess floor space, excess inventory, excess work in progress, wasted capital, wasted effort, and wasted time. The overall approach to eliminating waste seeks to clearly identify the value that is being created, line up all activities that produce this value along a value stream, and then make the flow of the value stream a pull system instead of a push system. A pull system is one in which production is pulled, or initiated by customer orders; conversely, in a push system, products are produced as rapidly as possible and the organization attempts to push the product now in inventory to potential customers.
Womack and Jones (2003) identify five key principles of Lean:
![]() Specify value by specific product
Specify value by specific product
![]() Identify the value stream for each product
Identify the value stream for each product
![]() Make value flow without interruptions
Make value flow without interruptions
![]() Let the customer pull value from the producer
Let the customer pull value from the producer
![]() Pursue perfection
Pursue perfection
Although its roots are in manufacturing, Lean principles have been applied to such diverse areas as banking, healthcare, and education, producing Lean Enterprise. As noted earlier, George (2002) was an early proponent of the integration of Lean and Six Sigma, to create Lean Six Sigma.
In our experience, the greatest successes of Lean have typically involved improving the flow of materials and information. This includes push versus pull systems, a reduction in inventory and work in progress through Just in Time instead of Just in Case approaches, and so on. In other words, this is Lean’s sweet spot (Hoerl and Snee, 2013). Specifically, we have found that Lean projects are particularly useful in these applications:
![]() Factory and production line layout
Factory and production line layout
![]() Work station design
Work station design
![]() Waste reduction
Waste reduction
![]() Cycle time reduction
Cycle time reduction
![]() Work in progress (WIP) and inventory reduction
Work in progress (WIP) and inventory reduction
Another key Lean approach is the Kaizen event or rapid improvement project, often used to accomplish the tasks just noted. In a Kaizen event, a process is torn apart and reassembled with a more efficient flow, typically over three days or less (George, 2002).
Table 3.1 includes some of the most common tools used in Lean Enterprise projects (Womack and Jones, 2003). It should be clear that most of these tools are not statistical in nature. In particular, Lean tends to focus on a broad application of proven principles of efficiency and waste reduction instead of data analytics or cause/effect to identify root causes. Therefore, Lean tends to work best for “solution known” problems (Hoerl and Snee, 2013).
Table 3.1 Common Tools Applied on Lean Enterprise Projects
Common Tools |
Description |
Process mapping (value stream maps) |
Depicts the creation of value |
5S method (sort, set in order, shine, standardize, sustain) |
Creates a clean, structured work space |
Work standardization |
Reduces variation in how work is done |
Line balancing |
Reduces variation in production lines |
U-shaped work cell |
Minimizes the need for human movement |
Single-minute exchange of dies (SMED) |
Reduces time required to switch products |
Poka-yoke (mistake proofing) |
Avoids mistakes before they occur |
Kanban (Just in Time) |
Minimizes in-process inventory |
Statistical Engineering
In Chapter 1, we described growing awareness of the importance of addressing large, complex, unstructured problems, such as the Millennium Development Goals. Typically, problem-solving methodologies are oriented toward well-defined problems that are medium to small in size. Therefore, a unique approach is needed when facing complex problems, especially those that are not well structured. The challenge in developing a model to predict corporate defaults in finance (discussed in Chapter 1), is one such example. As noted in Hoerl and Snee (2017), there was no generally accepted definition of the word default, no agreed-upon metrics to measure success, and, in fact, no data available on which to build the model. Furthermore, economic theory suggested that developing such a model was not feasible. Clearly, this problem was large, complex, and unstructured.
Obviously, no “7-step” method can easily resolve such problems. Even more rigorous methods such as Six Sigma are not well suited to complex problems that require more time and the integration of novel methods. Statistical engineering (Hoerl and Snee, 2010) has been proposed as an overall approach to developing a strategy to attack such problems. Statistical engineering is defined as “the study of how to best utilize statistical concepts, methods and tools, and integrate them with information technology and other relevant disciplines, to achieve enhanced results” (Hoerl and Snee, 2010, p. 12). Note that statistical engineering is not an improvement methodology, per se, such as Lean or Six Sigma, but rather a discipline. This is why it is defined as “the study of” something rather than the use of specific tools in a specific way.
This definition also emphasizes integration: the integration of multiple tools and also multiple disciplines, especially information technology. As we discuss shortly, the availability of large data sets has grown exponentially in the past few decades. The capability to acquire, store, retrieve, and analyze this data for improvement purposes has become critical to the competitive position of most organizations. Therefore, information technology is often a key element of statistical engineering applications. Other disciplines, such as various branches of engineering, economics, and operations research, might also be key, depending on the nature of the particular problem being addressed.
The underlying theory of statistical engineering incorporates an overall framework for attacking large, complex, unstructured problems (DiBenedetto et al., 2014). This framework was shown in Chapter 1 and is repeated here as Figure 3.4. Note that this framework illustrates the phases that statistical engineering projects typically go through; these are not well-defined steps with specific methods applied, as in DMAIC or DMADV projects. Recall that statistical engineering is a discipline instead of a methodology; although this framework provides a generic approach to attacking large, complex, unstructured problems, it is not a step-by-step approach.

Figure 3.4 Statistical engineering framework for attacking large, complex, unstructured problems
Note that these types of complex problems are often not recognized as problems that quantitative methods can address. Issues such as poverty, gender-based violence, and corporate culture are too often accepted as “just the way things are,” without recognizing that even such large and complex problems can often be addressed to some degree with the right approach. Therefore, significant effort typically is required to identify such opportunities and incorporate them into a project selection system. Without proactive effort to identify and “tee up” the problem, it will likely continue from year to year, with no organized attempt to address it.
After the problem is identified, it needs to be structured. By definition, these types of problems come unstructured. In other words, the specific problem to be solved, as well as its measures of success, is not obvious. Consider the case of an attempt to modify the culture at a research institute from a pure R&D mind-set to more of an industrial research lab culture—that is, one focused on solving the specific problems the organization faces instead of conducting research for the sake of advancing science. What is the specific objective of the project? How would we know if we succeeded? What are the measures of success? These questions have no obvious answers here, unlike in other areas, such as when attempting to reduce waste in a factory.
After the problem is structured, a thorough evaluation of the background of the problem and its history is generally required to develop a viable solution. We refer to this background as the context of the problem. Such large problems have defied solution over the years, for a reason: Simple solutions have not proven effective. Having a thorough understanding of where the problem came from, the factors reinforcing its continuation (such as politics and personalities), why it has defied solution, and what has been tried before is critical to success. Only when we thoroughly understand the context can we develop a plan of attack. Obviously, all problems require some degree of knowledge of root causes and context. However, for large, complex, unstructured problems, the roots are deeper and more complicated.
A tailored strategy then can be developed to address a given problem. This strategy typically involves multiple steps and multiple methodologies because of the complexities of these types of problems. No “cookie cutter” strategy or textbook solution works here; creative thought needs to help identify the best approach. A multistep strategy generally incorporates numerous tactics or specific elements.
In the default prediction case study, some of the individual tactics involved in the overall strategy were identifying an effective data smoothing algorithm, developing a mapping from default probability and its slope to tangible actions to be taken (buy, sell, and so on), and deriving a monitoring scheme that uses censored data techniques to detect when the system needs to be retuned (Neagu and Hoerl, 2005). This last tactic helped ensure the sustainability of the solution, which is a critical element of any improvement approach.
For further examples of statistical engineering applications, see Anderson-Cook and Lu (2012). This reference is a special edition of the journal Quality Engineering that is devoted to statistical engineering; it includes several case studies and applications.
Big Data Analytics
Data is being collected at an ever-increasing pace, through social media, online transactions, and scientific research. According to IBM, 1.6 zetabytes (1021 bytes) of digital data are now available. That’s a lot of data—enough to watch high-definition TV for 47,000 years (Ebbers, 2013). Hardware, software, and statistical technologies to process, store, and analyze this data deluge have also advanced, creating new opportunities for analytics. Although many definitions of the word analytics could be used, we define analytics as quantitative methods used to discover meaningful information in data. This somewhat generic definition avoids debate over what is statistics versus applied math, machine learning, data science, and so on, which is not our focus.
Many new modeling methods (spanning statistics, machine learning, and computer science) have been developed in the past 30 or so years to take advantage of these large amounts of data. Methods such as neural networks, classification and regression trees (CART), and support vector machines (SVM) are now commonly used. Recently, ensemble methods that resample the data and integrate multiple models into an overall grand model have become more popular (James et al., 2013). These approaches include random forests and boosting methods, among others. Because they resample the data, take multiple paths, and include highly nonlinear fitting, these methods are computationally intensive. However, such computing is practical with recent advances in computing power. Note that such tools are much more sophisticated than those typically utilized in Six Sigma projects.
Many businesses, academic institutions, and even the U.S. government have made major investments in Big Data analytics (National Research Council, 2009). FICO (Fiar, Isaac, and Company) is perhaps the earliest example of an analytics-based business model; it was founded in 1956 to provide analytics for credit scoring. A more recent example is Google, whose search engine is perhaps the greatest success story of analytics today: Google has a market capitalization of more than half a trillion dollars as of this writing.
Interestingly, most Big Data analytics organizations tend to operate as standalone silos, without any connection to other groups that are working on improvement (Snee and Hoerl, 2017). This obviously inhibits their involvement in the major improvement efforts of the company, to the detriment of all. In our view, a much more logical approach is to assimilate groups performing Big Data analytics into the improvement organization, thereby integrating this important new methodology with other important improvement approaches. Such a synergistic relationship is likely to produce greater benefit than having each group work in isolation. Too often, such isolation results in unhealthy internal competition, as discussed in Chapter 1.
In addition, the emphasis on massive data sets by Amazon, Google, and similar organizations often masks the importance of smaller but more carefully selected data sets, such as those obtained through designed experiments. In our experience, large data sets that are retrospective in nature, not designed, can suggest hypotheses through abnormal patterns in the data. However, randomized experiments are needed to test these hypotheses and evaluate causation versus correlation (De Veaux et al., 2016). In essence, we obtain the best results when we consider all data (big, small, and intermediate) to solve the problem. See Hoerl et al. (2014) for further discussion of the impact of Big Data analytics, and see James et al. (2013) for rigorous elaboration of the methods themselves.
Work-Out Approach
GE CEO Jack Welch developed Work-Out in the late 1980s as a unique approach to improvement in the workplace (Elrich et al., 2002). He had recently built the Crotonville leadership development center and was delighted with the open atmosphere there that encouraged business leaders to share both their ideas and their concerns about issues facing GE. However, Welch remained frustrated that he didn’t sense a similar environment elsewhere in the GE businesses. In too many places, he saw a bureaucracy filled with controlling leaders who pretended to have all the answers and stifled workers who were afraid to open up and share their true feelings.
Realizing that he couldn’t bring all GE employees to Crotonville, Welch decided to take Crotonville to all the employees. He created a process that mimicked what he experienced in Crotonville and could be replicated around the world. Perhaps due to his Massachusetts roots, Welch decided to model the process after a New England town meeting. This consisted of a group of typically 40 to 60 people, facilitated by someone outside of GE (originally, local college professors) to ensure that people felt free to speak openly. The fact that the participants’ managers were not invited to the Work-Out was critical. The facilitator defined the scope of the issue being addressed and then got people to share their ideas and frustrations about it. Welch (2001) notes that, at some of these meetings, people shared such passionate feelings that they began to swear at each other. However, they also moved past the bureaucracy to the core issues, which often involved unnecessary reports and meetings that got in the way of serving customers. Much of the focus was, and still is, on eliminating non-value-adding work.
The Work-Out sessions were a big success and eventually grew to involve hundreds of thousands of GE employees. Not only did they produce tangible results, but they also helped people feel empowered after some difficult years of downsizing in the company. They created an atmosphere in which employees worked across global and organizational boundaries for the benefit of GE as a whole, with good ideas respected regardless of the rank, gender, age, or ethnicity of the person submitting the idea.
So what are the essential elements of Work-Out that make it a unique aspect of a holistic improvement system? It was founded on the following core principles:
![]() An open environment in which people are free to speak their mind without fear of retribution by management
An open environment in which people are free to speak their mind without fear of retribution by management
![]() Enlistment of the front-line workers, who are most familiar with the issue at hand, instead of a panel of experts
Enlistment of the front-line workers, who are most familiar with the issue at hand, instead of a panel of experts
![]() Use of impartial facilitators instead of management leaders to conduct the meetings
Use of impartial facilitators instead of management leaders to conduct the meetings
![]() Short interactions (two to three days) and immediate decisions by management for at least 75 percent of the team suggestions—no burying the proposals by sending them to committees for “further study”
Short interactions (two to three days) and immediate decisions by management for at least 75 percent of the team suggestions—no burying the proposals by sending them to committees for “further study”
![]() An emphasis on busting bureaucracy, eliminating unnecessary meetings, reports, approvals, and so on
An emphasis on busting bureaucracy, eliminating unnecessary meetings, reports, approvals, and so on
Clearly, the Work-Out approach is not the best method for solving every problem that can occur within an organization. Complex technical problems will require more sophisticated data-based approaches, such as Six Sigma. Based on our experience, Work-Out is best suited to problems with the following attributes (Hoerl, 2008):
![]() We believe that a relatively simple solution exists that will not require extensive data collection and analysis to find.
We believe that a relatively simple solution exists that will not require extensive data collection and analysis to find.
![]() We believe that the people working within the process have knowledge of potential solutions (a “solution known” problem).
We believe that the people working within the process have knowledge of potential solutions (a “solution known” problem).
![]() We believe that the wisdom of good solutions will be readily apparent to those working within the process, minimizing the need for a test period to evaluate the solution.
We believe that the wisdom of good solutions will be readily apparent to those working within the process, minimizing the need for a test period to evaluate the solution.
As of this writing, Work-Out is still utilized at GE and other companies. See Elrich et al. (2002) or Welch (2001) for more details on the background, objectives, and process of Work-Out.
Quality and Process Management Systems
Innovation and breakthrough improvement might be considered the offensive aspects of improvement: We score points and move the ball down the field. However, an old saying in sports holds true here as well: Offense sells tickets, but defense wins championships. The point, of course, is that although identifying new opportunities and making significant improvements to existing processes is critical, so is maintaining excellence in the ongoing management of existing operations. It is far better to avoid issues rather than have to launch project teams to resolve issues after they occur. Most organizations with long-standing reputations for excellence have outstanding systems for quality and process management. The Toyota Production System, which has institutionalized many of the principles of Lean Enterprise, is one obvious example.
Just as specific methods must be used for innovation and breakthrough improvement, we need specific methods to manage the overall quality of products and services, as well as the processes that produce them. Different methods are more appropriate for specific organizations facing specific challenges; no single approach is universally superior. In this section, we briefly discuss several proven approaches that we feel organizations should seriously consider.
ISO 9000
ISO 9000 is a series of standards for quality and process management that are widely utilized on a global basis. Many organizations in the European Union require certification to ISO 9001, the main standard of the series, as a condition of doing business. The most recent version as of this writing is ISO 9001-2015, which is the 2015 update. The standard itself is produced and updated by the International Organization for Standardization (www.iso.org), but approved third parties generally perform the actual certification to 9001.
ISO 9001 provides some guidance on effective quality management, but at its core, it requires organizations to carefully document their quality and process management procedures and then verify that they actually follow them. For this reason, some critics consider ISO 9001 as “minimally adequate.” The more recent updates, such as 9001-2015, place greater emphasis on documentation of results. According to the ISO website, more than a million organizations in 170 countries are certified to ISO 9001 as of this writing.
Figure 3.5 provides an overall model for quality management systems, based on the 2015 version of the standard itself. Numbers 4–10 refer to the sections of the standard in which these topics are discussed.

Figure 3.5 ISO 9000 2015 model of a process-based quality management system
Although ISO 9001 is not prescriptive in terms of the specific methods to deploy, it highlights the critical areas organizations must incorporate into their quality systems. Table 3.2 lists the key principles of ISO 9001. It should be obvious that ISO 9001 is a much more holistic approach to quality and process management than Six Sigma, which is project based. However, as shown by Snee and Hoerl (2003), Six Sigma in consistent with and reinforces the key principles of ISO 9000.
Table 3.2 Key Principles of ISO 9001
Principle |
Description |
Customer focus |
Customers ultimately determine our success or failure. |
Involvement of people |
All employees should help drive improvement. |
Process orientation |
All work occurs through processes that can be improved. |
System approach to management |
We must ensure that we are improving the overall system. |
Continual improvement |
Improvement is an assignment we will never complete. |
Factual approach to decision making |
Data and the scientific method trump “gut feel.” |
Mutually beneficial supplier relationships |
We work with suppliers to improve the system for everyone. |
Malcolm Baldrige National Quality Award
The Malcolm Baldrige National Quality Award (MBNQA) is a competitive quality award established by the U.S. Congress in 1987 and overseen by the National Institute of Standards and Technology (NIST). It is also the basis for several state quality awards. MBNQA winners receive their awards annually from the President of the United States. Multiple winners are named each year because there are separate awards for different types of organizations. The award categories follow:
![]() Manufacturing
Manufacturing
![]() Service companies
Service companies
![]() Small businesses
Small businesses
![]() Education
Education
![]() Healthcare
Healthcare
![]() Nonprofit
Nonprofit
The Baldrige criteria for performance excellence are broken down into seven categories, shown in Table 3.3 (http://asq.org/learn-about-quality/malcolm-baldrige-award/overview/overview.html). A comparison of Tables 3.2 and 3.3 clearly reveals overlap between ISO 9001 and MBNQA. However, it should be noted that although ISO 9001 is a standard to which any number of organizations might be certified, MBNQA is competitive and typically names only one winner in each category per year. Furthermore, MBNQA places greater emphasis on results.
It should also be pointed out that organizations often use the MBNQA criteria as a template for developing a holistic quality and process management system without ever actually applying for the award. That is, the benefit of MBNQA is not limited to winning an award. In fact, the criteria listed in Table 3.3 can be used simply to identify opportunities for improvement. In this way, MBNQA ties directly into breakthrough improvement. As we have noted, the three major components of the holistic improvement system should be well integrated instead of acting as three independent silos.
Table 3.3 Baldrige Criteria for Performance Excellence
Criteria |
Description |
Leadership |
How upper management leads the organization, and how the organization leads within the community. |
Strategy |
How the organization establishes and plans to implement strategic directions. |
Customers |
How the organization builds and maintains strong, lasting relationships with customers. |
Measurement, Analysis & Knowledge Management |
How the organization uses data to support key processes and manage performance. |
Workforce |
How the organization empowers and involves its workforce. |
Operations |
How the organization designs, manages, and improves key processes. |
Results |
How the organization performs in terms of customer satisfaction, finances, human resources, supplier and partner performance, operations, governance, and social responsibility; and how the organization compares to its competitors. |
We believe that, depending on the nature of the organization in question, either ISO 9001 or the MBNQA criteria can be considered a guide to develop and evaluate an overall quality and process management system. No individual tool or method will sufficiently address quality and process management excellence; therefore, organizations need to think strategically about how to approach the development and evaluation of their overall system. In our opinion, ISO 9001 and MBNQA can provide invaluable help in doing so.
Kepner—Tregoe Approach
Problem solving has been recognized as a critical skill in numerous disciplines for decades, if not centuries. However, formal research on the best approaches to problem solving is limited (DiBenedetto et al., 2014). In this context, we use the term problem solving to refer to the identification and correction of the root causes of issues that have occurred. This differs from process improvement, which is intended to move to new levels of performance. Instead, problem solving fixes things that are broken, returning performance to the normal level. Both process improvement and problem solving are needed in a holistic improvement system.
One of the most formal approaches to problem solving that we have seen produce significant results comes from Kepner and Tregoe (2013). The Kepner–Tregoe approach, often referred to as “Is–Is Not analysis,” is a rigorous approach to carefully documenting an issue so that root causes, rather than symptoms, can be addressed. Specifically, it notes when, where, and how an issue has been observed, as well as when, where, and how it has not been observed but could have been. By comparing where the problem is and where it is not, we can obtain clues to the root causes of the problem. For example, if a manufacturing problem occurred on line 3 but not on lines 1 and 2, we know that the root cause must be related to uniqueness of line 3 relative to lines 1 and 2.
As a preliminary step, we must carefully describe the problem under study; this defines the what. Next, we ask about the where. Where, specifically, have we observed the problem? And what about the when? Depending on the nature of the problem, we might also ask about the who, the people involved. We may also need to know the how (that is, the mode of failure) or the why (if potential root causes are known). Once we have established these parameters for where the problem is, we can ask these same questions about where the problem is not. For example, if the problem involved some type of contaminated product, what other issues would we have expected to occur with a contaminated product that did not occur? Did it not occur in certain regions, with certain versions of the product, or at other times? Collectively, that information would give us clues to the root causes of the problem.
A case study in Hoerl and Snee (2012) applied Is–Is Not analysis to late deliveries in a distribution process. Figure 3.6 shows the information that resulted from that analysis. In this case, careful consideration of exactly when the problem occurred and where it did and did not occur provided important clues to root causes. These led to potential explanations or theories on the root cause of the problem. The potential explanations lead to specific actions that can be taken to follow up and verify the potential causes. This approach and the specific questions involved might seem simplistic, but our experience is that carefully documenting the answers facilitates a quick evaluation of theories on potential root causes. No matter how passionately someone champions a theory, if it is not consistent with the facts, we need to move on to other theories.

Figure 3.6 Is–Is Not analysis of late deliveries
This approach is obviously intended for “solution unknown” problems because it searches for root causes. Also, our experience has shown that it is not an effective approach to process improvement because no specific problem might have occurred. We might have always had this level of performance, for example, but it is no longer acceptable and now needs to be improved. For problem solving, on the other hand, something clearly has gone wrong. This approach then can be very effective in identifying root causes for the problem. See Kepner and Tregoe (2013) for further details on this methodology.
Total Productive Maintenance (TPM)
Total Productive Maintenance (TPM) is a formal approach to optimizing maintenance of plant and equipment, to achieve the maximum possible productivity at the lowest possible cost (https://en.wikipedia.org/wiki/Total_productive_maintenance). Historically, maintenance in manufacturing organizations was performed only after equipment failed, as so-called breakdown maintenance. Gradually, organizations realized that this was an expensive approach. Not only does it permit severe damage to the equipment, but it also can involve hours or days of lost productivity while trying to repair the broken equipment.
Organizations gradually learned that preventative maintenance was a preferable approach. Replacement of parts or materials at fixed intervals, such as replacing motor oil in a car after 5,000 miles, is one approach to planned maintenance. Fixed-time replacement was often much less expensive in the long run and reduced unplanned outages. However, it still results in money left on the table, in the sense that some parts or materials are thrown out at a specific interval and not necessarily when they actually need to be replaced.
The next advance was a more sophisticated approach of predictive maintenance. In this approach, measurements on the equipment are tracked regularly to determine how close the equipment is to failure (assuming that this can be predicted). For example, most automobile manufacturers today do not recommend replacing the oil at fixed intervals; instead, they use sensors to take internal measurements of the oil itself and then use analytics to predict when the oil needs to be replaced to avoid problems. Depending on how and where the car is driven, the oil might need to be replaced before 5,000 miles, or perhaps not until 6,000 or 7,000 miles.
A unique aspect of the TPM approach is to analytically evaluate both the ability to predict failure and the consequences, to determine an optimal overall maintenance strategy. For example, breakdown maintenance might still be the best strategy for replacing light bulbs in an office. Fixed-time replacement, or installing sensors to evaluate the status of the bulb in real time, is not likely cost-effective. However, for major mechanical systems, a predictive approach is better. See Borris (2006) or Prabhuswamy et al. (2013) for further details on TPM.
The Internet of Things
The so-called Internet of Things (IoT) is not a methodology, but rather a building block of effective quality and process management. IoT refers to connecting physical devices via the Internet. For example, most modern aircraft currently have thousands of sensors monitoring various aspects of the engine and airplane in general, such as exhaust gas temperatures, emissions and cabin air quality. Furthermore, the computers on these planes are connected in real time via satellite with tracking stations of the airline or a service organization. Therefore, someone (or computers) in the United States or Europe can be tracking flights between Johannesburg and Singapore, and perhaps notifying the ground crews in Singapore of specific maintenance that will be needed when the plane arrives.
The connection of physical devices via the Internet, often without direct human intervention, has significant implications. The concept of “smart cities” that can direct traffic from congested roads to open roads, manage water and electrical resources in real time, and reduce carbon footprints is based on IoT (Marr, 2015). Its potential is virtually limitless. Some people fear that IoT could usher in a science fiction scenario of robots taking over the world, but the truth is, to a significant degree IoT is already here.
For our purposes, IoT is not a what, but rather a how. That is, we are focused not on IoT, per se, but rather on how the connection of physical devices might enable more efficient quality and process management systems. For example, we would view smart cities as a case in which IoT enables more efficient and effective process management than has ever been seen in government. We believe the same opportunities exist in the private sector. In the case of TPM, discussed previously, IoT is largely enabled by the physical plant and equipment in which sensors take data in real time and are connected to other computers and devices.
Our main point is that organizations seeking world-class quality and process management need to make sure their physical assets are connected and communicating in real time. Big Data Analytics also ties directly into IoT because analytics are necessary to make effective use of the data being transmitted. A holistic approach to improvement encourages the integration of multiple methodologies on given initiatives and projects. See Chui et al. (2010) for further details on IoT.
Summary and Looking Forward
Chapter 2 showed what a holistic improvement system might look like, using diverse methodologies from three major categories:
![]() Quality by design: The identification and development of new business opportunities, products, and process
Quality by design: The identification and development of new business opportunities, products, and process
![]() Breakthrough improvement: Performance taken to new levels not previously seen
Breakthrough improvement: Performance taken to new levels not previously seen
![]() Quality and process management systems: The proactive work done to ensure process excellence
Quality and process management systems: The proactive work done to ensure process excellence
This chapter dug a little more deeply into these categories and identified some of the individual methodologies that organizations might consider as part of their holistic improvement system. We want to again emphasize that these are only some of the methods that fit into each category; this is not a complete list. Other methods are available, and might need to be considered for specific problems. Furthermore, the list of methods should be dynamic; additional methods will surely be developed in the future.
A question that begs asking is, can any organization actually successfully implement each of these methods? Probably not! However, some organizations have implemented several of them, resulting in a more holistic improvement system than is typically seen. These organizations have made significant progress toward Lean Six Sigma 2.0. In Chapter 4, “Case Studies in Holistic Improvement,” we share the stories of a few of these organizations. In subsequent chapters, we explain how organizations can go about putting the necessary systems in place to create a successful holistic improvement system tailored to the organization.
References
Akao, Y. (2004) Quality Function Deployment: Integrating Customer Requirements into Product Design. New York: Taylor and Francis.
Altshuller, G. (1996) And Suddenly the Inventor Appeared, 2nd ed. Worcester, MA: Technical Innovation Center.
Anderson-Cook, C. M., and L. Lu., guest editors. (2012) Special Issue on Statistical Engineering. Quality Engineering 24, no. 2.
Birkinshaw, J. and C. Gibson. (2004) “Building Ambidexterity into an Organization.” MIT Sloan Management Review 45, no. 4: 47–55.
Borris, S. (2006) Total Productive Maintenance. New York: McGraw-Hill.
Brassard, M. (1996) The Memory Jogger Plus+. Salem, NH: GOAL/QPC.
Chui, M., M. Loffler, and R. Roberts. (2010) “The Internet of Things.” The McKinsey Quarterly (March). Available at http://www.mckinsey.com/industries/high-tech/our-insights/the-internet-of-things.
Creveling, C. M., J. L. Slutsky, and D. Antis. (2002) Design for Six Sigma in Technology and Product Development. Upper Saddle River, NJ: Prentice Hall.
De Veaux, R. D., R. W. Hoerl, and R. D. Snee. (2016) “Big Data and the Missing Links.” Statistical Analysis and Data Mining 9, no. 6: 411–416.
DiBenedetto, A., R. W. Hoerl, and R. D. Snee. (2014) “Solving Jigsaw Puzzles.” Quality Progress (June): 50–53.
Drucker, P. F. (2006) Innovation and Entrepreneurship. New York: HarperBusiness.
Ebbers, M. (2013) “5 Things to Know About Big Data in Motion.” IBM developerWorks blog. Available at www.ibm.com/developerworks/community/blogs/5things/entry/5_things_to_know_about_big_data_in_motion?lang=en.
Elrich, D., S. Kerr, and R. Ashkenas. (2002) The GE Work-Out: How to Implement GE’s Revolutionary Method for Busting Bureaucracy and Attacking Organizational Problems—Fast!. New York: McGraw-Hill.
George, M. L. (2002) Lean Six Sigma: Combining Six Sigma Quality with Lean Production Speed. New York: McGraw-Hill.
Hahn, G. J., N. Doganaksoy, and R. W. Hoerl. (2000) “The Evolution of Six Sigma.” Quality Engineering 12, no. 3: 317–326.
Harry, M., and R. Schroeder. (2000) Six Sigma: The Breakthrough Management Strategy Revolutionizing the World’s Top Corporations. New York: Currency Doubleday.
Hoerl, R. (2008) “Work-out.” In Encyclopedia of Statistics in Quality and Reliability, edited by F. Ruggeri, R. Kenett, and F. W. Faltin, 2103–2105. Chichester, UK: John Wiley & Sons.
Hoerl, R. W., and M. M. Gardner. (2010) “Lean Six Sigma, Creativity, and Innovation.” International Journal of Lean Six Sigma 1, no. 1: 30–38.
Hoerl, R. W., and R. D. Snee. (2010) “Moving the Statistics Profession Forward to the Next Level.” The American Statistician 64, no. 1: 10–14.
Hoerl, R. W., and R. D. Snee. (2012) Statistical Thinking: Improving Business Performance, 2nd ed. Hoboken, NJ: John Wiley and Sons.
Hoerl, R. W., and R. D. Snee. (2013) “One Size Does Not Fit All: Identifying the Right Improvement Methodology.” Quality Progress (May 2013): 48–50.
Hoerl, R. W., and R. D. Snee. (2017) “Statistical Engineering: An Idea Whose Time Has Come.” The American Statistician, To Be Published.
Hoerl, R. W., R. D. Snee, and R. D. De Veaux. (2014) “Applying Statistical Thinking to ‘Big Data’ Problems.” Wiley Interdisciplinary Reviews: Computational Statistics (July/August): 221–232. (doi: 10.1002/wics.1306)
Hua, Z., J. Yang, S. Coulibaly, and B. Zhang. (2006) “Integration of TRIZ with Problem Solving Tools: A Literature Review from 1995 to 2006.” International Journal of Business Innovation and Research 1, no. 2: 111–128.
James, G., D. Witten, T. Hastie, and R. Tibshirani. (2013) An Introduction to Statistical Learning. New York: Springer.
Jones, M. H. (2004) “Six Sigma … at a Bank?” Six Sigma Forum Magazine (February): 13–17.
Juran, J. M., and J. A. DeFeo. (2010) Juran’s Quality Handbook: The Complete Guide to Performance Excellence, 6th ed. New York: McGraw-Hill.
Kepner, C. H., and B. B. Tregoe. (2013) The New Rational Manager. New York: McGraw-Hill.
King, B. (1989) Better Designs in Half the Time, 3rd ed. Salem, NH: GOAL/QPC.
Marr, B. (2015) “How Big Data and the Internet of Things Creates Smarter Cities.” Forbes Online (May 19). Available at https://www.forbes.com/sites/bernardmarr/2015/05/19/how-big-data-and-the-internet-of-things-create-smarter-cities/#2f3da1e21767.
Monden, Y. (2012) Toyota Production System: An Integrated Approach to Just-In-Time, 4th ed. Boca Raton, FL: CRC Press.
National Research Council. (2009) Frontiers in Massive Data Analysis. Washington, DC: The National Academies Press.
Neagu, R., and R. W. Hoerl. (2005) “A Six Sigma Approach to Predicting Corporate Defaults.” Quality and Reliability Engineering International 21: 293–309.
Prabhuswamy, M., P. Nagesh, and K. Ravikumar. (2013) “Statistical Analysis and Reliability Estimation of Total Productive Maintenance.” IUP Journal of Operations Management XII 1 (February): 7–20.
Snee, R. D. (2016) “Adjust, Adapt, Advance: An Enhanced Version of Quality by Design—A Risk Based Dynamic Approach to Improving Products and Processes.” Quality Progress (May): 34–41.
Snee, R. D., and R. W. Hoerl. (2003) Leading Six Sigma: A Step-by-Step Guide Based on Experience with GE and Other Six Sigma Companies. Upper Saddle River, NJ: Financial Times/Prentice Hall.
Snee, R. D., and R. W. Hoerl. (2005) Six Sigma Beyond the Factory Floor; Deployment Strategies for Financial Services, Health Care, and the Rest of the Real Economy. Upper Saddle River, NJ: Financial Times/ Prentice Hall.
Snee, R., and R. W. Hoerl. (2017) “Time for Lean Six Sigma 2.0?” Quality Progress (May): 50–53.
Welch, J. (2001) Jack: Straight from the Gut. New York: Warner Books.
Womack, J. P., and D. T. Jones. (2003) Lean Thinking. New York: Free Press.
Xu, K., C. Sikdar, and M. M. Gardner. (2006) “Six Sigma Roles in Innovation.” Paper presented at the IEEE International Conference on Management of Innovation and Technology, Singapore.