
10
Final Thoughts for Leaders
“The ability to learn faster than your competitors may be the only sustainable competitive advantage.”
—Arie DeGeus, Royal Dutch Shell
In this final chapter, we discuss three issues that are particularly important to leaders: understanding and using the individual methods and tools, ensuring that the project succeeds, and ensuring that the overall initiative succeeds.
Our discussion of how leaders should think about the methods and tools is not intended as a technical reference, since this is not the primary need for leaders. Instead, it is motivated by our belief that the continuous improvement literature has provided conflicting advice on what level of knowledge, understanding, and competency leaders need to have with the methods and tools the organization is deploying. Our goal is to clarify leaders’ responsibilities in that area.
First, we should explain our terminology. When we use the word method, we refer to an overall improvement approach, such as Six Sigma, Lean, or Work-Out. Conversely, when we use the word tool, we refer to a specific technique, perhaps one of many within an overall method. For example, control charting is a specific tool used in Six Sigma, and value stream mapping is a specific tool used in Lean.
Some publications seem to indicate that leaders need to become mini-statisticians and make themselves experts in every tool within Lean Six Sigma. Other articles give the impression that no familiarity with tools is needed at all because leaders can delegate the technical details of methods to others, such as Master Black Belts (MBBs) or Black Belts. The actual truth lies somewhere in between.
First, we provide a case study of a Six Sigma DMAIC Black Belt project. It represents neither the most technical Black Belt project nor the project with the greatest financial return. Instead, it is an excellent example of the appropriate level of knowledge needed for methods and tools. Furthermore, it relates to newspaper publishing, an industry whose issues virtually anyone can grasp. After the case study, we discuss what leaders need to know about the methods and tools, and we look at how they fit into the bigger picture of holistic improvement, using the case study for illustration.
Understanding the Role of the Methods and Tools: A Case Study
Successfully deploying Lean Six Sigma 2.0 depends on leaders understanding both the methods involved (the overall approaches to improvement included in a holistic improvement system) and the individual tools employed (such as 5S or regression analysis). Leaders don’t need to be experts, but they do need to understand what the methods and tools are, when they are used, when they work, and when they don’t work. Certainly, the more leaders know about the methods and tools, the better, although familiarity is more important than a high degree of technical expertise.
The case study we discuss is an elaboration of the Newspaper Accuracy case from Hoerl and Snee (2012). This case is about reducing errors specifically in newspaper publishing, but it can be extended to the idea of generally reducing errors in processes. This is a traditional Six Sigma project, but we think it illustrates the proper role of individual tools in general, regardless of whether the project is a Six Sigma project, a Lean project, or a Big Data analytics project.
One of the first questions leaders should ask is, “Is this problem important?” The answer here was a clear yes. Nothing is more important to a newspaper than the accuracy of the names, facts, figures, and other information it publishes. In this case, the newspaper reported the promotion of a new CEO in a major U.S. corporation and misspelled the new executive’s name. The newspaper received a call from an unhappy reader—not the new CEO, the company’s public relations department, or the CEO’s spouse, but the CEO’s mother! This points out that accurate information can come from many different sources, some of which are not necessarily anticipated.
Define Phase
In the Define phase, we select a project to work on and define both the specific problem to be solved and the process to be improved. We use key process metrics to guide project selection and identify the goals, and we summarize the resulting project and its objectives in the project charter. The project charter is a key tool of the project definition phase.
A common cause of failure in improvement projects is lack of a common understanding of what the projects will do and accomplish. This can lead to disappointment and finger pointing at project closure. Regardless of the methodology chosen, all projects should develop a charter at the very beginning.
In the newspaper accuracy study, leadership established error reduction as an important issue. For a Black Belt to work on this issue, the newspaper needed a project charter. As discussed in Chapter 6, “Launching the Initiative,” this charter defines the work to be done, including the process involved, the problem statement, the metrics (process baseline, project goal, and process entitlement) associated with the problem, the project objective, the financial impact of the project, the team members, and the project scope.
We looked at common problems encountered in constructing an effective project charter in Chapter 6. Leadership must ensure that, for each project, a charter is created by the project Champion, is refined by the Champion and Black Belt, contains all the relevant metrics, defines the proper scope, specifies all the metrics, names the team members¸ and so on.
In short, the charter must be complete, with no shortcuts taken. It then serves as an internal contract among all project stakeholders. The project scope is important because it defines the boundaries of the project. The scope of the newspaper accuracy project was the editorial process, beginning with assignment of the story and ending with transmission of the story to production. Anything before or after these boundaries was considered out of scope for this project.
Some baseline data showed that although the copy desk might catch and fix as many as 40 errors per day, the rate on a typical day was 20 errors. Each error caused significant problems in the production process, so improvement was needed. A goal was set for this project to reduce the errors by 50 percent, to less than 10 per day.
The financial impact of an error was established as $62 if it was caught at the copy desk, $88 if it was caught in the composing room, $768 if a page had to be redone, and $5,000 if the presses had to be stopped and restarted. Of course, the cost of an error being published is unknown and unknowable.
The team developed an operational definition for an error before any data was collected, to ensure that the data would be accurate and that everyone would be talking about the same thing when discussing errors. It defined error as (1) any deviation from truth, accuracy, or widely accepted standards of English usage, or (2) a departure from accepted procedures that causes delay or requires reworking a story or a graphic. The team also divided the errors into nine categories: misspelled words, wrong number, wrong name, bad grammar, libel, word missing, duplicated word, fact wrong, and other. Obviously, not all of these errors are equally serious.
The 11-person team consisted of the Black Belt, the editor, two copy editors, two graphics editors, one reporter, and four supervisors. This team was large (we recommend teams of four to six), but it was effective. Larger teams have difficulty finding mutually agreeable meeting times, reaching consensus, and making decisions. Fortunately, team size turned out not to be a problem in this case.
Measure Phase
The Measure phase is intended to ensure that we are working on improving the right metrics (the ones we truly need to improve) and that we can measure well. This phase focuses on selecting the appropriate process outputs to be improved, based on the objectives of the project and customer needs. We determine what is acceptable performance and gather baseline data to evaluate current performance. This work includes evaluating the performance of both the measurement system and the performance of the process being studied.
As we discussed in Chapter 3, “Key Methodologies in a Holistic Improvement System,” tools used during the Measure phase include the process map, cause-and-effect diagram or cause-and-effect matrix, measurement system analysis, capability analysis, and a control chart analysis of the baseline data on the process output. Quality Function Deployment (QFD) can also be used to refine and validate the output metrics (often referred to as CTQs).
Process mapping, cause-and-effect diagrams, capability studies, and control charts are popular improvement tools discussed by Hoerl and Snee (2012) and other authors. For more detailed discussions on analyzing measurement systems, see the Automotive Industry Action Group (AIAG, 2010) and Wheeler and Lyday (1989). Breyfogle (2003) elaborates on the use of the cause-and-effect matrix.
The process map is prepared by the team, not the Black Belt alone. It provides a picture of the process and identifies non-value-added work and the hidden factory where the reworking is done. Reworking refers to redoing substandard work done previously, such as finding and correcting errors in financial reports. Non-value-added work refers to work that adds no value to the product or service but that is currently required because of inefficiencies in the process. For example, warehousing finished goods adds no value from a customer point of view, but some level of warehousing is typically needed to maintain a supply chain.
The first process map is typically prepared at a macro level and usually consists of five to ten steps. If the team needs further detail for some key steps, it can map them further, creating substeps for each macro step.
The team usually identifies important process input and output variables during the process mapping work. Figure 10.1 shows the newspaper five-step process map for writing and editing. Note that the revision cycle can be a source of both non-value-added work and rework. The team identified the size of the paper (number of pages), the number of employees absent each day, and the need for a major change in a front-page (cover) story (yes, no) as variables that could have an effect on errors.

Figure 10.1 Newspaper writing and editing process
The purpose of both the cause-and-effect diagram and the cause-and-effect matrix is to enable the Black Belt and the team to study the relationships between the process input variables and the process output variables. In the case of the newspaper accuracy study, the key output variable was errors. The diagram serves as a visual display of the effect, or output variable, and its important causes or input/process variables.
Figure 10.2 shows the cause-and-effect diagram for errors. The cause-and-effect matrix rates the process input variables in terms of their relative impact on the process output variables. It is actually one of the houses (typically the third house) created in a full-blown QFD analysis (Breyfogle, 2003).
For this project, the cause-and-effect diagram was adequate and the cause-and-effect matrix was not needed. As a general rule, we do not have to use every tool on every project; we simply use whatever tools are needed to successfully complete each phase of the DMAIC methodology. Recall that the DMAIC approach can be applied with a wide array of improvement methodologies, not just Six Sigma. Note also that both the cause-and-effect diagram and the matrix are examples of knowledge-based tools; they are developed based on our existing knowledge of the process instead of on objective data. Eventually, we need objective data to ensure that our current understanding is correct and to enhance this understanding.

Figure 10.2 Cause-and-effect diagram showing causes of newspaper errors
In this case, the measurement system analysis consisted of developing the measurement system and errors collection scheme and then validating it. In other instances, particularly in manufacturing, gage repeatability and reproducibility studies (AIAG, 2010) are used to evaluate the adequacy of the measurement system. Gage repeatability and reproducibility (Gage R&R) studies evaluate your ability to replicate results when you take multiple measurements (repeatability), as well as the ability of several people or pieces of measurement equipment to obtain similar measurements (reproducibility). Such analysis is a particularly important step because, in our experience, as many as 50 percent of the measurement systems in use need significant improvement. Of course, measurement issues also extend beyond repeatability and reproducibility, such as those dealing with accuracy (ability to achieve the correct average measurement) and stability over time.
In Six Sigma projects outside manufacturing, such as the newspaper study or projects in finance, most of the measurement system work focuses on the creation of the measurement system and the construction of the data collection process. Most measurement systems in finance, for example, were created for accounting purposes, not for improvement.
A process capability study is often conducted to measure how well the process is capable of meeting the customer specifications. Typical outputs of these studies are short-term capability indices (short-term sigma level, Cp, Cpk) in the Measure phase and long-term capability indices (long-term sigma level, Pp, Ppk) in the Control phase. See Automotive Industry Action Group (AIAG, 2005) for definitions of these capability indices. Black Belts often conduct such studies using control charts (AIAG, 2005, Montgomery, 2012), which are graphical depictions of performance level and variation over time. A control chart analysis of 44 days of baseline data for the newspaper study showed that the errors were being produced by a stable process with an average value of approximately 20 errors per day, with daily variations from just below 10 to just below 40.
A control chart is a plot of data over time with statistically determined limits of normal variation. A run chart is analogous to a control chart but does not have the statistically determined limits. Figure 10.3 shows a run chart of this data, illustrating the degree of stability, average level, and variation of the process.
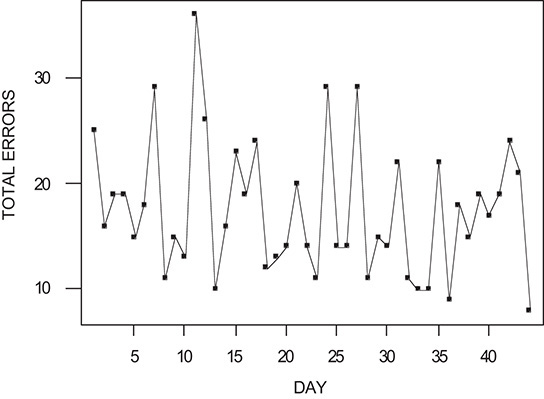
Figure 10.3 Run chart of newspaper errors March–April
Analyze Phase
The Analyze phase helps us avoid the ready, fire, aim approach by accurately diagnosing the root causes of problems. In this phase, we evaluate the baseline data to further document current performance and to identify root causes of the observed variation and defects. Additional data can be collected as needed.
Two improvement tools commonly used in the Analyze phase are multi-vari studies and failure mode and effects analysis (FMEA). Multi-vari studies is a generic term for any process study in which we collect data on the key process and input variables, as well as on the key outputs. We then analyze the data using graphical and statistical tools such as regression analysis and hypothesis testing, to identify the variables that have the most significant impact on the output variables. FMEA is a disciplined methodology for identifying potential defects and taking proactive steps to avoid them. More detailed explanations of these tools are given in the references at the end of this chapter.
When we evaluate data on discrete errors, we often use Pareto analysis to determine which categories of errors are the biggest problems. A Pareto chart (see Figure 10.4) is basically a bar graph whose bars are ordered by number or magnitude of occurrence. The theory is that a few categories will account for the majority of the errors. This is the case in the newspaper errors study. In Figure 10.4, we see that the majority of the errors during the March–April time period were due to misspelling; wrong names, numbers, and facts; and poor grammar.
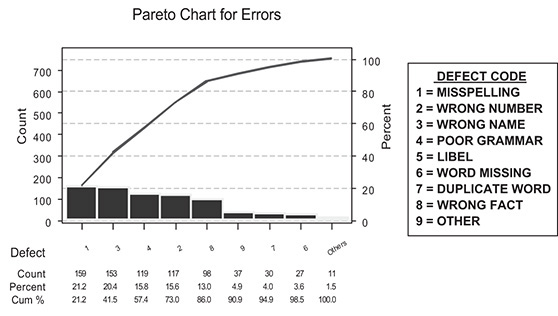
Figure 10.4 Pareto chart of newspaper errors March–April
The team initially focused its attention on addressing these categories and identified a major root cause: Reporters were not using the spell checker. The typical attitude was, “I don’t have time to spell-check. Besides, the copy editors will catch the errors anyway.” The reporters were also not routinely checking their facts and their sources, which was a job requirement. We address how to deal with these root causes in the improve phase.
A multi-vari study is often conducted to identify variables that could be producing the errors. The variables studied in the newspaper case were identified in the Measure phase: the size of the paper, the number of employees absent, and major changes made to the front-page story. The size of the paper was controllable, but the other two variables were not. The team also studied days of the week and months of the year. Work teams often perform differently on Mondays and Fridays than on the other days of the week. Analysis of the data indicated that the only variables with a clear effect on errors were the size of the paper (more pages leads to more errors) and changes in the front cover story (new stories had to be created under very tight schedules, increasing the error rate).
Improve Phase
In the Improve phase, teams figure out how to change the process to address the root causes identified in the Analyze phase, thereby improving the performance of the process. Each process change should be tested with a confirmatory study to verify that the predicted improvements actually happen. Several rounds of improvements might be needed to reach the desired level of performance. Note that this is the only phase in the DMAIC process that actually makes improvement. The other phases are intended to properly set up (DMA) and maintain (C) the improvements from this phase.
At this point in the newspaper case, management reaffirmed that reporters were responsible for checking the accuracy of their articles. Three job aids were also created: a “Spell Check How-To,” a list of “10 Rules of Grammar,” and the “Pyramid of Trust,” which detailed the sources that can be trusted to produce accurate names, facts, and numbers.
These new working methods were communicated in an all-hands meeting in July. Management also discussed the importance of being careful when the front cover story changed with little notice and called attention to problems associated with large editions of the newspaper. The interim goal of letting less than 10 errors reach the copy desk per day was also reviewed and reaffirmed.
One month went by, and it was then time to test whether the changes were having an effect. Data for the month of August was analyzed, which found that the total errors had not changed! The leadership team assembled and reviewed the situation. Why were errors still high? Leadership learned that the new procedures were simply not being used. Many employees did not feel that leadership was serious about the changes and, therefore, did not take them seriously. This emphasizes the point that deciding on improvements and actually implementing them effectively are two different things. The editor reiterated that the new procedures were to be used and that the leadership team was expected to lead this new way of working. Another all-hands meeting was held to address the issue.
One month later, when the latest data was analyzed, total errors had dropped significantly (see Figure 10.5). In another month, the total errors had dropped by approximately 65 percent, compared to the goal of 50 percent. The new procedures were clearly working.
It is not uncommon to find that new procedures are not being used. It is the leadership’s responsibility to ensure that the new way of working is put into practice. Otherwise, the benefits of the project will not be realized. Project reviews, confirmatory studies, and process audits are effective ways to identify whether the process changes are being used and are effective.
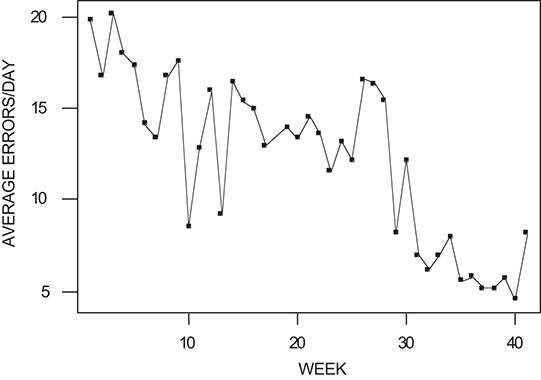
Figure 10.5 Run chart of weekly average newspaper errors March–December
In some instances, particularly in manufacturing processes, additional work needs to be done in the Improve phase to obtain the desired process performance. Typical studies include verifying cause-and-effect relationships identified in the Measure and Analyze phases, identifying optimum operating conditions, and defining process specification limits. The tools of statistical design of experiments (DOE) and response surface methodology can be helpful in these instances (Box, Hunter, and Hunter, 2005; Myers et al., 2016). Designed experiments have been successfully used in nonmanufacturing studies, and their use continues to grow in this important area of improvement (Koselka, 1996).
Control Phase
In the Control phase, we implement a system to ensure that the improved performance of the process is sustained after the team has completed its work and moved on to another project. The key tools of this phase are the control plan (AIAG, 2008), including control charts (part of statistical process control—Montgomery, 2012; AIAG, 2005) and long-term capability studies.
Returning to our newspaper case, we see that although the errors were significantly reduced, errors were not yet at zero. More work was needed to achieve further improvement. In the meantime, a control plan was put in place to hold the gains of the work done to date and to keep the errors at the level obtained. This is the purpose of the Control phase in Six Sigma: to hold the gains. The control plan specified that the following measures would be monitored using control charts:
![]() Total errors
Total errors
![]() Errors by category
Errors by category
![]() Percent of articles checked by the author
Percent of articles checked by the author
![]() Percent of articles spell-checked
Percent of articles spell-checked
The latter two measurements were particularly useful in detecting when the reporters were not following procedures and thus when errors would likely be a problem.
The team created checklists (Gawande, 2009) and defined roles and responsibilities, including backups, to reduce handoff problems between departments. This approach enabled people to view their work processes as part of an overall system. To obtain further improvements, another team was chartered to find the sources of errors in the newspaper graphics and eliminate them.
Results
In addition to reducing the errors by 65 percent, the new way of operating had other benefits:
![]() Fewer missed deadlines, including the ability to deal effectively with extremely tight deadlines.
Fewer missed deadlines, including the ability to deal effectively with extremely tight deadlines.
![]() Improved morale at the copy desk. Copy editors’ time was freed up to make better use of their talents and training.
Improved morale at the copy desk. Copy editors’ time was freed up to make better use of their talents and training.
![]() Reduced re-entering of names (rework).
Reduced re-entering of names (rework).
![]() Identification of more efficient and less costly sources of information, resulting in reduced errors and lower input time (less manual input of data). News assistants’ time was freed up to do more valuable work.
Identification of more efficient and less costly sources of information, resulting in reduced errors and lower input time (less manual input of data). News assistants’ time was freed up to do more valuable work.
Fewer errors resulted in less non-value-added work and a more streamlined and effective process. Such effects are characteristic of what happens when the errors and defect levels of business processes are reduced. The processes work more effectively and efficiently, costs are reduced, employee moral improves, and customer satisfaction increases.
It is not uncommon for a project, when completed, to achieve improvements to the process that were not anticipated initially. Leaders should be on the lookout for these situations and make sure that all the benefits are included in the financial impact calculation of the project. It is also important that the benefits of the project be communicated widely and that the success of the project be appropriately celebrated.
We also note that two commonly applied improvement tools, FMEA and DOE, were not used in this newspaper accuracy project. This is not unusual. In any given project, some tools are not needed; in other cases, the work might have already been completed in a previous phase. Leaders should assess whether the proper tools were used and provide input to the Black Belt as appropriate. Sometimes the unused tools are needed in subsequent studies. In the newspaper accuracy case, the error rate was reduced to less than 10 per day, which is not 0, the desired state. FMEA and DOE might prove useful in subsequent projects intended to make further improvements.
How to Think About the Methods and Tools
The methodologies incorporated into an organization’s improvement methodology portfolio, as well as the individual process improvement tools utilized by each, are clearly an integral part of holistic improvement. As illustrated in the newspaper case study, without selecting an appropriate methodology to fit the specific problem, and without including powerful technical tools within it, Lean Six Sigma 2.0 would regress into a collection of vague concepts, slogans, and other fluff. The methodologies and underlying technical toolsets bring rigor to holistic improvement. The MBBs, Black Belts, and Green Belts are the resources primarily responsible for using the methodologies and subsequently the tools. This raises the question, “How should leaders such as executives, business unit leaders, and Champions think about the methods and tools?”
First, it is important to understand that these leaders do not need to become professional statisticians or even develop particular skills in using each methodology and tool. Of course, we can never have too much knowledge, but forcing leaders to become technical experts (as some executives have attempted to do) is a misguided approach. They simply don’t need this expertise to do their job. After all, in the vast majority of projects, such as the newspaper case study, these leaders will not be the ones directly applying the tools. On the other hand, we recommend that leaders study and learn the methods and tools well enough to complete good Leadership Green Belt projects, as discussed in Chapter 8, “Sustaining Momentum and Growing.” These might be Six Sigma projects, Lean projects, or some other methodology known by the specific individual.
At a minimum, leaders should understand the basics of Lean and also Six Sigma (for most organizations, the initial deployment will be Lean Six Sigma instead of holistic improvement). During Green Belt training, leaders should actually complete their own projects instead of relying on MBBs or Black Belts in their organizations to do this for them. There’s no substitute for personal experience with the tools and the overall DMAIC process. As we have discussed previously, DMAIC is a generic process and will work as a framework for most improvement methodologies.
Two extreme viewpoints that leaders should avoid are, at one end, feeling that they need to become experts in all the methodologies and all the tools, and, at the other end, refusing to study the methods or tools at all. For example, when the topic of the technical tools comes up, some leaders will joke, “I was never good at math!” Such an attitude belittles the importance of the tools and diminishes this leader’s ability to hold meaningful project reviews.
The more appropriate middle ground is for leaders to study and struggle with the methods and tools like everyone else in the organization and to apply them to their own projects. They should understand what the key methods are and what type of projects might be most appropriate for each. For at least Lean and Six Sigma, they should know the typical tools utilized, when they should be applied, and what information each produces. This understanding will help leaders hold useful project reviews and overall initiative reviews.
Leaders don’t necessarily need to understand the mechanics of how each method works, or the underlying mathematics of each tool. They do need to understand how the methods integrate in a portfolio that will address the vast majority of problems facing the organization. Additionally, leaders should avoid having a favorite methodology, whether it is Six Sigma, Lean, Work-Out, Big Data analytics, or something else. Individuals in their organizations might be tempted to defer to the boss’s favorite approach instead of selecting it based on the specifics of the problem at hand.
Leaders should understand and publicly reinforce some key principles, listed next. Following this list, we elaborate on a few of the given points.
![]() Methodologies should be selected objectively, based on the problem; never pick the methodology first and then restate the problem to fit the preselected approach. Recall that holistic improvement is method agnostic.
Methodologies should be selected objectively, based on the problem; never pick the methodology first and then restate the problem to fit the preselected approach. Recall that holistic improvement is method agnostic.
![]() The individual statistical and process improvement tools provide the rigor in holistic improvement, when properly linked and integrated within an overall methodology.
The individual statistical and process improvement tools provide the rigor in holistic improvement, when properly linked and integrated within an overall methodology.
![]() The methods and tools themselves don’t make improvements; the action taken by people applying the methods and tools generates improvement.
The methods and tools themselves don’t make improvements; the action taken by people applying the methods and tools generates improvement.
![]() No single individual will have expertise in every method and every tool; a team is needed to cover all the bases.
No single individual will have expertise in every method and every tool; a team is needed to cover all the bases.
![]() If the leadership aspects of holistic improvement are not in place, the methods and tools will not have lasting effect.
If the leadership aspects of holistic improvement are not in place, the methods and tools will not have lasting effect.
![]() Within each methodology, the improvement tools should be combined with subject matter knowledge in an iterative cycle of generating, testing, and revising hypotheses.
Within each methodology, the improvement tools should be combined with subject matter knowledge in an iterative cycle of generating, testing, and revising hypotheses.
Tools Themselves Don’t Make Improvements
Notice from the newspaper case study that all improvements to the publishing process came about from actions taken by people, not from Six Sigma or the individual tools. For example, implementing (and actually using) well-designed job aids significantly improved accuracy. Of course, use of the tools helped identify the root causes of inaccuracy and determine the best countermeasures to deal with these root causes. Pareto analysis was a key tool in this project. As with most Black Belt projects, rigorously defining the appropriate metrics to be improved and then obtaining relevant data for improvement purposes were key challenges. In this case, developing a precise definition of an accuracy error was critical for progress.
The key point here is that the tools help identify the root causes of problems and potential solutions, but for improvement to occur, people need to take action based on the tools. For example, numerous investment organizations lost large sums of money when the U.S. economy nosedived in late 2008, resulting in numerous bankruptcies and other financial defaults. Interestingly, many of these investment companies had sophisticated tools designed to predict such defaults. No doubt some of these tools were poorly constructed, but it is clear that many investment firms lost money not because of tool inadequacy, but rather because of lack of prompt action based on the tools.
Tools Must Be Properly Sequenced
The tools must also be properly sequenced and integrated within the overall methodology to be effective. Figure 10.6 illustrates how the most commonly used tools are typically sequenced and integrated by the DMAIC process during Six Sigma projects. There is a logical progression, with the input of one tool often being the output from a previously used tool. As discussed earlier, the sequence of tool application is based on the sequence of DMAIC; Figure 10.6 simply highlights the way the tools used in the various steps of DMAIC link to one another. Of course, the specific tool linkage depends on the individual methodology. For example, in Lean, the 5S process follows a similar logical sequence with tool linkages.

Figure 10.6 Six Sigma tool linkage
The process map, or flowchart, is typically the first formal tool used in Six Sigma. The process map sets the stage for subsequent tools by carefully documenting a common view of the process. This map enables people to see their piece of the process in the context of the bigger picture. The cause-and-effect (C&E) matrix naturally follows the process map. After the team agrees on the major steps in the process, it is logical to determine which steps and process variables are most critical to achieving our critical to quality metrics (CTQs). The C&E matrix does this by noting how strongly each process step and variable impact each CTQ. The process map and C&E matrix also provide input to the control plan by documenting the process steps and variables that need to be included.
When the C&E matrix identifies the priority steps, the team needs to ensure that it can accurately measure the key variables at these steps, utilizing a measurement system analysis (MSA). In addition, the team might begin a formal failure mode and effects analysis (FMEA) to identify potential failures in the prioritized steps and variables and then begin proactive countermeasures to prevent them. When the team is convinced that it can accurately measure the key variables, it will likely evaluate process capability using capability analysis tools. Assuming that the capability is insufficient, the team can use a multi-vari analysis to identify the key process variables that are causing the bulk of the variation in the process outputs (CTQs). Formal design of experiments (DOE) provides additional power to resolve ambiguities and quantify cause-effect relationships.
A key characteristic of the Six Sigma methodology is that the output of each of these tools provides input to the control plan by determining the most important aspects of the process that need to be controlled to maintain improvements. This approach greatly simplifies development of the control plan because much of the hard work has already been done. Statistical process control (SPC), the other commonly used tool depicted in Figure 10.6, is then utilized by the control plan to quickly identify abnormal behavior in the process so that root causes can be found and addressed. Statistical process control uses control charts to document the range of normal behavior in the process, allowing early detection of potential problems before they become major issues.
This logical integration of tools into an overall improvement process is a major contribution of the Six Sigma methodology. Statistical and process improvement tools have been around for a long time and have been promoted by many other initiatives, such as Total Quality Management (TQM). However, instructors have generally taught practitioners a collection of tools without providing guidance on how to properly integrate or sequence them to solve a real problem. This approach often left people confused on how to start or where to go next after applying one tool. Of course, other improvement approaches also link and integrate individual tools in logical ways; these include DFSS, statistical engineering, and Kepner–Tregoe.
Leadership Is Still Required
We have attempted to stress throughout this book that leadership is the key to success with Lean Six Sigma and especially holistic improvement. This is also true for effective use of the tools. If the leadership component is lacking, no amount of tool usage can overcome this deficiency. For example, when the job aids were originally rolled out to the newspaper organization, subsequent data revealed no improvement. Why? People did not think management was serious, so they did not use the job aids. If this situation had been allowed to continue, the project would have ended in failure. Fortunately, the editor exerted leadership by directly addressing the problem and insisting that the job aids be utilized. Errors decreased dramatically in the next few months. There is no substitute for leadership.
Leaders should be continuously looking for similar situations in their own organizations where effectiveness of tool applications is being hampered by leadership issues (bureaucracy, politics, lack of clear direction, and so on). These issues tend to be the ones the Black Belts and even MBBs are unable to address on their own, and they are one reason for having a formal Champion role. Effective use of tools should be another area of focus at both project reviews and overall initiative reviews.
Incorporate Subject Matter Knowledge
Keep in mind that the methods and tools work best when they are combined with good subject matter knowledge in the technical area of the project, whether it is engineering, finance, or marketing. This is why it is helpful to have Black Belts who are knowledgeable in the areas in which they are doing projects. Furthermore, it is always helpful to have subject matter experts on the team.
Subject matter knowledge provides the theory to guide initial use of the tools. The information gained from the tools then helps refine, augment, or revise the original theories. This sequence continues from phase to phase, and tool to tool, resulting in greater and greater process knowledge. This is essentially applying the scientific method to organizational problems. A more detailed discussion of the proper integration of data-based tools and subject matter knowledge can be found in Hoerl and Snee (2012).
In the newspaper accuracy case, it was necessary to have the editor, copy editors, graphics editors, reporters, and supervisors on the team to cover all the key areas of subject matter knowledge. If such subject matter knowledge were not critical, you wouldn’t need such diverse teams. Data and statistics can augment and sometimes even contradict subject matter knowledge, but they are certainly no substitute for such knowledge.
For example, it would likely have been impossible to determine the costs of finding errors at various stages of the publication process without such expertise. Subject matter knowledge also helped guide the original data collection and interpret the results of the data analysis. Of course, the data analysis revised the team’s original theories—for example, dispelling the theory that the number of absent employees was a key contributor to the accuracy problem. As is often the case, analyses of data and subject matter theory enhanced one another when properly integrated.
Leaders should ask questions about what new knowledge the organization has learned from data analyses and how current theories about the process need to be revised based on them. In short, we should have data to validate all our theories, and theories should properly interpret all our data.
In this arena, there are again extreme positions that can inhibit project success. For example, some proponents of Big Data analytics might become enamored with the statistical tools and feel that volumes of data and sophisticated analyses are a replacement for process knowledge. Such analysts tend to skip over the step of interpreting the data in light of subject matter theory, resulting in invalid conclusions (Hoerl et al., 2014). Conversely, some purists might believe that all problems can be solved based on first principles (fundamental laws) of engineering, physics, or finance, and thus resist data collection and analysis. Leaders must push back on both extremes and insist on the proper integration of subject matter knowledge and data analysis. History has proven that the scientific method works best with both.
If leaders understand these key concepts about the methods and tools and also can properly audit for them during project and overall initiative reviews, they will add significant value to their organization’s deployment. Conversely, those who either try to become professional statisticians or totally avoid discussion of the tools will significantly diminish their value-add.
Summary and Looking Forward
Merely launching a Lean Six Sigma or holistic improvement initiative does not guarantee success. The initiative must be properly led and managed to succeed. We believe that the material in this book will help leaders do just that. As we have noted elsewhere, holistic improvement works if you follow the process. If it is not working, you are not following the process.
Certainly, anything can be improved and streamlined. However, readers should be wary of claims of instant success with no significant investment or effort required. The saying “No pain, no gain” holds true in both weight loss and improvement. Lasting success requires both financial and personal commitment. Committed leadership is the single most important key to success.
We have provided an overall process for Lean Six Sigma deployment that goes from initial decision to launch, through expansion to holistic improvement. This process uses Lean Six Sigma 2.0, which ingrains improvement into the fabric and culture of the organization. Previous chapters of this book described each major phase in this process. Although the process does not need to be followed religiously, every organization we know of that has followed it closely (about 30 organizations) has achieved significant success. Leaders need to monitor the success of both the set of individual improvement projects and also the overall initiative itself, until it becomes the way we work instead of merely an initiative. Good luck with your deployment!
References
Automotive Industry Action Group. (2005) Statistical Process Control Reference Manual, 2nd ed.
Automotive Industry Action Group. (2008) Advanced Product Quality Planning and Control Plan, 2nd ed.
Automotive Industry Action Group. (2010) Measurement System Analysis Reference Manual, 3rd ed.
Box, G. E. P., W. G. Hunter, and J. S. Hunter. (2005) Statistics for Experimenters, 2nd ed. Hoboken, NJ: John Wiley and Sons.
Breyfogle, F. W. (2003) Implementing Six Sigma: Smarter Solutions Using Statistical Methods, 2nd ed. Hoboken, NJ: John Wiley and Sons.
Gawande, A. (2009) The Checklist Manifesto: How to Get Things Right. New York: Henry Holt and Company.
Hoerl, R. W., and R. D. Snee. (2012) Statistical Thinking: Improving Business Performance, 2nd ed. Hoboken, NJ: John Wiley and Sons.
Hoerl, R. W., R. D. Snee, and R. D. De Veaux. (2014) “Applying Statistical Thinking to ‘Big Data’ Problems.” Wiley Interdisciplinary Reviews: Computational Statistics (July/August): 221–232.
Koselka, R. (1996) “The New Mantra: MVT (Multivariable Testing).” Forbes (March 11): 114–118.
Montgomery, D. C. (2012) Statistical Quality Control, 7th ed. New York: John Wiley and Sons.
Myers, R. H., D. C. Montgomery, and C. M. Anderson-Cook. (2016) Response Surface Methodology, 4th ed. Hoboken, NJ: John Wiley and Sons.
Wheeler, D. J., and R. W. Lyday. (1989) Evaluating the Measurement Process, 2nd ed. Knoxville, TN: SPC Press.