
Our dashboard is looking really good, but we just want to add one more change to our Simple XML code for the Basic Dashboard. We want to add a table at the bottom of the page showing the top five countries using the website, so that our users accessing our Splunk App will know that the site is being accessed by countries other than USA. So we open up our basic_dashboard.xml file, and we can now add a new element to our charts with the table element:
- After our row for our map element has been closed off, we want to add a new row straight after that, so we start by adding our row, panel, and new table element. Let's also add a title name for the table:
19 <row> 20 <panel> 21 <table> 22 <title>Top 5 Countries</title> - We set up the search element and the query that we are going to be using to find the country location from our IP address:
23 <search> 24 <query>index=main sourcetype="nasasquidlogs" | search From=1* | stats count by From | iplocation From | top 5 Country</query> 25 <earliest>0</earliest> 26 </search> - Finally, close off your table, panel, row, and dashboard elements:
      27       </table>
      28     </panel>
      29   </row>
      30 </dashboard>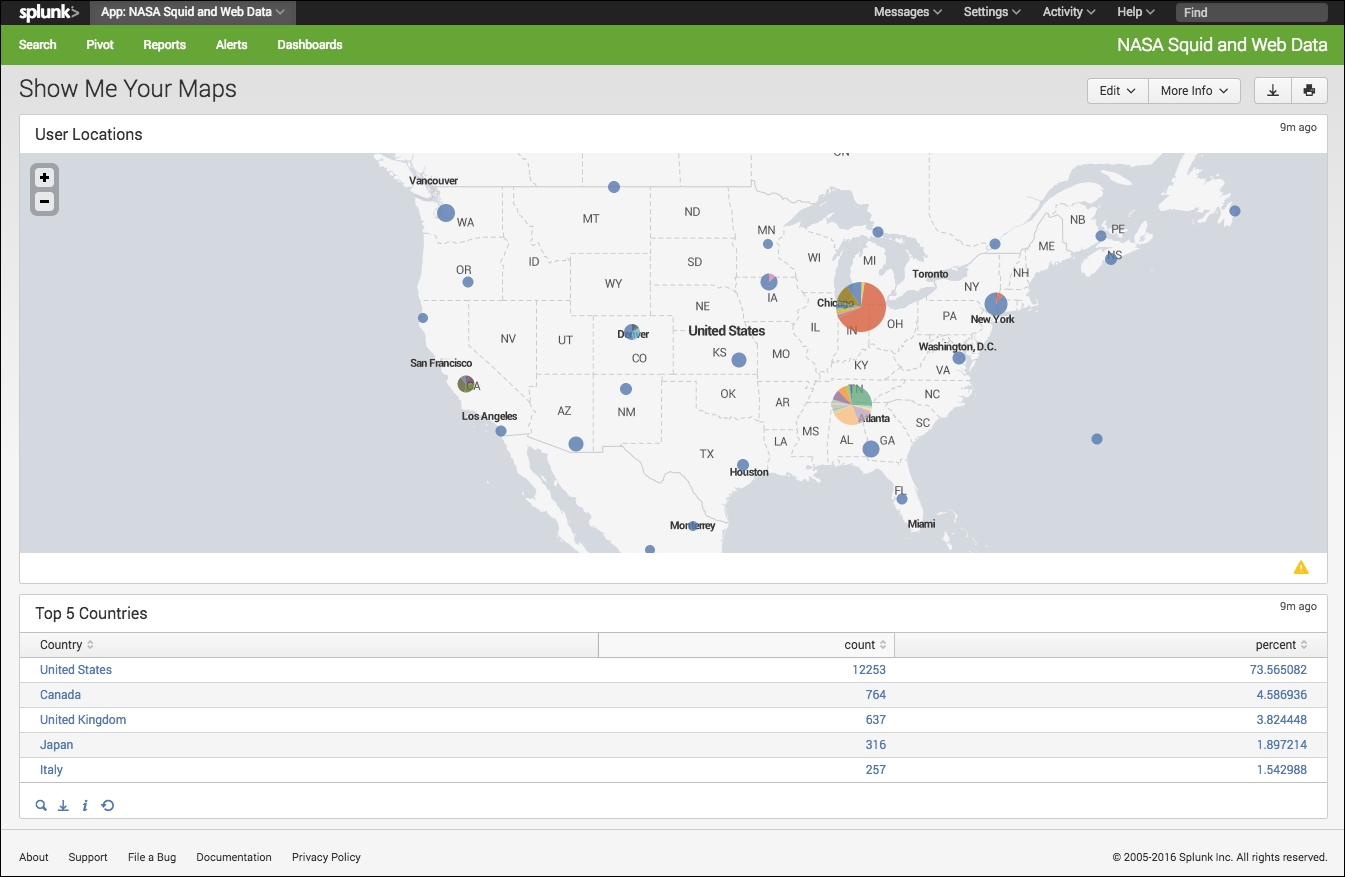
I am hoping that by now you are seeing how easy and quick it is to get your dashboards running by using Simple XML. We have set up a fully functional dashboard, providing some impressive visualizations with only 30 lines of code. And when you get more confident with using Simple XML, you will see that it is actually quicker and easier than using the Splunk Web Interface.