
By now, we have seen that we can make minor changes to the Simple XML to create eye-catching visualizations of our data. We have also added JavaScript to our Splunk App to help us with our dashboard layouts. In the next section, we will also start to add CSS to help our JavaScript further manipulate the layout of our interface.
It may seem a little counter-productive, but we are going to duplicate the Cell Count Ranges chart that we just created. The reason behind this is that we want to show how we can provide the same data, and not just in a different format. We will combine a table and a chart using JavaScript and CSS. Although we are going to add some JavaScript and CSS, we are going to keep things pretty simple, so don't be too worried. In the following code, we are going to do this:
- Make a change to our JavaScript file to allow it to be used in the table elements.
- Add CSS to configure the way these changes will look.
- We will then change our dashboard to display the new table and bar chart combination.
- If you remember correctly, we already had a JavaScript file that we are using in our current dashboard. We are going to add another function to this code. Also, if you remember, this file is in the static directory, so let's add some more code to it.
- We move into our static directory within our Splunk App:
cd $SPLUNK_HOME/etc/apps/cell_biology/appserver/static - Open our
cell_layout.jsfile with a text editor and move to the bottom of the file, as we are going to add another function to our code. We need a few more libraries in this function, so we are going to load them across multiple lines:8 require([ 9 'jquery', 10 'underscore', 11 'splunkjs/mvc', 12 'views/shared/results_table/renderers/ BaseCellRenderer', 13 'splunkjs/mvc/simplexml/ready!' - The main line that we need to be concerned with here is the
BaseCellRendererlibrary, as this will be the library we will use to change the way our table displays. - We now need to close off the
requirestatement, and in this case we will also add the options of the libraries that we are going to extend:14 ], function($, _, mvc, BaseCellRenderer) { - We now create a variable that extends the
BaseCellRendererlibrary, specifically looking for thepercentfield, which is going to be set up in our Simple XML table:15 var DataBarCellRenderer = BaseCellRenderer.extend({ 16 canRender: function(cell) { 17 return (cell.field === 'percent'); 18 }, - The next few lines basically use our library and CSS file to make changes to the percent column to add a bar graph(
data-bar-cell) to the table cell:19 render: function($td, cell) { 20 $td.addClass('data-bar-cell').html(_.template('<div class="data-bar-wrapper"><div class="data-bar" style="width:<%- percent %>%"></div></div>', { 21 percent: Math.min(Math.max(parseFloat(cell.value), 0), 100) 22 })); 23 } 24 }); - The
mvclibrary is then used to run through the components of our dashboard, specifically the table with theidoftableWithBar1, which we will add to our Simple XML shortly:25 mvc.Components.get('tableWithBar1') .getVisualization(function(tableView) { 26 tableView.addCellRenderer(new DataBarCellRenderer()); 27 }); 28 }); - Save the file and create a new file that will hold our CSS information in the same directory, called
cell_layout.css. Add the following code, which will provide us with padding for the cell, height, width and background color of the bar chart in our table:1 td.data-bar-cell { 2 padding: 4px 8px; 3 } 4 td.data-bar-cell .data-bar-wrapper .data-bar { 5 height: 16px; 6 min-width: 1px; 7 background-color: #5479AF; 8 } - We save the changes, and now open our existing dashboard file in the views directory called
cell_counts.xml. Start by changing the first line to include the new JavaScript and CSS files that we are using:1 <dashboard script="cell_layout.js" stylesheet="cell_layout.css" > - Now move to the bottom of the file and delete the last line that closed off the dashboard element. Add in a new row element, panel and table element; and we are also going to give our table element the
idthat we created in our JavaScript file calledtableWithBar1:62 <row> 63 <panel> 64 <table id="tableWithBar1"> - We add in a title for our table and open the search element ready for our new query:
65 <title>More Cell Count Ranges</title> 66 <search> - Our query is going to be a little different from the previous chart. It will be a little shorter and will use the top function, as we can see here:
67 <query><![CDATA[index=main sourcetype=cellsimulation | eval data=_raw | rex field=data max_match=0 "(?<cells>@)" | stats count(cells) AS Count by _time | eval description=case(Count<=10 , "LOW", Count<=20, "MEDIUM", Count>20 , "HIGH") | top description ]]> </query> - Now complete the new table by closing off
search,table,panel, androw, and finally close off the entire dashboard with the ending dashboard element that we removed earlier:68 </search> 69 </table> 70 </panel> 71 </row> 72 </dashboard> - Save all your changes, and as we needed to do previously, we will need to restart Splunk, as this is how we can get our JavaScript and CSS changes to take effect.
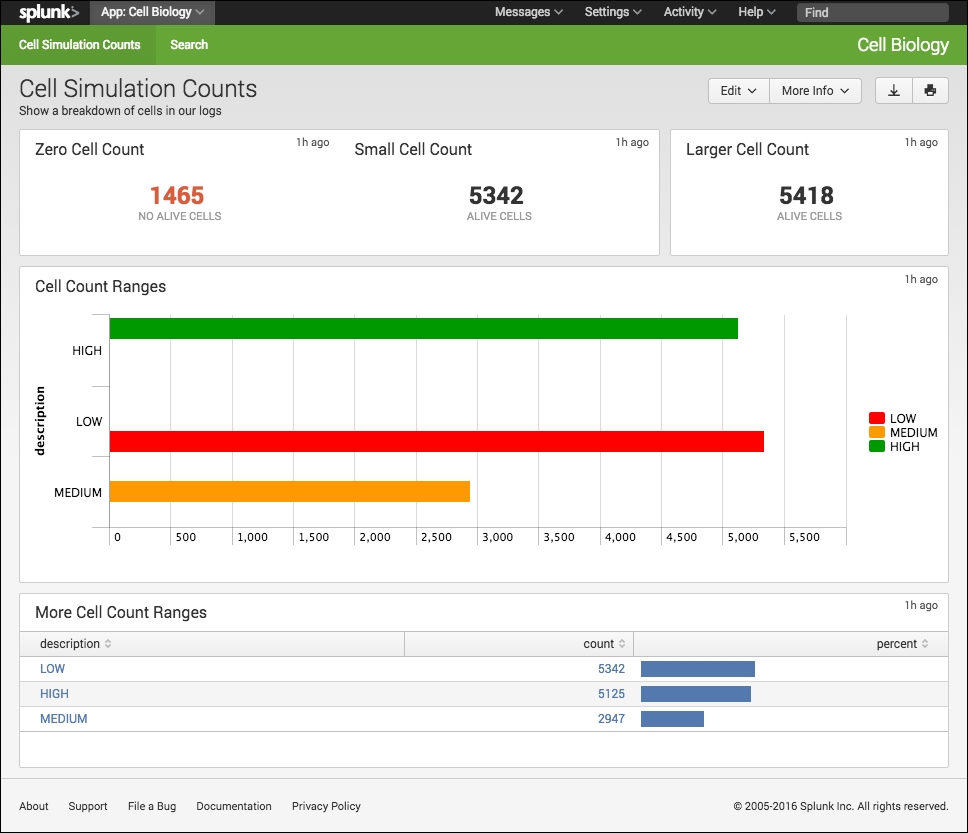
- Our dashboard now displays a bar chart from within the table element. There are lots of examples in the Splunk reference material, so don't be worried if you are new to JavaScript and CSS. Make sure you continue to add and commit your changes to GitHub, and it's time to move on to our next chapter.